 Methodology
Methodology
The AI data centers hub is built on detailed analysis of reliable sources, most of which are publicly accessible. Each data center goes through a pipeline of discovery, research and analysis. Discovery is based on news, satellite imagery, and our previous research. We then analyze commercial satellite imagery, and any available permitting documents and company disclosures, to research key details about a data center. Finally, we apply well-vetted models to estimate key metrics such as IT power capacity, AI compute, and capital costs. Throughout this documentation and the hub, “compute” means AI compute: the capacity of the AI-specialized chips we estimate at a site, rather than all computing at the data center or campus. The following sections explain each of these three phases in detail.
Discovery
We discover data centers through company announcements, news outlets, third-party databases, social media posts, and Epoch AI’s previous work on GPU clusters. For example, OpenAI’s Stargate facility in Abilene was already in the GPU clusters database, while the Goodnight data center was reported by Aterio, and the New York Times first alerted us to Amazon data centers in Mississippi.
We also discover data centers while researching other data centers. For example, while looking into Meta’s Prometheus data center in the New Albany Business Park, we discovered new AWS and Microsoft sites.
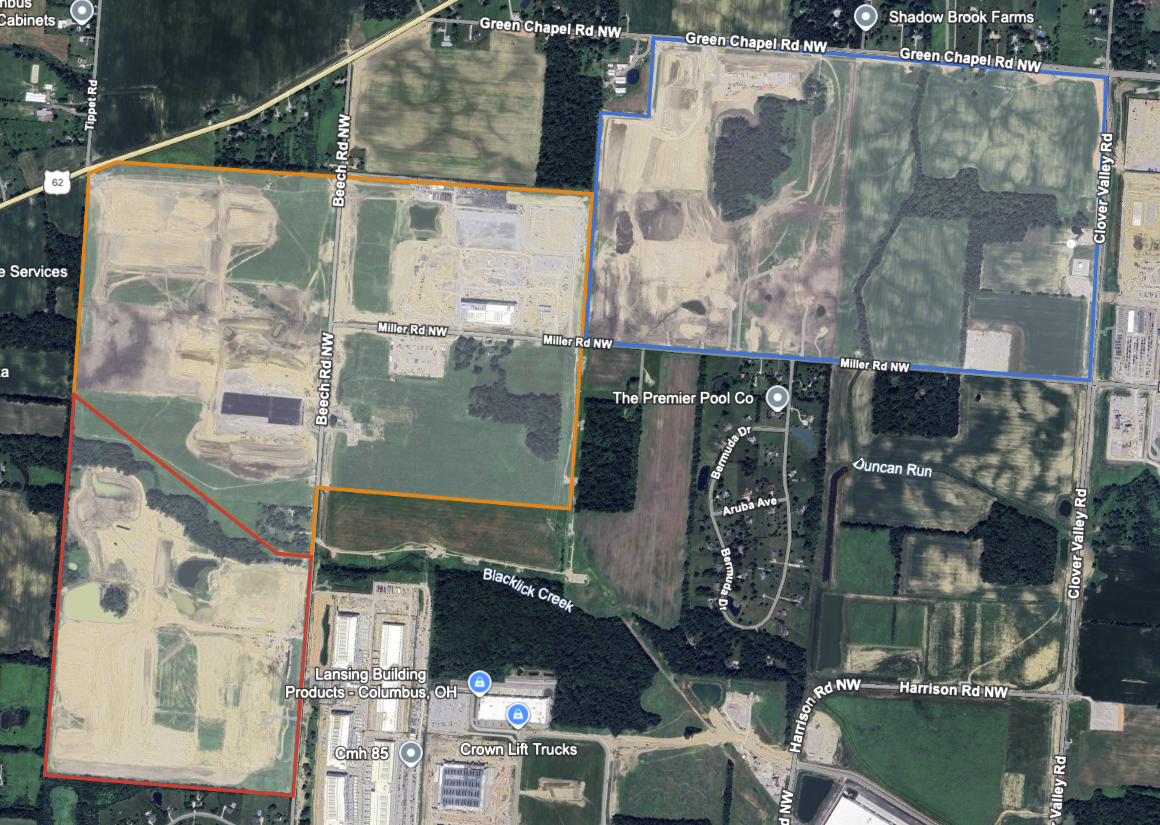
While searching for one of the sites of Meta’s Prometheus data center (outlined in blue), we discovered sites for AWS (orange) and Microsoft (red). Source: Google Earth.
The database mostly consists of data centers in the United States, but coverage is expanding globally. Based on the total amount of AI compute reported in the Chip Sales database, we estimate this database’s coverage of global deployed AI computing capacity to be 44% as of October 17, 2026 (90% CI: 30% to 79%). The details of that estimate are in this Colab Notebook.
We mostly prioritize AI data centers by computing capacity. However, we have a lower bar for capacity internationally compared to the US, to achieve more globally balanced coverage. We also limit coverage to data centers that become operational in 2024 or later (with some exceptions), to focus on AI-optimized facilities. This includes planned data centers, but only if those data centers have started construction, and have a significant chance of being completed based on our analysis. In practice, this limits most of the future coverage to 2–3 years from now.
Research
Once we know about a data center, we use several data sources and tools to learn more about it. The most common and useful sources are satellite imagery, permitting documents, and company statements.
Satellite imagery
Data centers have a large physical footprint, which makes satellite and aerial imagery a great resource to learn about them. We mostly use SkyWatch, both to purchase existing high-resolution satellite imagery and to task satellites to take new images, from vendors such as Vantor and Airbus. We also use Google Earth and public images from the Sentinel-2 satellite (available on Copernicus).
If we only have an approximate location for a data center (such as a city or county), then we sometimes use Google Earth and Sentinel-2 to manually search the area. We might also use prior knowledge of what a company’s data centers look like based on previous examples. For instance, after we read that some Amazon data centers were located in Madison County, Mississippi, we quickly recognized Amazon buildings in the area.
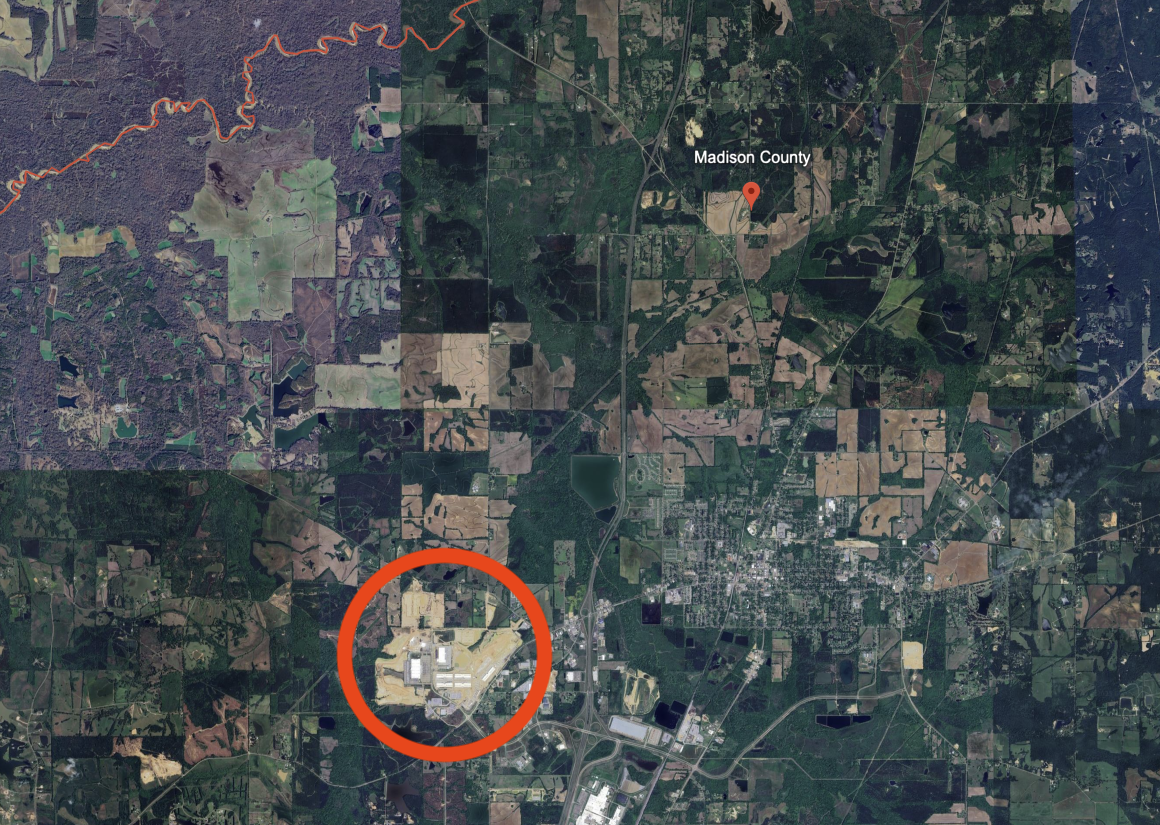
Viewing satellite imagery of a large portion of Madison County, Mississippi, we see a large area of freshly cleared land (indicated by the red circle). Source: Google Earth.
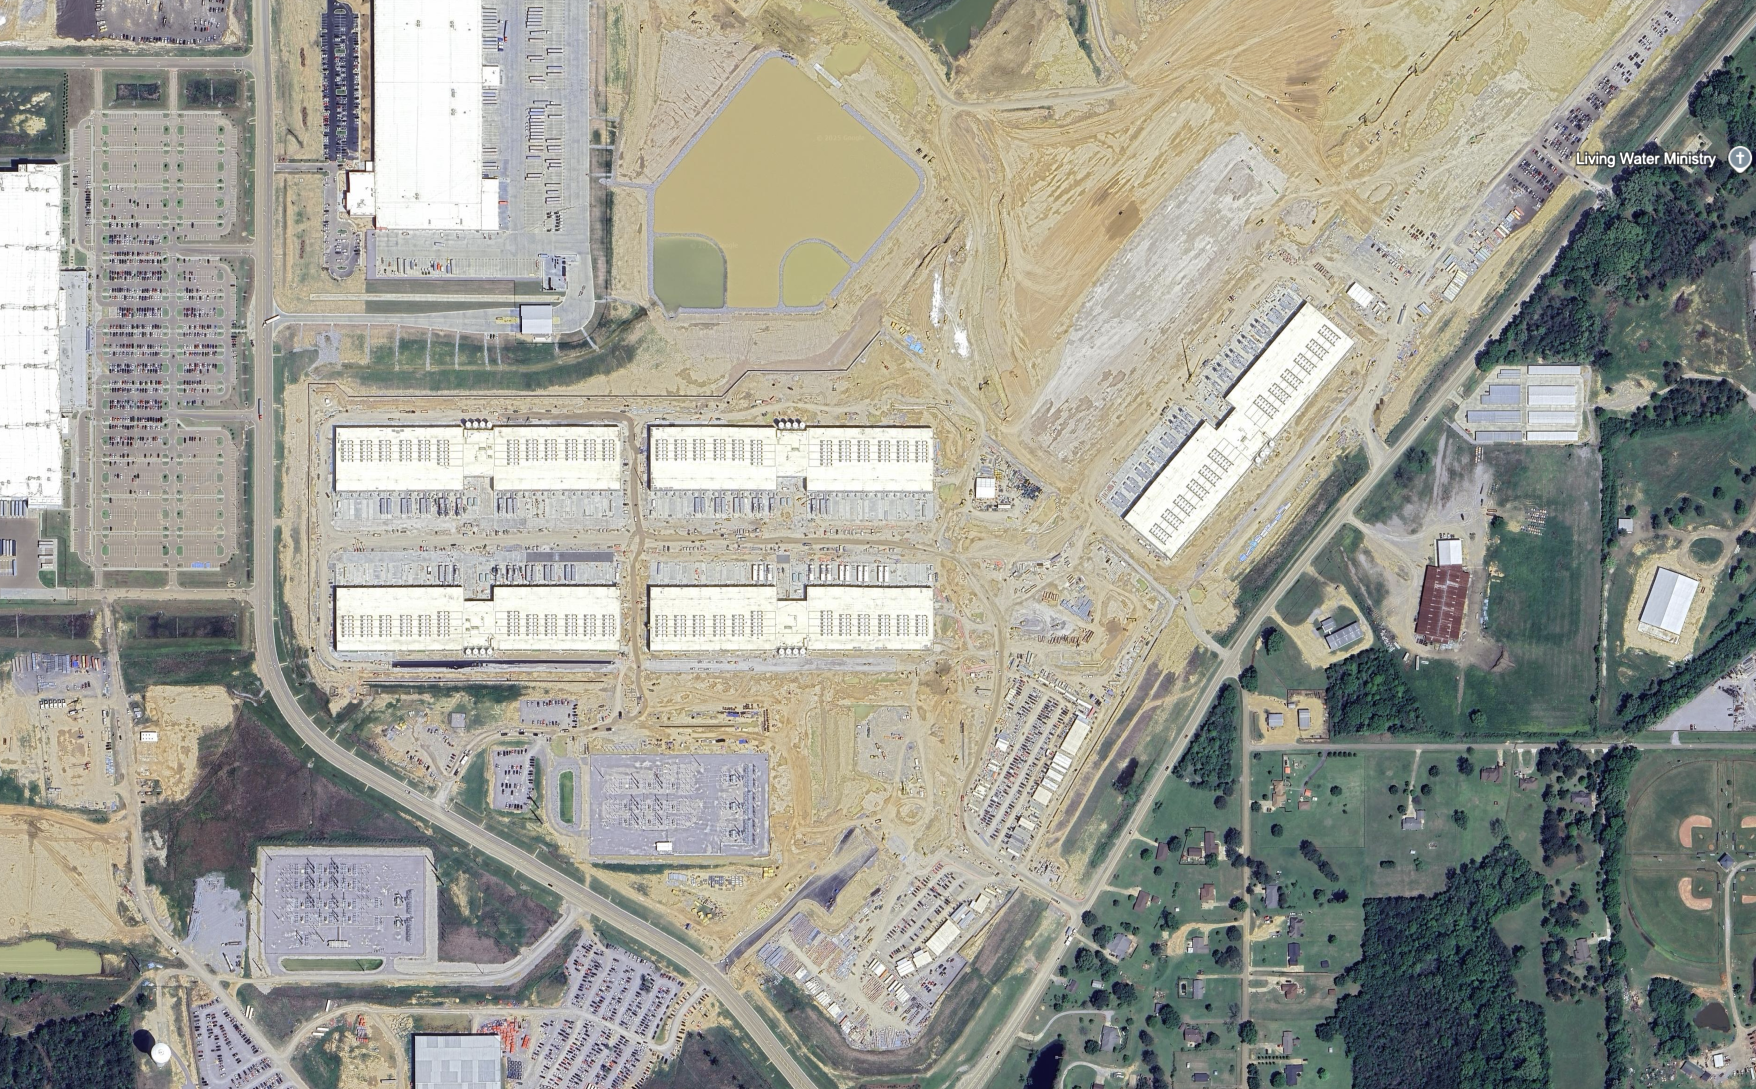
Zooming in, we find buildings that could be data centers. Source: Google Earth.
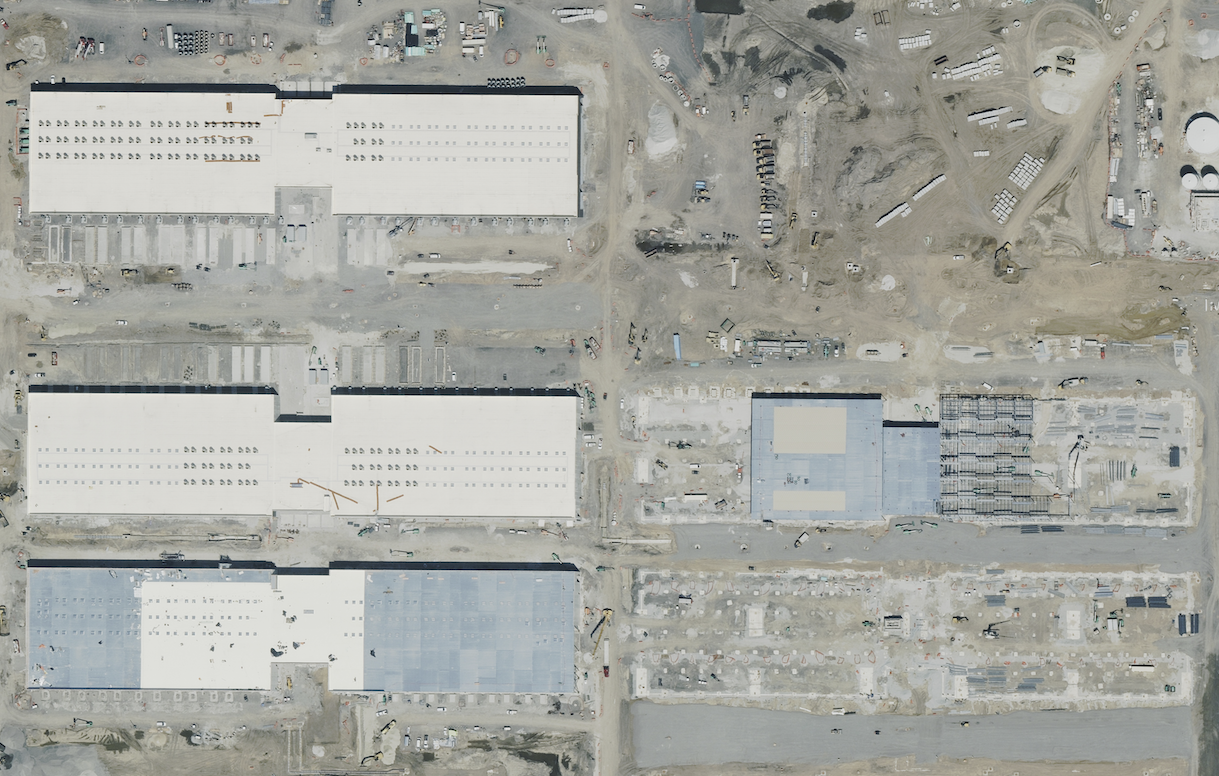
Comparing the buildings in Madison County to an Amazon data center we previously identified in Indiana, we can confirm the discovery of a new Amazon data center. Source: Vexcel, delivered by SkyFi.
There are three key features of modern AI data centers that, in combination, distinguish them from similar buildings like warehouses and factories:
- Cooling equipment. Modern AI data centers generate so much heat that the cooling equipment extends outside the buildings, usually around them or on the roof. Cooling equipment can usually be recognized as rectangular units with fans on top (sometimes the fans appear as dark holes).
- Backup generators. Data centers need backup power in case the main power source—usually the electrical grid, but sometimes a behind-the-meter power plant—drops out. Backup generators are usually diesel-powered and can be recognized as rectangular units arranged in a row, flanking the building. Exhaust stacks that stick upward may also be visible.
- Substation. Even if a data center uses behind-the-meter power to accelerate its operational date, it will almost always be connected to the grid at some point. That means a substation needs to be located near the facility. Substations in the United States usually look like a grey slab with boxes and electric cables on top. In other countries such as China, substations are often covered in a rectangular building, but still have cables coming out of them.
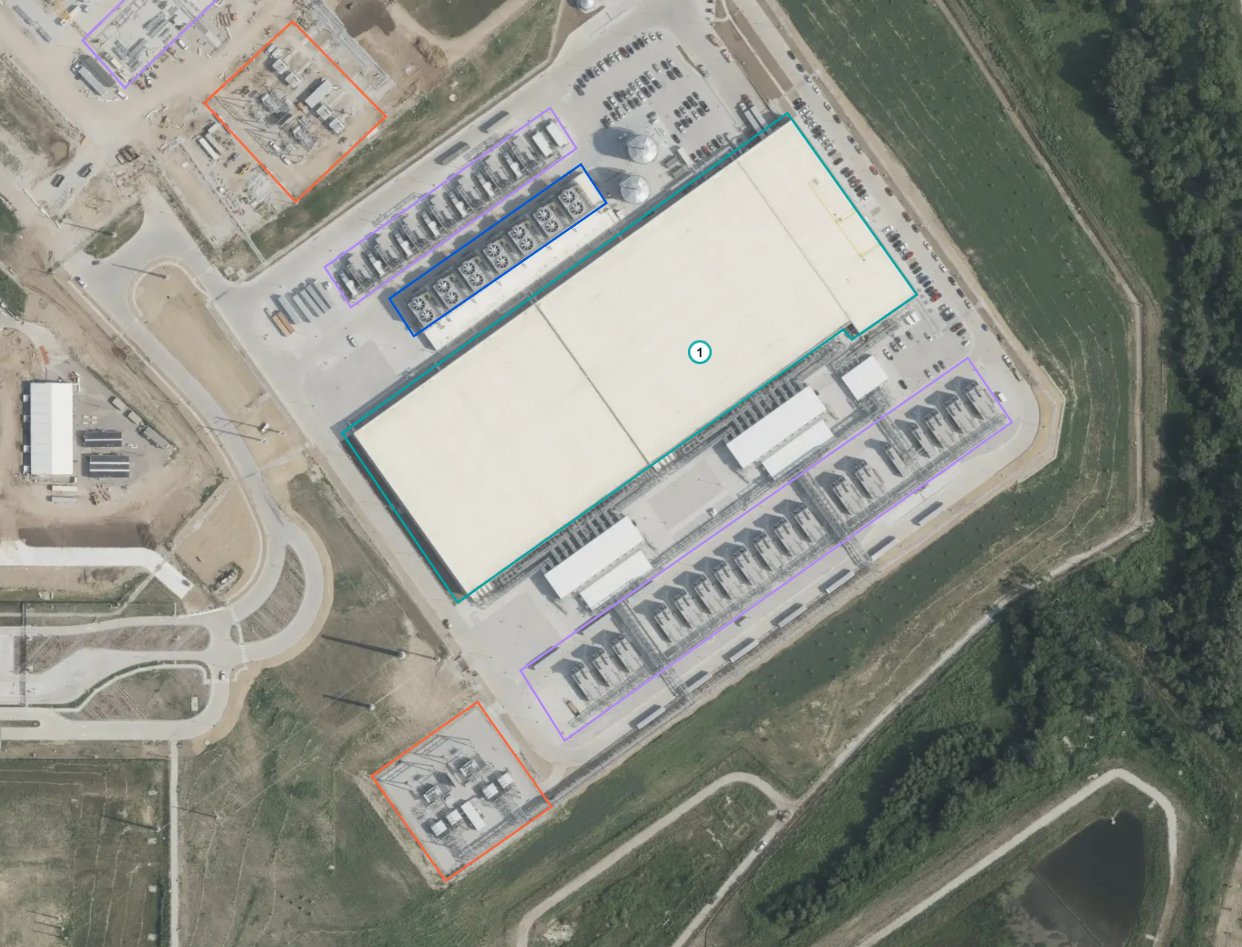
Three distinguishing features of AI data centers in satellite imagery: cooling equipment (outlined in blue), backup generators (purple), and substations (orange). Image from Vexcel, delivered by SkyFi.
If searching published satellite images for a data center doesn’t work, we use AI tools to search for text sources, and this often turns up a more precise address (in a permitting document, for example).
Once we locate the data center precisely, we use satellite imagery to learn several things.
Construction timeline: Data centers come online in stages over the course of months or years, so it’s useful to look at each data center over time. Satellite imagery tells us when land clearing begins, when roofs go on buildings, and when overall construction is finished. Sentinel-2 images are useful to detect land clearing and buildings: though the images are low-resolution, they are free, frequent and up-to-date.
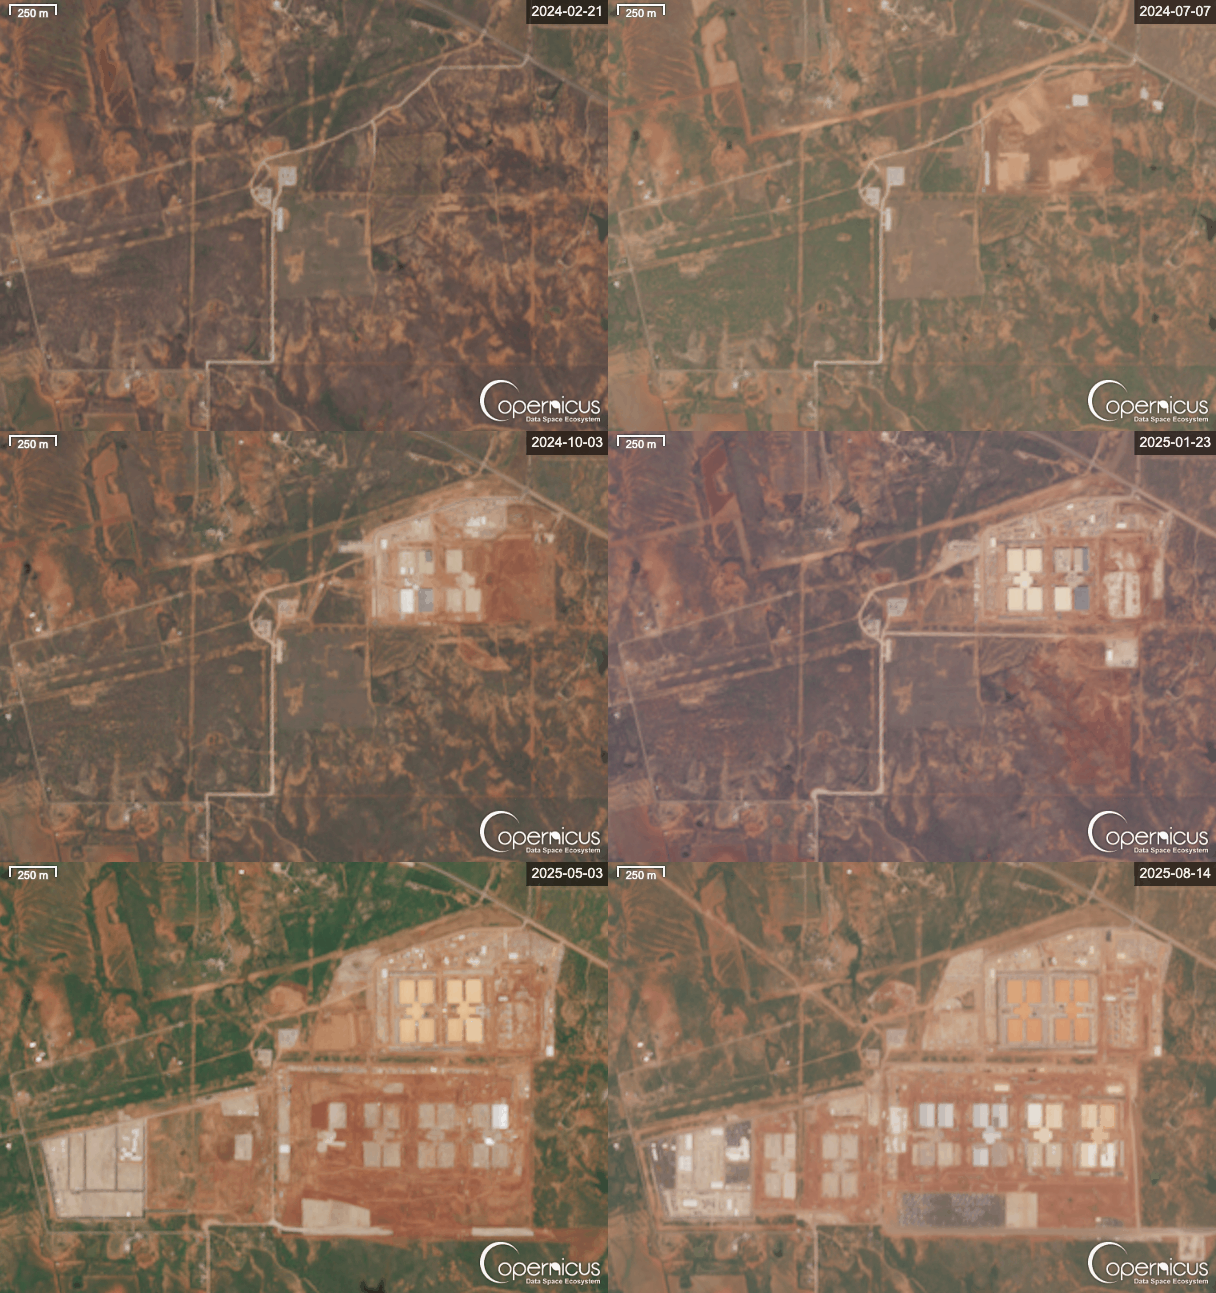
In this timelapse of the OpenAI-Oracle Stargate facility in Abilene, Texas, we can identify the approximate time when land clearing begins, new buildings and facilities start construction, and building roofs are completed. Source: Sentinel-2 via Copernicus.
Cooling equipment: Satellite imagery lets us identify the type of cooling, the number of cooling units, and (if applicable) the number of fans on each unit. Later we will discuss how we plug this data into our cooling model to estimate the IT power capacity of data centers. Very high-resolution images (i.e. 30cm or less per pixel) are helpful to identify cooling, as they show key details such as the number of fans per cooling unit.
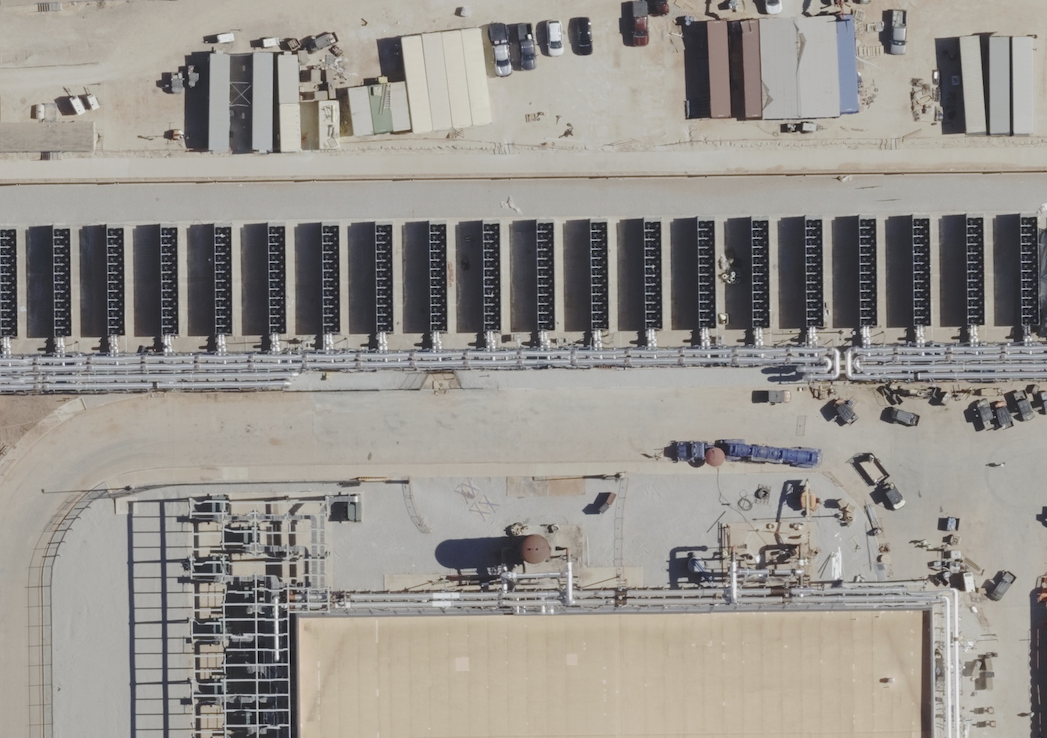
In this close-up of the OpenAI-Oracle Stargate data center in Abilene, Texas, we see a row of rectangular units each with 24 fans. Based on our prior knowledge of how cooling equipment looks, we conclude these are air-cooled chillers. Source: Vexcel, delivered by SkyFi.
Satellite and aerial imagery tells us a lot about data centers, but can leave many things uncertain. Some cooling methods do not have a clear footprint outside of the buildings (though this is rare for modern AI data centers). The owner and user of the data center may be unclear. We may also be uncertain of just how many buildings a site will expand to, if the land isn’t cleared yet. Permitting documents can help address these unknowns.
In addition to satellite imagery, we sometimes use video and thermal imagery captured by drones. This helps determine when data centers are operational, and identify the exact types of cooling and power equipment being used.
Permits and other legal documents
Data center construction is regulated, requiring companies to file permits with local authorities to build their data center. Typical requirements include air quality, water, and building permits.
Local governments typically have online permit databases, with many documents available to the public. We often use AI tools to locate and search these databases for permits related to a data center, though some manual searching and inspection is sometimes needed to get the exact information we’re looking for.
Data centers normally require air quality permits, because they have backup diesel generators that pollute the air when operating. So if an air quality permit document is available, we can at least learn the number of backup generators and the power capacity of each generator. The total capacity of backup generators is often designed to support the peak power capacity of the data center under normal operation. However, sometimes the backup capacity is much lower than the peak power capacity, so it’s important to cross-check with other evidence. This is increasingly true of the largest AI data centers.
An air quality permit is also required if natural gas turbines are used as a main or backup power source. Permit application documents are often rich with other information, including blueprints, the number of buildings planned, the address, and the owner (example). Other legal documents are sometimes useful, such as this tax abatement agreement for Crusoe’s Goodnight Data Center.
Company documents and statements
In some cases, organizations will voluntarily reveal information about various aspects of a data center. For example, Crusoe’s 2024 impact report gave information on the power capacity and the number of GPUs for Stargate Abilene. Mortensen discussed their involvement in Meta’s Hyperion data center in Richland Parish. The grid operator MISO reported new load announcements in 2024, many of which are large data centers. Finally, Elon Musk has posted on X several times about the xAI’s two Colossus data centers. Searching the web using LLMs can help find these publications.
Analysis
After collecting information about a data center, we analyze key metrics such as IT power capacity, compute, and capital cost for different buildings and points in time. We use two main models to accomplish this, depending on the available information.
The first model is for cooling equipment: based on the type, quantity and size of equipment, we can estimate the amount of IT power consumed by the data center. The second model is for compute: based on hardware efficiency in our Hardware database, and who owns which chips in our Chip Owners database, we estimate the type of chips used and their total compute from the IT power capacity. Occasionally we already know the chip type and/or quantity, resulting in a more reliable compute estimate. We validate the outputs of these models by comparing them to each other, and to primary sources where possible.
Cooling model
We built a model to estimate the cooling capacity of various data center cooling equipment. This model is based on the type of cooling and physical features like the number of fans, the diameter of the fans, and how much floorspace the full cooling unit takes up.1 We found strong empirical relationships between these characteristics, based on specifications for hundreds of cooling products.
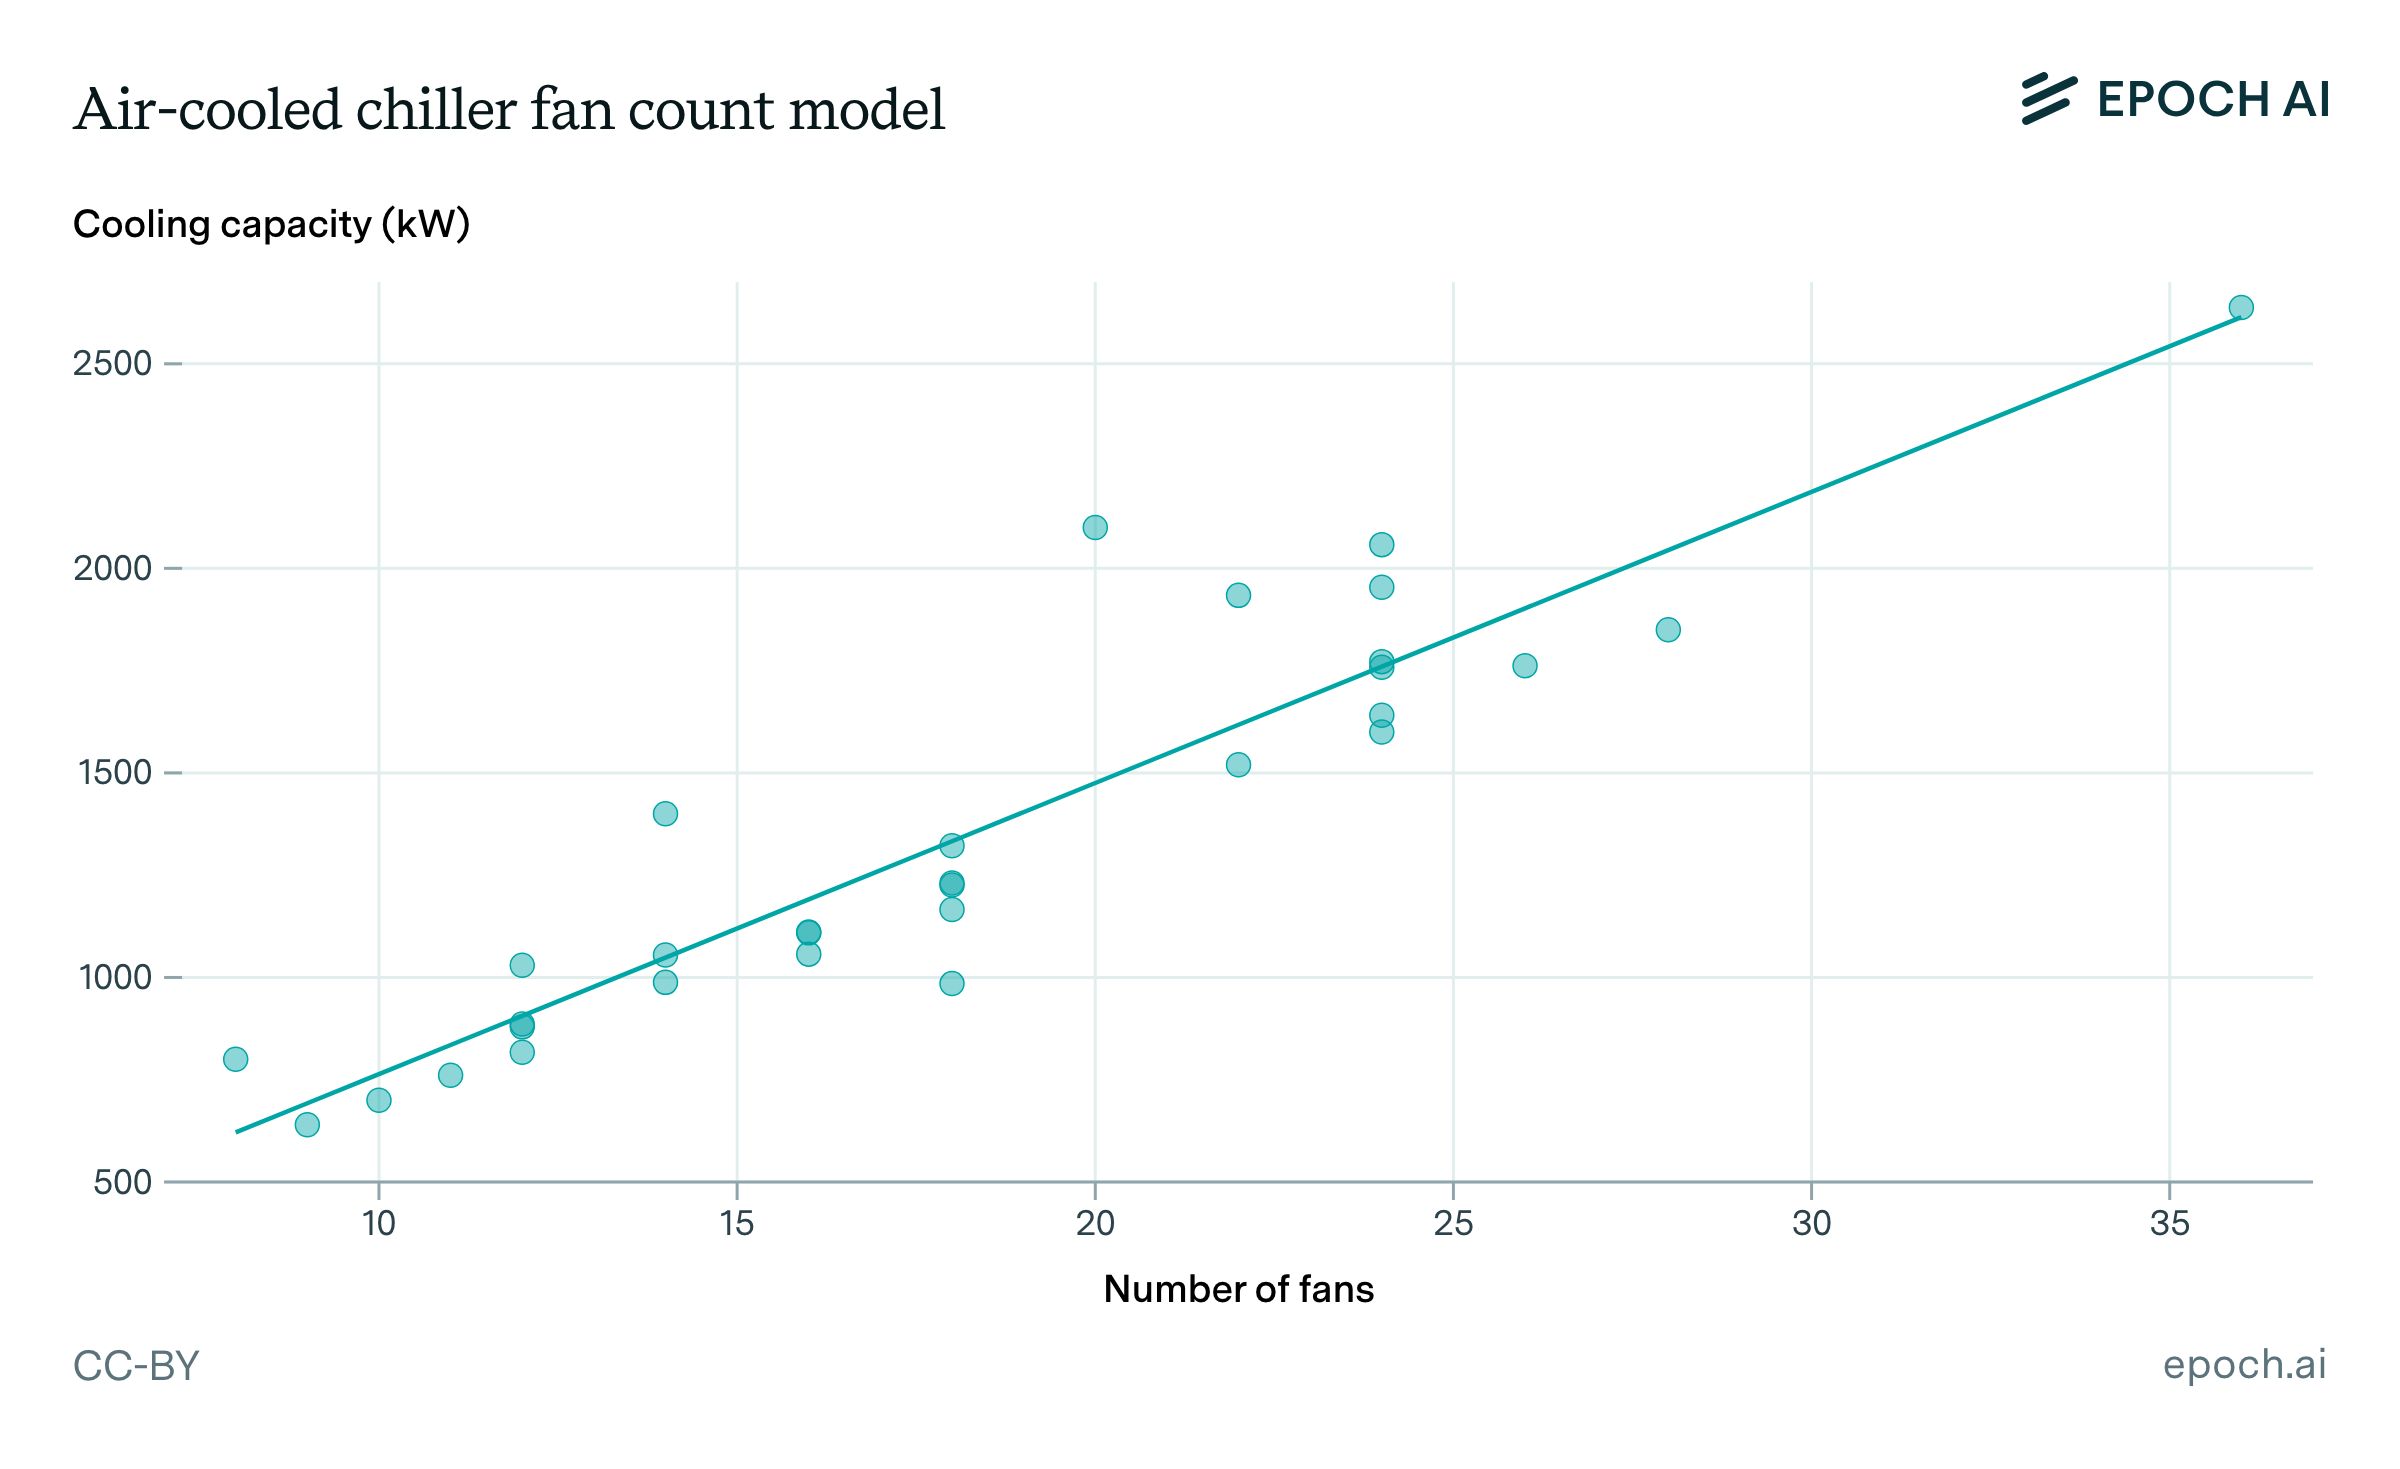
The regression model we used to estimate the cooling capacity of an air-cooled chiller based on the number of fans on the chiller. We use a different model for cooling towers.
After using this model to estimate the cooling capacity per unit, we use the following formulas to estimate the IT power and the total facility power of the data center:
IT power = capacity per cooling unit x number of cooling units / cooling overhead
Total facility power = IT power x peak PUE
The total cooling capacity lies somewhere in between peak IT power and total facility power, because heat is generated not only by IT equipment but also by power supplies and lighting. This is why we divide cooling capacity by a “cooling overhead” to get IT power, and then multiply the result by the peak power usage effectiveness (PUE) to get total facility power. By peak PUE, we mean the total facility power capacity divided by the IT power capacity. This is in contrast to regular PUE, which is the average facility energy consumption divided by IT energy consumption over some time period. We default to a peak PUE of 1.2 for hyperscalers such as Google and Amazon, and 1.4 otherwise, unless we have evidence suggesting a significantly different value.2 For example, air cooling tends to require a higher peak PUE than evaporative cooling because air is less efficient.
The cooling model still has significant uncertainty. Specification data suggests that the actual cooling capacity can be as much as 2× higher or lower than our model predicts, depending on the chosen operating point. However, we have not seen errors that high in practice. In the two cases where we obtained a ground-truth cooling capacity, our estimates are near-perfect. In cases where we have some other reference value, e.g. an estimate of IT power based on chip quantity, the model’s predictions fall between 77% and 118% of the reference value.3
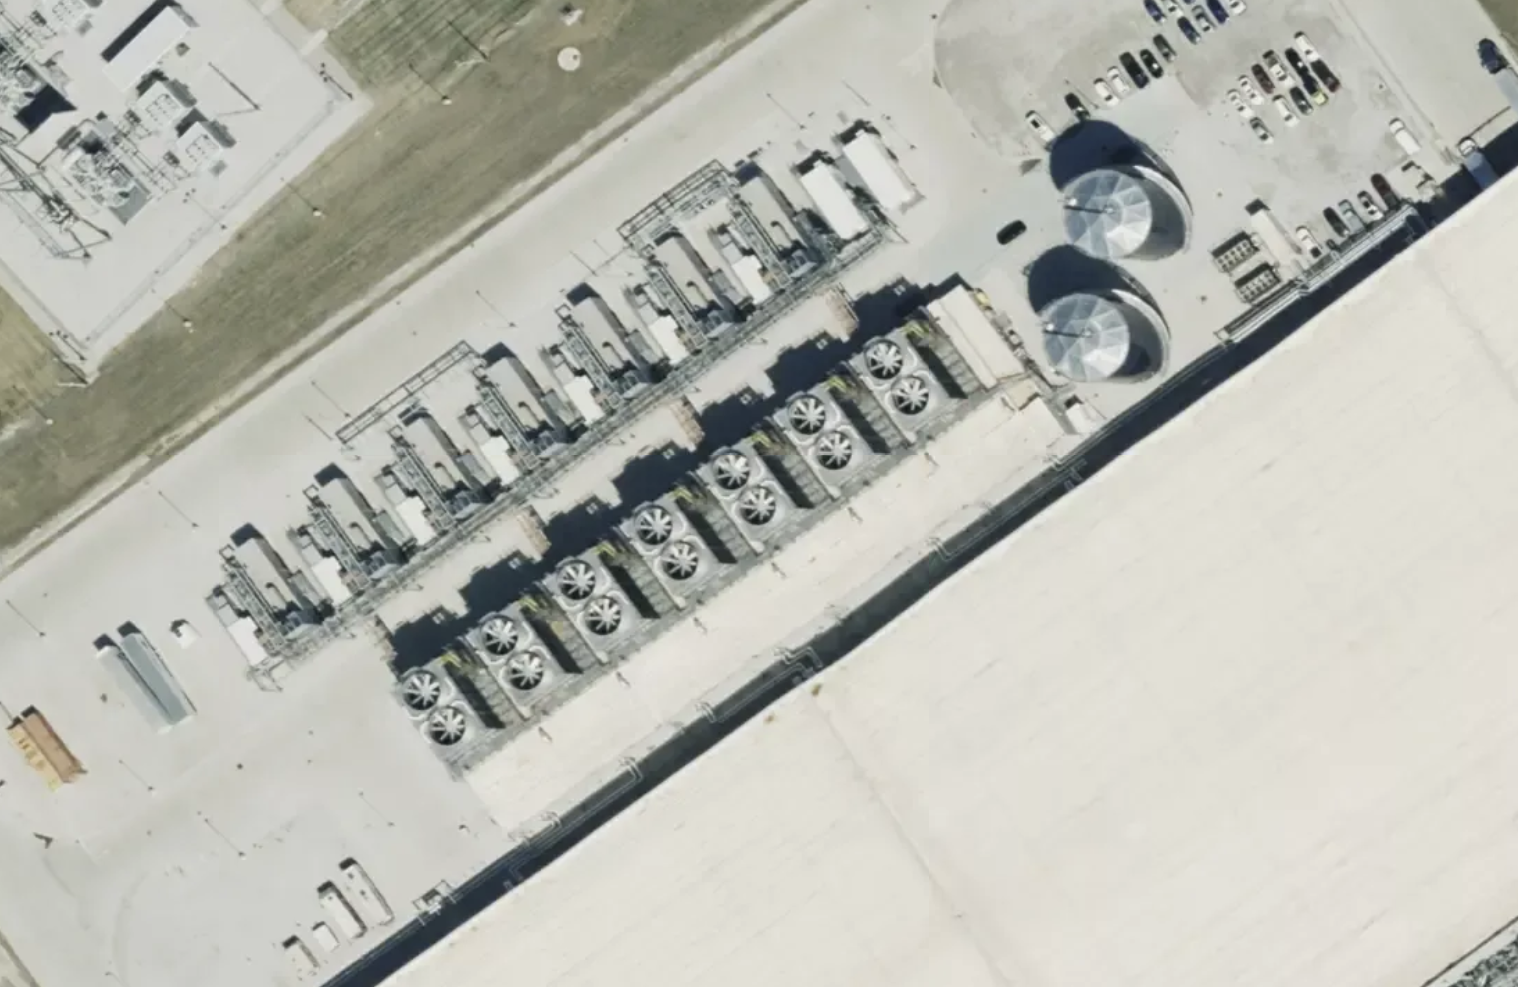
In this close-up of a building from Google’s data center in Omaha, Nebraska, we see 7 cooling towers, each with two 5.5m diameter fans. Based on that, our cooling model outputs a total cooling capacity of 210.5 MW. This almost exactly matches the nominal 144,480 gallons per minute of capacity stated in a permit document, using industry standard conversions (3 gpm : 1 cooling tower ton : 15,000 BTU/hr : 4396 W). Source: Vexcel, delivered by SkyFi
AI chip model
Sometimes we know the type and quantity of chips used in a data center, and use this to estimate the data center’s IT power capacity. We estimate peak data center IT power from the chip quantity using this formula:
IT power = Chip quantity x Server power per chip x IT overhead
where IT overhead is the ratio of IT power to total AI server power. We set this overhead to 1.14 for all chip types, based on expert consultation and the reference design for the NVIDIA GB200 NVL72 server. The chip-based model of IT power is more trustworthy than the cooling-based model, but harder to obtain. So this model helps validate the cooling model and other results.
The type and quantity of chips also lets us estimate the maximum computational performance of an AI data center. This is a key measure of how capable the data center is. We first measure performance as the theoretical peak operations per second in 8-bit integer or floating point format. This is simple to calculate from public hardware data sheets,4 using the following formula:
Performance = Chip quantity x FLOP/s per chip
For FLOP/s per chip, we use the maximum 8-bit floating point specification from data sheets, dividing the specification by 2 to account for sparsity if necessary. This orients the performance metric towards training AI models: to the best of our knowledge, most frontier AI training runs use 8-bit floating-point numbers, without sparsity. For inference, an integer format such as INT4 is more likely.
However, in most cases we lack specific hardware details for a data center and cannot use the above approach. In those cases, we leverage estimates of chip ownership over time to infer chip types, assuming a one-quarter lag between chip sales and deployment.5 For example, for a Google data center that’s operational in Q1 2026 we assume a mix of Google TPUv6e and TPUv7, and for a Microsoft data center that’s operational by Q2 2025 we assume Nvidia B200.

Our chip owners hub helps estimate the type of chips in a data center for a given company at a given time.
After inferring the most likely chip type, we can estimate the chip quantity using this formula:
Chip quantity = IT power / (Chip power x Server overhead x IT overhead)
Since we generally know the chip power (i.e. the thermal design power of one AI chip alone, usually listed in product specifications), we have to divide by a “Server overhead”. This is the ratio of total AI server power to total power for the AI chips alone (servers include other hardware like CPUs, memory and networking). For NVIDIA chips, we calculate this overhead from data sheets. For other servers, we use a combined factor of 1.74× for Server overhead and IT overhead, based on specifications for the NVIDIA GB200 NVL72.
Once we have calculated the computational performance from the chip quantity, we express it in H100-equivalents (H100e): the number of Nvidia H100 GPUs that would be required to match the performance. This is based on the FP8 Tensor Core specification, dividing it by 2 to account for sparsity:
H100e = Performance / (3.958e15 / 2) = Performance / 1.979e15
Capital cost model
The largest AI data centers require billions of dollars in capital. Our data hub makes it easy to compare these costs, with estimates of the total capital cost of every data center. This includes the cost of IT hardware, mechanical and electrical equipment, building shell and white space, construction labor, and land acquisition. To estimate this, we use a cost-per-Watt model that outputs a $38B capital cost per gigawatt of IT power, with $26B going to “compute” (servers and network infrastructure) and $12B to “construction” (facility, land, and utility works). The cost per gigawatt of total facility power is lower, typically $30B, because overheads decrease the number of servers that can be supported.
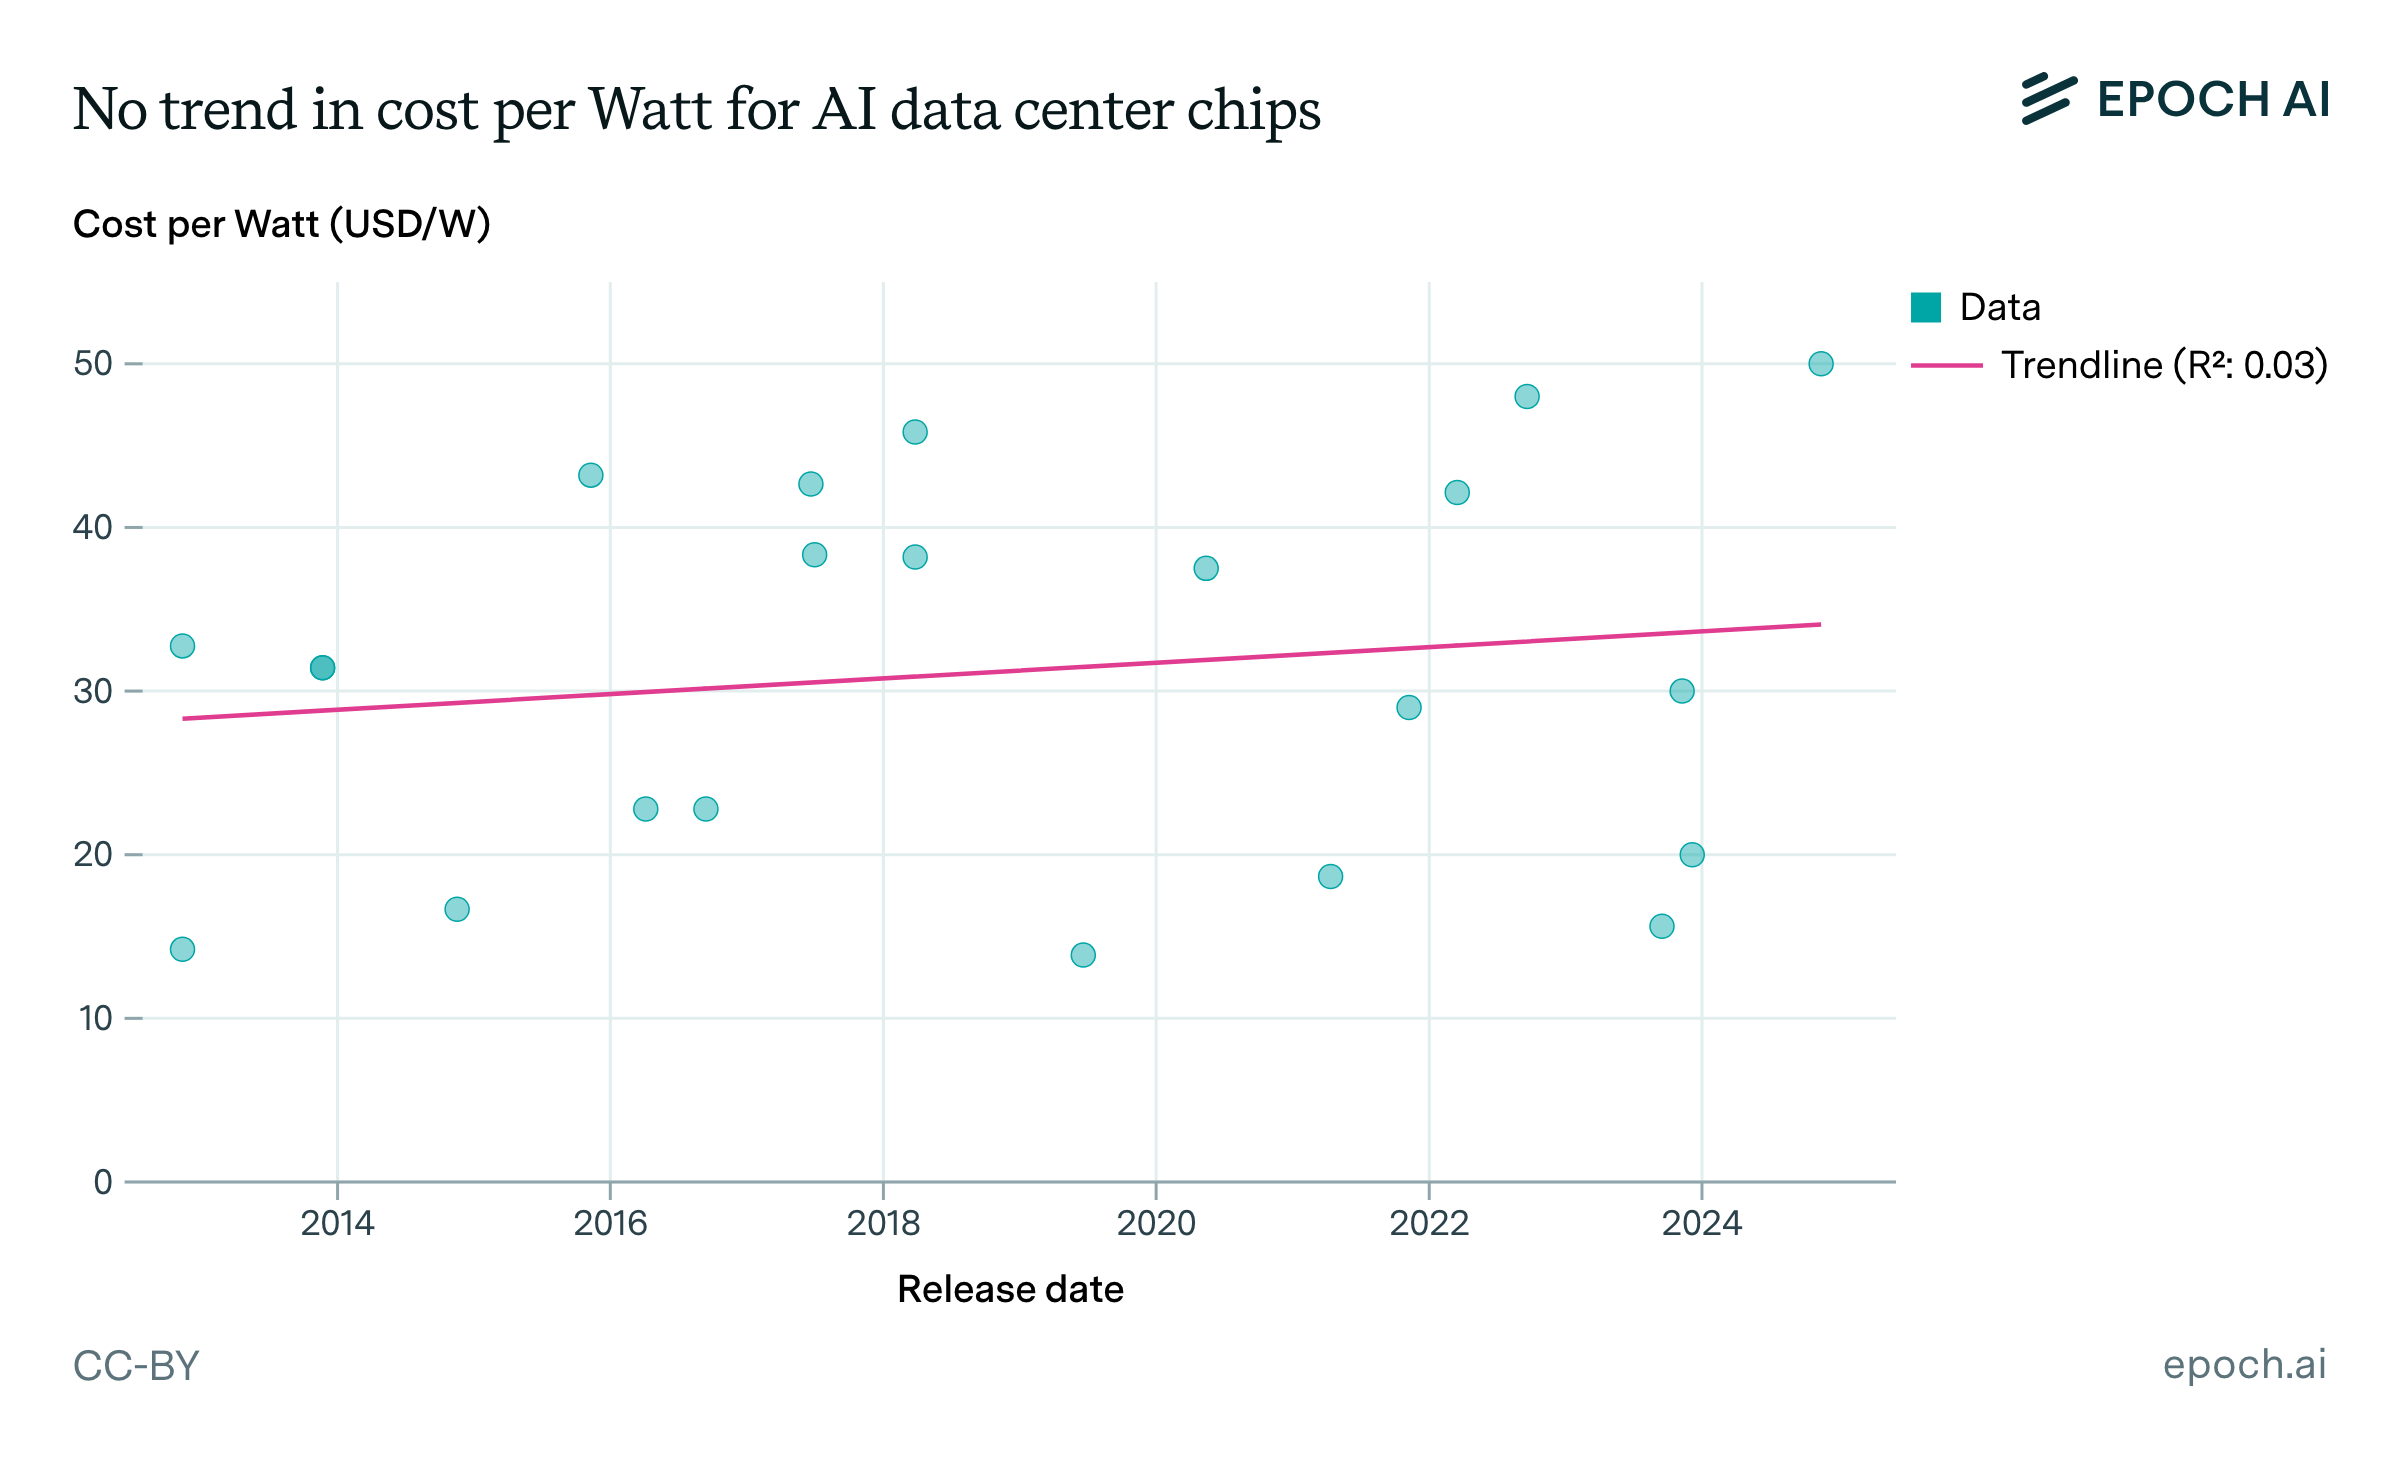
IT hardware makes up about two thirds of the capital cost, and empirically the trend in AI chip cost per Watt over time is almost flat. For that reason, we use the same cost-per-Watt values regardless of a data center’s hardware type or operation date. In reality, data center costs vary significantly with the exact hardware used, the negotiated price of that hardware, the local labor market, tax abatements, and many other factors. Furthermore, our cost estimates reflect the capital required to fund a data center when it becomes operational, but not necessarily the capital spent by the owner at that point—for example, loans may only be paid back many years later.
Verification
For many data centers, we find multiple sources to corroborate our estimates of IT power capacity. Each source has strengths and weaknesses. Air quality permits are a good source for how much backup power is planned, but plans can get outdated. If a new satellite image shows cooling equipment installed on-site, that indicates how much IT power is really being used today, but with wide error bars. The more independent sources we have, the better the final estimates are.
For example, we have six sources on the total power capacity of Stargate Abilene. Some are based on direct reports of power capacity, while others are based on our cooling and AI chip models. These estimates fall in a relatively narrow range of 139 to 190 MW of total facility power per building. After comparing these six values, we settled on 147 MW as the most trustworthy and consistent estimate.
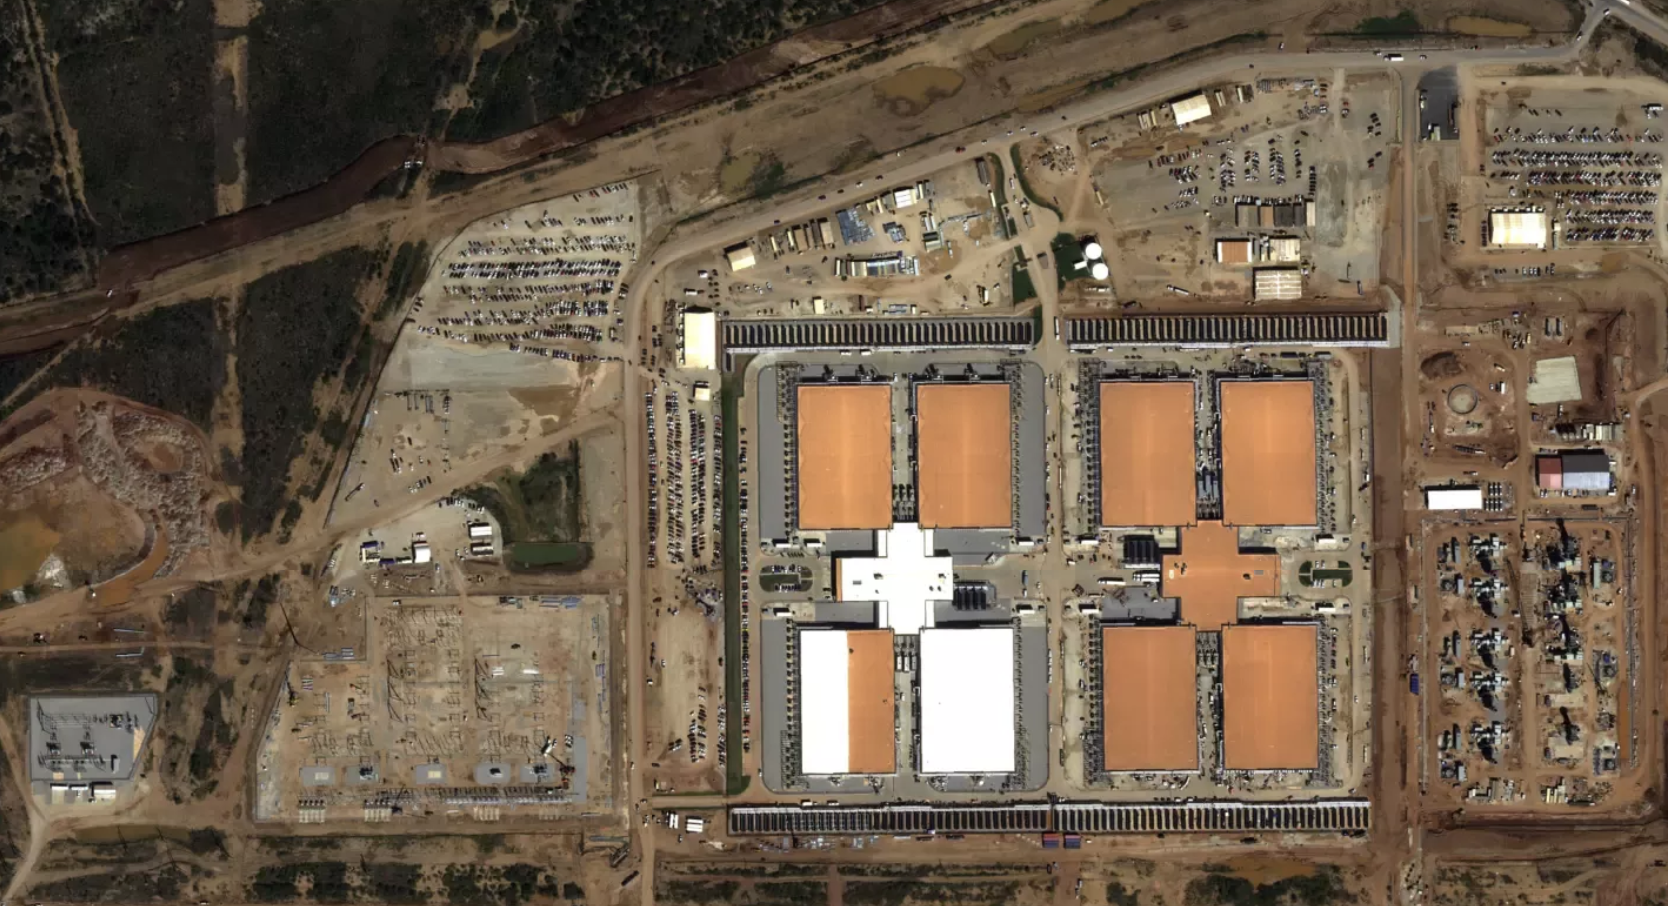
Our intel on the OpenAI Stargate data center in Abilene, Texas provides several estimates of power capacity, from the substations at the bottom left (outlined in orange), to cooling equipment around the buildings (blue), to natural gas turbines at the bottom right (magenta). Image source: © Airbus DS 2026.
Limitations
Our approach to finding and analyzing AI data centers is imperfect. In the discovery phase, some data centers will be so obscure that we won’t find news, rumors, or existing databases mentioning them. While larger data centers are more likely to be reported due to their significance and physical footprint, there are many smaller data centers (<100 MW) that could add up to significant levels of AI compute. As we mentioned above, we’re expanding our use of satellite images and other types of data to help address this limitation.
In the research phase, permitting is one of the most reliable sources about future plans, but plans sometimes change. Schedules can slow down or speed up; the size of the data center may shrink or expand. Worse, there may not be any permitting documents available online for a data center. The publishing of permits varies by local government, and regulations vary across the US and especially across the world. Without regulatory documents, we can’t see as clearly into the future of a data center—especially if no buildings are under construction yet.
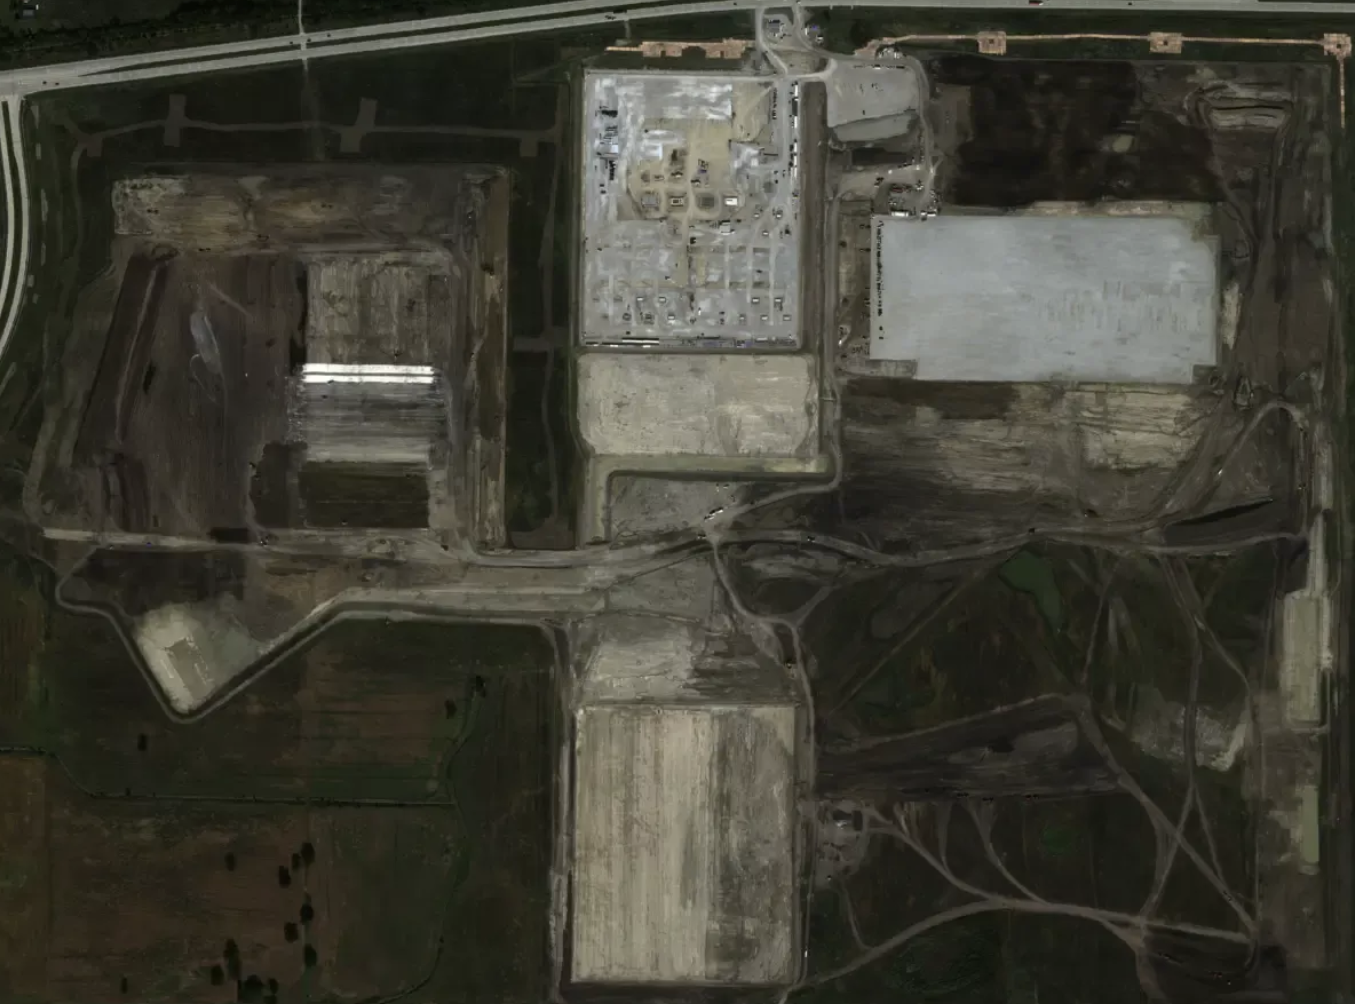
The second phase of the Microsoft Fairwater data center in Wisconsin paused construction in January 2025, which suggests it will take longer than initially planned. Source: © Airbus DS 2025.
If some buildings are under construction or already completed, then satellite imagery helps a great deal, but this has limitations too. Despite the growing power density of AI data centers, some of them are still managing without obvious external cooling infrastructure. For example, the standard AWS data center, which has no obvious cooling fans outside, can still house tens of thousands of Trainium chips. However, we expect this design to become less and less viable as power densities continue to rise.
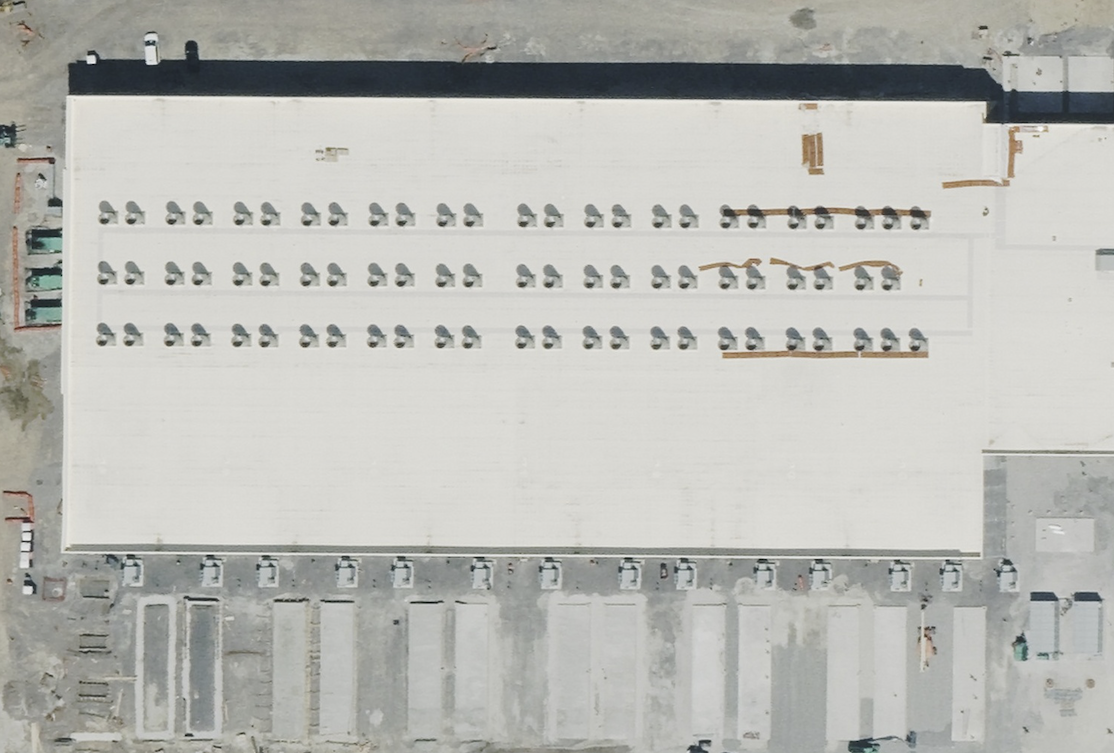
The cooling system for standard AWS buildings is harder to analyze from a top-down view, and is outside the current scope of our cooling model. Source: Vexcel, delivered by SkyFi.
Even if we have a perfect analysis of a data center, we sometimes still don’t know who uses it, and what portion they use. AI companies like OpenAI and Anthropic make deals with hyperscalers such as Oracle and Amazon to rent compute, but the arrangement for any given data center is often secret.
As we’ve researched more data centers we’ve refined our models of construction time, IT power, cooling and compute. For example, we’ve found that it’s important to identify the correct type of cooling infrastructure. When we used our evaporative cooling tower model to analyze the Microsoft Fairwater data center in Wisconsin we got 1.5 GW, which is unrealistic for a building of its size. We later learned that they were air-cooled condensers rather than cooling towers. We learn from errors like this to continuously improve our analysis of AI data centers.
-
There is similar work focusing on urban locations rather than data centers: https://www.sciencedirect.com/science/article/abs/pii/S030626192300925X

-
These values are based on multiple sources and factors. Uptime Institute reports an average PUE of 1.44 for >=30 MW data centers. A public SemiAnalysis post uses a PUE of 1.35 for a “typical colocation data center” hosting H100 or GB200 GPUs (https://newsletter.semianalysis.com/p/h100-vs-gb200-nvl72-training-benchmarks). We expect peak PUE to be slightly higher than average PUE, because more cooling is needed on hot summer days. On the other hand, hyperscalers tend to have lower PUEs—for example, Google averaged 1.09 across their data centers in 2025.
-
See this spreadsheet for the error calculations. The maximum error was higher initially, but we tuned the cooling model based on the reference data and theoretical considerations. Additional analysis suggests that 80% of the time, any given IT power estimate will be within a factor of 1.4x from the actual value.
-
For example, the NVIDIA GB200 NVL72 data sheet. One thing to be careful of here is how hardware data sheets report performance, and the number of chips per server. NVIDIA normally reports OP/s “with sparsity”, which is double the number that applies to most use cases. There is also a confusing relationship between Grace-Blackwell “superchips” like the GB200, which comprise two B200 GPUs, and the GB200 NVL72 server, which is the equivalent of 36 GB200s, but contains 72 B200 GPUs. In our experience, when industry sources report something like “50,000 GB200 NVL72 chips”, they usually mean 50,000 B200 GPUs. We cross-check sources to confirm the most likely meaning in each case.
-
Note that there is some interdependency between the AI data centers and the chip owners datasets. For example, xAI chip ownership is based on our analysis of xAI data centers, and Amazon chip ownership is partly informed by our analysis of AWS data centers. To avoid circular dependencies, we only rely on the independent portions of the chip owners dataset.