 Methodology
Methodology
The AI chip users explorer compiles our analysis of the amount of AI compute capacity allocated to and used by the largest frontier AI developers: OpenAI, Anthropic, Meta Superintelligence Labs, Google DeepMind, and SpaceXAI. This methodology writeup was originally written and published in September 2026, and is produced and maintained for reference purposes. See this repository for the latest versions of our models.
We estimate the amount of computing power that is used1 by each developer for AI research and development and inference. This is not the same as the compute capacity owned by each developer. Some developers primarily use cloud compute capacity rented2 from other companies, while AI developers housed within larger technology companies (Google DeepMind, Meta Superintelligence Labs, and SpaceXAI) are typically allocated compute capacity from their parent companies. These estimates exclude compute owned by the parent company that is rented out to other parties (for example, Anthropic rents some compute capacity from Google, so that compute is not available to Google DeepMind).
This explorer builds on our earlier Gradient Updates newsletter post, “Frontier labs don’t use most AI compute (yet)”, which contains more commentary on the implications of frontier compute trends for the future of the AI industry, and an accompanying research appendix.
There are two major definitional caveats:
First, there is some definitional uncertainty in the case of Google DeepMind and Meta Superintelligence Labs that we do not fully resolve. We attempt to estimate the compute allocated to these two labs for either frontier AI (R&D and inference) or basic AI research, while excluding AI compute for “core business” activities such as ad recommendation systems, but this distinction is not necessarily a clean one. For example, we are not sure how much DeepMind’s compute and research efforts support non-frontier core business activities rather than frontier AI and other basic research. In general, we do not have a definition of what is a “frontier AI” use case for AI compute vs other uses such as video or image generation models.
Second, when estimating compute available to or “used” by OpenAI and Anthropic, it is ambiguous whether one should include the compute used to run third-party products that rely on their models. Both developers’ models are available on APIs hosted by their cloud partners (e.g. Amazon, Google, and Microsoft). It is debatable whether this capacity should be counted when the revenue is shared between the model developer and the cloud provider: the developer still makes revenue from this compute, but earns a smaller share than it does from inference compute for its first-party products. The developer also may lack operational control over this compute, so that they cannot reallocate the compute to research.
OpenAI and Anthropic account for these arrangements differently. Anthropic books all of the revenue for third-party products as its own revenue while paying for the compute capacity as well as an additional revenue share. Meanwhile, OpenAI (before 2026) only booked 20% of the total revenue from these products as its own revenue and did not pay for the compute. We defer to these characterizations accordingly. This decision may affect these developers’ compute estimates by around 10-25%. If third-party compute used by Microsoft to run OpenAI models becomes a large consumer of the world’s AI compute in its own right, we will consider estimating this as a separate category in the future.
To be clear, virtually all of OpenAI’s and Anthropic’s compute capacity is owned by their cloud partners; the question is whether to strictly scope to the compute they directly procure and control.
By default, we measure AI compute capacity in terms of the equivalent number of Nvidia H100 GPUs (H100e for short) by normalizing the on-paper number of 8-bit operations each AI chip can perform and comparing it to the Nvidia H100’s specification, which is 1979 teraFLOP per second in FP8.
Each lab section below pairs the model specification — the sampled inputs, their distributions, and the reasoning behind them — with a step-by-step breakdown of how the estimate is built from the current published model run, showing the median and 90% credible interval for each quantity in model order.
OpenAI
OpenAI relies on cloud compute capacity rented from other companies; as of 2026, these were principally Microsoft, Oracle, and CoreWeave.
In 2025, OpenAI disclosed its total compute capacity over time in terms of electrical power capacity: at the end of 2023, it used 0.2 GW of compute, which grew to 0.6 GW at the end of 2024 and an estimated 1.9 GW at the end of 2025.3 We believe these gigawatt figures are most likely referring to the IT power (that is, peak power draw of IT equipment) of the data centers OpenAI uses.
We are not sure whether these power figures include the compute that Microsoft uses to run its own products running OpenAI models (e.g. API inference via Azure), though we think they probably do not. As a high estimate, the compute used to run Microsoft-hosted inference of OpenAI models may be up to roughly 25% of the size of OpenAI’s first-party compute fleet; more details can be found in this research appendix.
It is also debatable whether to count this Microsoft third-party compute as “OpenAI compute”. OpenAI allocates part of its own compute to inference in order to make revenue and gross profits, and third-party compute that generates revenue for OpenAI also fulfills this purpose. On the other hand, OpenAI likely makes much less gross profit from this hyperscaler inference than it does from its own first-party inference, e.g. historically OpenAI shared in only 20% of the revenue from Microsoft-hosted OpenAI products, likely significantly lower than its own gross margin. After a major renegotiation in April 2026, OpenAI no longer receives any revenue share from Microsoft-hosted OpenAI inference. We may track this as a separate compute usage category in the future, depending on data availability.
Modeling
See this Python notebook, along with the main code repo, for more details and visualizations.
We map OpenAI’s annual power figures to compute capacity using the specifications and sales mix of Nvidia AI chips over time, since OpenAI predominantly uses Nvidia chips.4 OpenAI reportedly mostly rents compute using long-term cloud compute contracts, meaning the chips they use stay in the fleet for multiple years as their compute fleet grows over time.5 This means its compute additions each year presumably mirror Nvidia’s chip sales for that year (adjusted for some deployment lag between when Nvidia recognizes sales and when those chips are made available to OpenAI).6
We map OpenAI’s MW capacity additions to Nvidia chips by weighting Nvidia’s GPU mix per year by each GPU’s IT power capacity when installed in a data center. This is derived from server power-per-GPU of the most common server configurations for each Nvidia chip (e.g. DGX H100 and GB200/GB300 NVL72) multiplied by an uncertain IT overhead factor. The relevant parameters are taken from AI data centers. For example, suppose that in year X OpenAI added 100 MW of compute, and that in the same year (after adjusting for a several-month lag between sales and deployment) Nvidia sold 1 million H100s with 1500 W of IT power each and 1 million A100s with 1000 W of IT power, for a 60/40 split between H100s and A100s in terms of IT power. We would then infer that OpenAI added 60 MW of H100s and 40 MW of A100s that year.
We incorporate uncertainty into the model using the following parameters:
- OpenAI’s reported MW figures might vary due to rounding (up to 50 MW in each direction)
- The correct interpretation of OpenAI’s MW figures is uncertain. We believe these most likely mean IT power (IT power is more commonly quoted in the tech industry, and a non-IT interpretation leads to a surprisingly low H100e figure for the end of 2025 of just over 1 million). But the model incorporates a small chance that OpenAI’s quoted numbers are actually gross, which means their actual IT capacity is deflated by PUE, which ranges from 1.1 to 1.7.
- The exact Nvidia chip composition depends on the deployment lag between when chips are sold and when they become operational, which we assume is between 0.5 and 2 calendar quarters (see the relevant appendix). Nvidia started selling its Blackwell generation around the end of 2024, but a longer deployment lag means a smaller share of OpenAI’s added capacity in 2025 consists of Blackwell chips.
More details can be found in the following table:
| Parameter | Distribution | Reasoning |
|---|---|---|
| Power definition factor | Mixture distribution: 90% drawn from lognormal (0.95, 1.05), 10% draw from 1 / lognormal (1.1, 1.7) | Are OpenAI’s disclosed figures IT power or gross (facility) power? 90% they’re IT (small residual uncertainty around 1.0); 10% it’s gross. If gross, true IT power is lower by a factor of 1.1–1.7 datacenter PUE. |
| Deployment lag | lognormal 0.5 – 2.0 quarters (median ~1) | Lag between when Nvidia recognizes revenue and when chips go live. This affects what share of OpenAI’s 2025 fleet additions are Hopper vs Blackwell. Since GPU generations differ in power efficiency, this affects compute capacity per gigawatt. |
| Rounding jitter | triangular ±50 MW (peaked at 0), independent per year | Disclosures appear to be rounded to 0.1 GW, so reality may be ±50 MW. Triangular rather than uniform because extremes are less likely. |
| Power figure accuracy | Lognormal (0.9, 1.2) (median ~1.04) | Is OpenAI’s internal total-power number itself correct, aside from rounding and the IT-vs-gross question? Mild upward lean. |
| Nvidia IT overhead factor | Lognormal: median 1.14, 5th/95th ~1.00/1.35 | Distribution from the AI data centers calculation sheet. |
| Server power per GPU | A100 812.5 W, H100/H200 1275 W, GB200 1833 W, GB300 1944 W | Server power for the most common server configurations (DGX for A100 and H100/H200, and NVL72 for GB200/GB300), divided by GPUs per server. |
Power model (evaluated at each disclosed year-end)
Another method would be to model OpenAI’s compute using its reported cloud spending. This alternative model, implemented in this notebook, converts OpenAI’s reported cloud compute spend ($6.8B in 2024 and $16.3B in 2025) to H100-equivalents by interpolating these spending figures to run-rates at the end of 2024 and 2025, and converting these to H100e based on contemporary GPU-hour prices.
For end-2025 the two models lead to virtually identical results, with the cloud spend model yielding a median of 1.64M H100e (90% CI 1.14M to 2.41M) against the power model’s 1.74M (1.24M–2.17M). Meanwhile, the cloud spend model produces a higher estimate for the end of 2024: 506k H100e (90% CI 297k to 773k) versus 384k (276k–485k) for the power model. Note that the error bars for the cloud spend model are larger and nearly encompass the CI for the power model, so they are still reasonably consistent. We defer to the power model since it is more confident and robust: OpenAI directly disclosed its power capacity at the end of 2024 and 2025, while the spending model needs to make more assumptions to convert yearly spending totals to point-in-time run rates.
Separately, Nvidia said in its Form 10-K that “one AI research and deployment company contributed to a meaningful amount of our revenue purchasing cloud services from our customers in fiscal year 2026 [ending January 2026].” This very likely means OpenAI, which self-describes as an “AI research and deployment company” and is almost certainly the AI developer that consumes the most Nvidia compute via cloud services. Corporations often use a threshold of 10% of revenue in customer concentration disclosures, but Nvidia’s language here isn’t clear enough on whether this company was responsible for more than 10% of its revenue. We estimate that Nvidia had sold over 13 million H100-equivalent GPUs by the end of 2025.
Anthropic
Like OpenAI, Anthropic uses AI compute capacity from external cloud partners, mainly Amazon and Google as of 2025 (adding SpaceX/xAI and CoreWeave in 2026).
As with OpenAI, there is a definitional ambiguity with “Anthropic compute”, because a significant share of Anthropic model inference is served by third-party APIs from Amazon, Google, and Microsoft. In terms of accounting, Anthropic and its cloud partners treat this differently than the comparable Microsoft/OpenAI arrangement. Anthropic pays for the compute used for these products, and books the entire revenue as Anthropic revenue, with the revenue Anthropic shares with the hyperscalers booked as an expense. Since Anthropic pays for all of this compute and books all of the revenue, we don’t attempt to exclude this third-party compute in our model. This simplifies the modeling, since the reporting on Anthropic’s compute spending likely includes this third-party compute.
As with OpenAI, Anthropic-related third-party hyperscaler compute is probably substantial but only a minority of the total. Anthropic reportedly shares around half of its gross margin on third-party inference with its cloud providers; if the overall gross margin is between 40% and 80%, this implies a 20% to 40% share of the total revenue from these products is shared with clouds. According to the same report, these revenue shares to cloud partners totaled $360 million in 2025, or 8% of Anthropic’s total 2025 revenue of $4.5 billion. This suggests that total revenue from hyperscaler Claude inference in 2025 was roughly $1 billion, or around 20-25% of Anthropic-related inference revenue. This means that inference compute for Claude on third-party APIs have made up roughly 10% of Anthropic’s total compute, since the majority of their compute expenses went to research and training in 2025.7
Modeling
See this Python notebook, along with the main code repo, for more details and visualizations.
For 2025, we principally anchor our estimate of Anthropic’s compute on an estimate of its data center capacity in gigawatts. OpenAI wrote a memo for its investors estimating Anthropic had 1.4 GW of data center capacity as of the end of 2025, about three-quarters of OpenAI’s claimed capacity. Since this is OpenAI’s potentially-biased estimate about another company, this is more uncertain than OpenAI’s disclosure of its own capacity.8 We model greater potential error accordingly.
An added complication is that while OpenAI’s fleet is primarily Nvidia, Anthropic’s fleet is split between Nvidia GPUs, Amazon Trainium, and Google TPUs. This means we can’t simply use Nvidia’s chip mix as we did with OpenAI to map power to computing capacity.
As it turns out, the cumulative Nvidia and TPU fleets likely have similar power efficiencies (more details in this notebook), so for simplicity we only consider the Trainium share of the fleet (assuming all of Anthropic’s Trainium chips are Trainium2). Based on the scale of Project Rainier, the major Amazon Trainium2 campus that Anthropic uses, which we estimate had an IT power capacity of over 600 MW in late 2025, Trainium2 plausibly made up over half of Anthropic’s total fleet at the time.
As a sanity check, Amazon disclosed that they had deployed 1.4 million Trainium2 chips in total by early 2026, which would draw around 1.2 GW in IT power when deployed.9 If half of Anthropic’s 1.4 GW consisted of Trainium2, then around 58% of Trainium2 capacity was allocated to Anthropic at the end of 2025. This is plausible, since Anthropic is by far the largest external customer of Trainium chips.
Trainium2 is similar to Nvidia’s Hopper in power-efficiency, but worse than Nvidia Blackwell, so a higher Trainium share drags down Anthropic’s H100e somewhat compared to if Anthropic only used Nvidia and TPU. As a sensitivity check, increasing the Trainium2 share parameter from 20% to 80% decreases the median H100e estimate by 15% from 1.3 million to 1.11 million, so the overall estimate is not very sensitive to plausible uncertainty in this parameter.
Other evidence on Anthropic’s compute fleet
We also have two other handles on Anthropic’s capacity in 2025. First, Anthropic reportedly spent $6.8 billion on cloud compute in 2025, or around 42% as much as OpenAI did (see our AI Companies explorer for more information). The 2025 ratio is in tension with the power figure from OpenAI’s memo, which put Anthropic at a much higher share of ~75% of OpenAI’s compute in terms of electric power capacity at end-2025. There are a few possible explanations for this discrepancy: Anthropic’s power capacity growth may have been back-loaded, Anthropic’s compute may be cheaper (due to the large share of cheaper custom TPU/Trainium chips in its fleet), differences in power efficiency (e.g. Anthropic’s Trainium2-heavy fleet being less efficient than OpenAI’s Blackwell/Hopper mix), or some significant accounting difference in the methods used to produce the power figure and the reported cloud compute bill.
Second, a large chunk of Anthropic’s compute is concentrated in “Project Rainier”, a multi-data-center initiative by Amazon to supply data centers to Anthropic, powered by Amazon’s custom “Trainium” AI chips.10
As of the end of 2025, we estimate that 470k H100e, consisting of ~700k Trainium2 chips, were deployed in the Project Rainier campus in Indiana. This campus is widely reported to have been built on behalf of Anthropic, so we can presume Anthropic is the sole or predominant user. Amazon also has a large data center in Mississippi with ~200k H100e that at least one industry analyst claims is a Trainium-based data center allocated to Anthropic/Project Rainier, but it is less obvious (though still likely) that Anthropic is the exclusive user of that facility. Put together, this suggests that Anthropic was procuring 500k to 700k H100e in Amazon Trainium by the end of 2025 from these two campuses. This is in addition to the significant numbers of Nvidia and TPU chips that Anthropic rents from Amazon and Google, so these Rainier-based figures are consistent with the overall model result of over 1M H100e for Anthropic at the end of 2025.
2024 compute
For more details, see the estimate notebook.
For 2024, we do not have a disclosure or third-party estimate of Anthropic’s compute capacity in megawatts. Our main handle for estimating 2024 compute is The Information’s reporting on Anthropic’s cloud compute spending for calendar year 2024 and 2025: $2.5 billion and $6.8 billion respectively. This can be used to estimate Anthropic’s compute-spend run rate at the end of 2024: naively interpolating the 2.7x annual growth between 2024 and 2025 as a single exponential growth rate suggests a spending run rate of $4 billion per year, while different growth curve shapes suggest a range of between $2.5 billion and $5 billion per year.
Model specification (2024)
| Parameter | Distribution (90% CI) | Reasoning |
|---|---|---|
| 2024 cloud compute spend | lognormal $2.08B – $3.0B | The Information reported $2.5B; 20% uncertainty in either direction for reporting or definition ambiguity. |
| 2025 cloud compute spend | lognormal $5.67B – $8.16B | The Information reported $6.8B. 20% uncertainty in either direction for reporting or definition ambiguity. Sampled with 0.5 correlation with the 2024 figure. |
| Within-2025 growth shape | lognormal 0.9 – 1.5 (median ~1.16) | Within-2025 growth as a multiple of the average 2024→2025 growth. 1 = smooth exponential from 2024–2025, below 1 means front-loaded spend growth (higher spend in late 2024), above 1 back-loaded. See notebook for more details. This sets the end-2024 run rate: ~$3.5B/yr ($2.6–4.5B/yr). |
| Effective 2024 price per H100e-hour | lognormal $1.50 – $2.50 (median ~$1.95) | H100 1-year rentals fell from ~$3/hr (2023) to the low $2s through 2024. Anthropic likely sits below that (multi-year discounts, cheaper TPU/Trainium chips). “Compute spend” may include auxiliary costs beyond chip-hours, pushing the effective rate up. |
Model specification (2025)
| Parameter | Distribution (90% CI) | Reasoning |
|---|---|---|
| Total IT power | lognormal 1.0 GW – 1.9 GW (median ~1.38 GW) | Leaked OpenAI internal memo put Anthropic at ~1.4 GW online end-2025, vs OpenAI’s own 1.9 GW. The 1.0 GW floor also covers most of the risk that 1.4 GW was facility rather than IT power. |
| Trainium2 share of IT power | ~normal 0.35 – 0.70 (median ~0.52), clipped to [0.1, 0.9] | Judging from Project Rainier capacity; see writeup above for more details. Sampled independently of power. |
| Nvidia chip specs and mix | fixed: H100/H200 1,453 W IT, 1.00 H100e; GB200 2,090 W, 2.53 H100e; Hopper:Blackwell ~1.48 : 1 | Borrowed from the OpenAI model: server power per GPU × the median 1.14 IT-overhead factor, and OpenAI’s end-2025 Hopper:Blackwell mix (A100 dropped, GB300 folded into Blackwell). Blended: ~945 H100e/MW. |
| TPU fleet efficiency | fixed: ~1,009 H100e per MW (1.07× the Nvidia mix) | Google’s actual v5+ fleet (Epoch chip-sales data), weighted by count × IT power (TDP × 1.742 server overhead, implied by the GB200 NVL72). Scored on native 8-bit peak vs the H100’s 1,979 TFLOP/s. |
| Non-Trainium efficiency bucket | 977 H100e per MW × sampled multiplier, lognormal 0.8 – 1.25 (geomean 1.0) | Nvidia and TPU efficiency are very close, so all non-Trainium compute is one bucket at their midpoint. The resulting efficiency is uncertain: in the OpenAI model, lag uncertainty creates 0.83x to 1.16x uncertainty. This is widened here due to TPUs being in the mix. |
| Trainium2 specs | ~871 W IT per chip (754 H100e per MW, ~0.77× non-Trainium) × sampled multiplier, lognormal 0.85 – 1.2 (geomean ~1.01) | H100e per chip is the dense 8-bit throughput ratio (1,299/1,979 TFLOP/s). 871 IT Watts per chip estimated from Frontier AI Data Centers; uncertainty range since server power is estimated and Amazon has not published official specs. |
Google DeepMind
Google (here shorthand for all of Alphabet) is a major hyperscaler and probably owns more AI compute than any other firm in the world. Google has an AI lab division called Google DeepMind (henceforth “DeepMind”) that houses its frontier AI efforts along with many other AI research projects.
Here, we estimate how much compute is allocated to DeepMind, including inference of DeepMind-produced models, which may or may not line up with Google’s internal compute accounting. The definition here may be fuzzy, since it’s not clear how distinct DeepMind’s work is from e.g. ad recommender systems. Our general uncertainty about Google’s compute allocations is high enough to subsume this definitional uncertainty.
We estimate DeepMind’s compute as follows:
- We estimate Google’s overall compute, starting from estimates of Google TPU capacity and Google’s share of Nvidia GPU purchases (from AI chip owners), and applying a discount for deployment lags between sold and operational compute.
- We estimate what share of Google’s compute was DeepMind-related, versus compute allocated to external cloud sales or other internal uses. For 2025, we use Google’s disclosure that half of their ML compute was allocated to Google Cloud to help triangulate this share.
More details can be found in this Python notebook.
What share of Google compute goes to DeepMind?
Overall, we believe that DeepMind may have used around half of Google’s total AI compute capacity in 2025 for training and inference. This result has a large amount of uncertainty and involves significant guesswork, and DeepMind’s share could plausibly be between one-third and two-thirds. However, we have enough information to infer that DeepMind’s share of Google’s total is large but not overwhelming, so we do not proceed in total ignorance.
Google’s AI compute is split between Google Cloud and internal usage. According to Alphabet’s CFO, Alphabet’s “ML compute” was split around 50-50 between Google Cloud and other uses in 2025, and this split will be similar in 2026.11 However, Google Cloud includes some DeepMind-related compute: in addition to sales of GPU and TPU capacity, Cloud also includes most enterprise-level Gemini inference such as the Gemini API and Gemini Enterprise subscriptions.12
DeepMind’s compute is then equal to:
Google total AI compute × (Cloud share × DeepMind’s share of Cloud compute + (1 − Cloud share) × DeepMind’s share of non-Cloud compute)
In other words, since Google’s compute is split roughly 50-50 between Cloud and non-Cloud, whether DeepMind is allocated more than 50% of the overall total depends on whether its share of Cloud compute is greater than the non-DeepMind share of Google’s internal compute.
Reviewing these in turn:
DeepMind’s share of Cloud compute. As mentioned, Google Cloud includes most enterprise-level Gemini inference. The remainder of this compute goes to external cloud rentals and running APIs for non-DeepMind models. Since Google Cloud was around half of Google compute, it may have used around 2 million H100-equivalents at the end of 2025 (half of Google’s estimated owned AI compute, shifted back one quarter).
Our estimates of OpenAI and Anthropic above suggest that enterprise Gemini inference is unlikely to have been more than 1 million H100e at the end of 2025. One third-party estimate from Menlo Ventures indicates that Anthropic is the market leader in enterprise AI, followed by OpenAI and then Google (and we agree with this ordering, though we don’t take their estimated shares at face value). And Anthropic’s total inference capacity was likely under 1 million H100e at the time.
DeepMind’s share of internal compute (inference and R&D).
Several lines of evidence suggest that DeepMind may have a large share (e.g. over 50%) of Google’s non-Cloud AI compute:
First, Alphabet’s disclosure that they spent $16 billion on “Alphabet-level activities” in 2025, which primarily went to R&D for DeepMind, weakly suggests that Google spent a similar amount on AI R&D as OpenAI did in 2025. OpenAI probably allocated close to 1 million H100e to R&D at the end of 2025; this would be around one-quarter of Google’s total AI compute, and one-half of its non-Cloud compute. See the next section for more details on this estimate. Including DeepMind-related inference for consumer products would increase this total further.
Second, SemiAnalysis estimated that roughly 40% of all of Google’s compute capacity was allocated to DeepMind training (presumably meaning all training and research).13
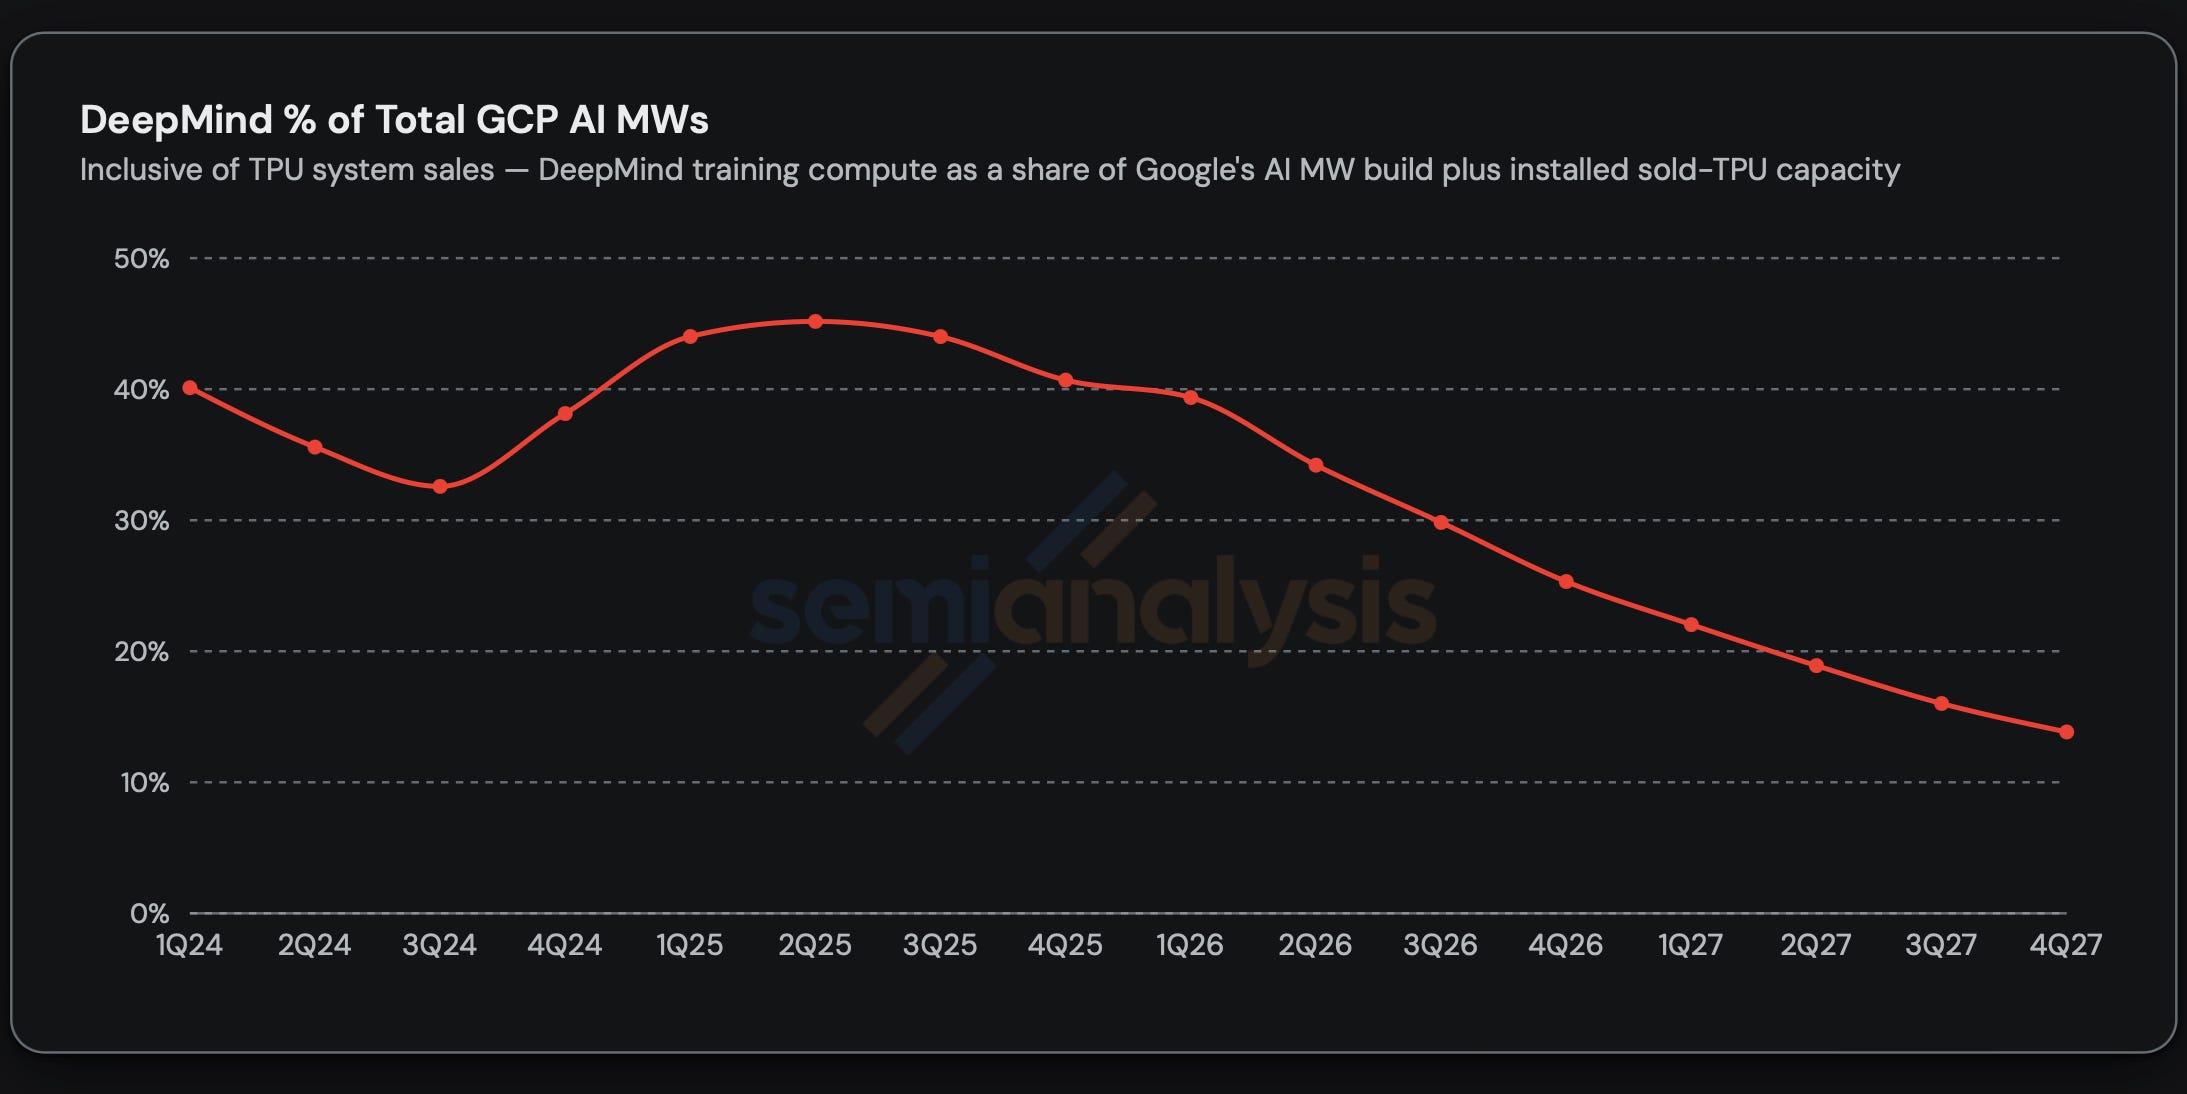
On a more heuristic, outside-view perspective, DeepMind is Google’s flagship AI unit, and competing in frontier AI has historically been a high priority. For example, in 2023 Google leadership viewed the strength of competitors’ LLM products such as ChatGPT as an existential threat to its search business. Google owns enough compute to allocate an OpenAI-sized amount or greater to DeepMind; Anthropic and OpenAI have rapidly grown their revenue run rates and valuations, giving Google a large financial incentive to compete for this market, provided that they believe that a large compute allocation would actually enable DeepMind to stay competitive. As of 2025, this seemed like a reasonable judgment, though some industry observers argue that Google’s confidence in DeepMind has eroded in 2026.
The counterargument for a high DeepMind share is the simple fact that Google has many alternative uses for compute. As we discuss in the Meta section, advertisement and content recommendation systems likely absorb a large share of Meta’s AI compute, and Google’s ad business is similar in revenue to Meta’s. Google and Alphabet contain a myriad of other products and services (translation, search, mapping, autonomous driving, etc) demanding AI and machine learning workloads.
2024 allocation
Unlike 2025, Google did not state how their AI compute was divided between Cloud and internal use in 2024. So we do not decompose DeepMind’s share into Cloud vs non-Cloud, and instead use one variable for DeepMind’s overall share. Our 2025 model implies a ~32% to 67% DeepMind share of Google’s overall compute, and we extrapolate this backwards to 2024 with a wider interval of 25% to 75% (lognormal, with a median of ~43%). Obviously, this is a fairly unprincipled guess.
Alphabet-level activities
Alphabet reports an operating expense line item called “Alphabet-level activities” (henceforth “ALA”) that it describes as “primarily reflect[ing] expenses related to our shared AI research and development.”14 Google spent $16.76 billion on ALA in 2025, and $5.4B in Q1 2026 ($22B annualized), suggesting an annualized spend rate at the end of 2025 of $17-22B/year. Not all of this is AI-related: Google says it includes philanthropic, HR, and legal costs, but the language suggests most of it is for AI R&D, implying a run rate of perhaps $15-20B/year in AI R&D at the end of 2025. ALA was $10.5 billion in 2024 and $9.186 billion in 2023, with AI presumably growing its share of ALA over time.
ALA spending provides a mild amount of evidence on DeepMind’s compute allocation. DeepMind-related R&D compute presumably falls into the ALA bucket, though some may be excluded if sufficiently tied to product development.
Mapping ALA spending amount to compute isn’t straightforward — much of this spending goes to non-compute expenses such as staff costs and data. This code notebook sketches out a rough model, which isn’t directly used in the overall DeepMind compute model.
DeepMind’s cost per H100e is probably much cheaper than what companies like OpenAI pay for Nvidia chips on the cloud, because they primarily use custom TPUs, and they don’t pay a profit margin to an external cloud company. For example, SemiAnalysis estimates that TPUv7s have a 44% lower TCO per chip-hour than GB200s (against similar FLOP/s specs), not including the discount from bypassing the cloud layer. This suggests a more than 50% discount on cloud Nvidia, for a price of under $1 per H100e-hour (under $8.7k per year). If, e.g. half of ALA was spent on compute, this would imply over 1 million H100e allocated to DeepMind R&D alone (excluding inference compute), which is perhaps too high.
More broadly, ~$15-20B/year in AI R&D is a lot of money. By comparison, OpenAI had $19 billion in R&D expenses in 2025 (with ~$8B allocated to R&D compute, comprising half of its total compute spending), so ALA was apparently equal to ~90% of OpenAI R&D spending in 2025, with DeepMind R&D making up the majority of ALA.
Half of OpenAI’s compute spending, or ~900k H100e, was allocated to R&D in 2025. DeepMind’s lower compute costs mean it is quite plausible that DeepMind had more R&D compute capacity than OpenAI in 2025, though those lower costs could also mean a lower share of R&D dollars were allocated to compute.
Overall, ALA weakly suggests that DeepMind used on the order of 1M H100e for R&D at the end of 2025. Adding in consumer-side inference could easily put DeepMind’s allocation of non-cloud AI compute at over 1M H100e, or over half of Google’s non-cloud AI compute total.
Model specification (2025)
| Parameter | Distribution (90% CI) | Reasoning |
|---|---|---|
| Nvidia compute owned by Alphabet | lognormal 955k – 1.59M H100e (median ~1.24M) | Sampled from confidence interval in the AI Chip Owners dashboard. Drawn independently of TPUs to produce a distribution over total Alphabet compute. This is a simplification; one could argue the uncertainty is correlated (shared error about Google totals) or anti-correlated (GPU vs TPU purchases trade off). |
| TPU compute owned by Alphabet | lognormal 3.08M – 4.54M H100e (median ~3.74M) | Same source and caveats as above. |
| Deployment lag ratio | lognormal 0.55 – 0.87 (median ~0.69) | Ratio between operational and owned compute implied by a 0.5–2 quarter install lag. |
| Cloud share of Google ML compute | lognormal 0.45 – 0.55 (median ~0.50) | Google’s CFO: “around half” of ML compute serves cloud in 2025, “just over half” guided for 2026. Tight band around the statement. |
| DeepMind share of Google Cloud compute | lognormal 0.2 – 0.6 (median ~0.35) (sampled with 50% correlation with DM share of internal compute) | The cloud half (~1.6–2M H100e) contains external GPU/TPU rentals (e.g. to Anthropic) plus enterprise Gemini inference. Enterprise Gemini likely runs below OpenAI/Anthropic inference, i.e. under ~1M H100e at the end of 2025, so the share is probably under 0.5. |
| DeepMind share of internal Google AI compute | lognormal 0.4 – 0.8 (median ~0.57) (sampled with 50% correlation with DM share of Cloud compute) | This includes both non-enterprise Gemini inference (consumer chatbot, AI Overviews in Google Search) and DeepMind R&D. This is perhaps the most uncertain parameter, along with DeepMind share of cloud, requiring significant guesswork. See summary above for more details. |
End-2024 backcast
Meta Superintelligence Labs
Meta is one of the world’s largest hyperscalers, holding roughly 10% of the world’s total AI compute at the end of 2025 (not including its custom MTIA chips, which were relatively low volume in 2025).
Meta hosts a major AI division called Meta Superintelligence Labs (MSL) that works on frontier AI research and development, alongside basic AI research.15 Before 2025, MSL was called “Meta AI”, and before that “FAIR”. Here, we focus on estimating how much compute MSL has access to.
However, much of Meta’s compute is not used by MSL or for frontier AI. Meta also uses AI compute to train and deploy recommender systems to enhance its core social media business by recommending content and advertisements. Meta’s recommendation systems are powered by large transformer-based models trained on “thousands” of GPUs. The share of Meta’s compute that is allocated to MSL versus other uses like recommenders is the core source of uncertainty in our model for both 2024 and 2025.
We model MSL’s AI compute usage over time as follows:
- Estimate Meta’s deployed AI compute over time, starting from its compute purchases from AI chip owners and applying a discount for deployment lags between sold and operational compute.
- For 2025, additionally estimate how much external cloud capacity Meta rented, which may have been minor or negligible.
- Estimate how Meta’s compute was allocated between MSL and core business in both 2024 and 2025.
Evidence on the MSL/core business split
Meta strongly emphasizes the importance of recommender systems (RecSys) to its business, attributing the strong usage and revenue growth it saw in 2025 to trillions of daily AI-powered recommendations, suggesting that these systems are a highly lucrative multiplier on Meta’s over-$200B/year ads business. This would easily justify a large compute allocation, though this also depends on the returns to scale for training and inference of RecSys; the industry research firm SemiAnalysis believes that the marginal returns of scaling recommenders are attractive, and Meta has written about the gains of large-scale training of transformer recommenders.
Meta said in Q1 of 2025 (before Meta engaged in a hiring push for MSL) that the majority of its 2025 capital expenditures would go towards “core business”, including compute for recommenders, rather than generative AI. In other words, Meta’s capex breaks down into generative AI + AI for core business (e.g. recommenders) + non-AI capex, and Meta forecast that the latter two together would be over 50% of overall capex. This doesn’t give clear bounds on the share of Meta’s AI compute going to generative AI, absent a more precise breakdown of their AI share of capex.16 But it does mean that frontier AI has not squeezed out all of Meta’s data center investments for recommenders and other uses.
At the same time, LLMs and frontier AI have clearly been a major priority at Meta since at least 2023. In 2024, Meta released a frontier-scale model, Llama 3 405B, which was trained on 16,000 H100 GPUs, one of the largest known training runs at the time with around twice the training FLOP of GPT-4. Meta also announced two 24,000-H100 training clusters and, in late 2024, built a cluster of 100,000 H100 GPUs that it said would be used to train frontier models.17 This cluster alone was a substantial share, roughly 15%, of Meta’s overall AI compute at the time.18
In 2025, Meta pivoted hard towards frontier AI, engaging in a massive hiring spree to hire and poach top AI talent, including spending $15 billion to acqui-hire the CEO of the data startup Scale AI. Meta CEO Mark Zuckerberg also announced that he planned to equip Meta Superintelligence Labs with “industry-leading levels of compute and by far the greatest compute per researcher.”19
Overall, some industry analysts/commentators estimated in mid-2025 (in off-hand remarks on a podcast) that 50-60% of Meta’s GPUs went to recommender systems. Meanwhile, SemiAnalysis’ official models attribute roughly half of Meta’s compute additions in 2025 to MSL.20
For 2025, we model MSL’s share of Meta compute as a lognormal variable with a 90% uncertainty interval of 33% to 80%, with a median of just over 50%. This is unfortunately pretty rough and “vibe-sy”, reflecting the fact that Meta clearly prioritizes both MSL and recommenders, but doesn’t disclose hard numbers on its compute allocations.
For 2024, there is less available commentary from Meta executives or third-party analysts, so uncertainty should arguably be greater. But Meta’s aforementioned disclosure of a 100k H100 cluster they were using for Llama 4 by the end of 2024 is useful because it anchors their frontier AI efforts at over 100k H100e, compared to ~500k to 800k in total. (It’s not clear whether the two previously-disclosed 24k H100 clusters were expanded or merged into this 100k cluster.) So a greater-than-20% share is very likely, but Meta’s pivot towards MSL in late 2025 suggests that Meta AI may have had a lower share of AI compute relative to ads in 2024 than in 2025. So we choose a lognormal 90% uncertainty interval of 25% to 80%, which decreases the median somewhat from 51% to 45%.
2025 cloud compute purchases
In addition to the compute Meta owns, Meta has signed several large deals to purchase cloud compute from Google, Oracle, CoreWeave, and Nebius starting in late 2025. These deals were probably not active, at least at large scale, by the end of 2025, but it’s possible that Meta was buying cloud compute at an annualized rate of single-digit billions by that time. (On the flip side, Meta may begin selling some of its compute capacity on the cloud starting in 2026.)
The publicly reported deals in 2025 were with CoreWeave ($14.2 billion through end of 2031 for a $2.3B/year run rate), Google ($10 billion over six years, for a $1.6B/year run rate), Oracle (reportedly a $20 billion deal with unspecified duration, not officially confirmed), and Nebius ($3 billion over five years, or $0.6 billion/year). These add up to around $7-8B/year if the Oracle deal is also over six years, though these public reports may not be exhaustive.21
CoreWeave’s CEO said that the $14.2 billion deal would come online “in 2026”, and its 10-Q form in Q1 2026 suggested that the capacity was still ramping up during the first quarter: its top two customers made up 45% and 20% of its $2 billion in revenue that quarter, while no other customer made up more than 10%. Since these top two are almost certainly Microsoft and OpenAI respectively,22 this implies that Meta was spending at an annualized rate of at most $800 million (10% of an annualized $8 billion run rate) in early 2026, or at most around one-third of the full run rate of the cloud deal.
Extrapolating from the CoreWeave example, we model a fair chance (25%) that none of Meta’s purchased cloud compute capacity was active at the end of 2025; if some capacity was online, Meta’s spend rate was probably less than $3.5 billion, or half of the eventual run rate of these reported deals. The spend rate distribution is converted to H100e using typical cloud contract prices from 2025 (see below). For simplicity, this compute bucket is entirely attributed to MSL.
For more details on the model, see this Python notebook.
Model specification (2025)
| Parameter | Distribution (90% CI) | Reasoning |
|---|---|---|
| Nvidia owned | lognormal 1.43M – 2.38M H100e (median ~1.84M) | AI chip owners dashboard, end-2025 sold basis. Independent of AMD draw, as a simplifying assumption. |
| AMD Instinct owned | lognormal 345k – 612k H100e (median ~460k) | Same source; AMD ≈ 20% of Meta’s total. |
| Deployment lag ratio | lognormal 0.62 – 0.90 (median ~0.75) | Derived from a 0.5 to 2 quarter deployment lag applied to the trajectory from AI Chip Owners. |
| MSL share of operational compute | lognormal 0.33 – 0.80, clipped to [0.1, 0.9] (median ~0.51) | See summary above. |
| Meta AI cloud compute spend rate, end of 2025 | 25% chance of $0; otherwise lognormal $0.5B – $3.5B/year, clipped at $5B/year | See summary above. |
| Meta AI cloud compute price per H100e-hour | lognormal, ~$1.20 to $1.50 per H100e-hour | Derived from SemiAnalysis’ August 2025 GPU-hour surveys, which indicates $1.30 per H100-hour, $1.60 per H200-hour, $3.30 per GB200-hour, and $3.96 per GB300-hour, for a range of $1.30 to $1.60 per H100e-hour. Meta’s price paid may be slightly below these numbers due to longer contract terms. (As of writing, this can be found on InferenceX by selecting “3 year rental” as the y-axis metric, though this may overestimate the price for Meta’s six-year contracts.) |
End-2024 backcast
SpaceXAI
SpaceXAI, previously known as xAI before its acquisition by SpaceX, is a large frontier AI developer.
SpaceXAI uses AI compute from two sources:
- Most of its compute is owned by SpaceX, primarily in the Colossus 1 and Colossus 2 campuses near Memphis, Tennessee.
- xAI has historically used (and probably still uses) some cloud compute capacity, with Oracle as a confirmed partner as of 2024.
Beginning in 2026, SpaceX started renting out part of Colossus to other companies such as Anthropic, Google, and Reflection. SpaceX also acquired Cursor in 2026, with the Cursor and SpaceXAI teams co-developing models. Going forward, we will likely group these two teams’ compute together, while subtracting out the SpaceX-owned compute rented out to other parties.
Colossus capacity
We take estimates of Colossus 1 and Colossus 2 operational compute capacity over time from the AI Data Centers explorer. We assume that 100% of this was used by SpaceXAI/xAI before SpaceX’s compute partnership with Anthropic began in May 2026. Colossus 1 and 2 almost certainly make up the vast majority of SpaceXAI’s owned AI compute capacity. For example, SpaceX’s Q2 earnings deck discloses a nameplate compute capacity of 1.0 GW as of March 31, 2026, while its S-1 filed in May (pg. 76) states that Colossus 1 and 2 “collectively provide approximately 1.0 gigawatt of compute power”.
While some of our compute estimates from AI data centers are uncertain, our Colossus estimates are relatively confident because many of them are grounded in specific statements from SpaceX, now a publicly traded company. However, there is still some uncertainty about when phases of Colossus 1 and 2 came online:
- In 2024, only Colossus 1 was operational. Colossus 1’s first phase of 100,000 Hopper GPUs was completed and operational in September, and we estimate that the second phase of another 100,000 Hoppers was online by February 2025. For the end of 2024, we interpolate some share of this second phase as operational. We model this share as likely between 40% and 95% (since a simple linear interpolation between these dates would imply the second phase was ~70% complete).
- By 2025, Colossus 1 was complete, with 200,000 Hopper GPUs and 30,000 Blackwell GPUs, for ~276,000 H100e online. These chip counts are well-grounded by company statements. Meanwhile, we estimate that Colossus 2’s first phase of 110k Nvidia GB200s was online by October 2025, and that the second phase of another 110k Blackwell GPUs came online by April 2026. Our satellite-based model estimates that Colossus 2’s capacity was still at the initial 110k GPUs as of January 2026.23 Accordingly, here we model that Colossus 2 likely still consisted of its first phase at the end of 2025, with some chance that the second phase was partially completed.
External cloud capacity
xAI partnered with Oracle in 2024 to train Grok 2 on 20,000 H100s. There’s a good chance that xAI still used this cluster through 2026 — xAI was only founded in 2023, and multi-year contracts are common for large AI cloud deals.
SpaceX’s S-1 also contains some information that can be used to place rough bounds on its AI cloud compute spending. On page 112, they disclose that:
- GPU depreciation increased by $1.673 billion in 2025 vs 2024.
- “Infrastructure and cloud computing R&D expense” increased by $1.44 billion.
- “Infrastructure and cloud computing cost of revenue” increased by $412 million.
The latter two buckets add up to ~$1.8 billion in “infrastructure” and “cloud computing” spending. However, this $1.8B combines cloud compute spending with “infrastructure”, which presumably means operating costs and depreciation on non-GPU AI infrastructure like networking and facilities (since GPU depreciation is a separate category). In addition, this is only the increase in 2025; the 2024 baseline is not confirmed.
2024 baseline
SpaceX doesn’t disclose its “infrastructure and cloud computing” spend in 2024, but it did confirm (page 117) that its AI R&D spend in 2024 was $1.176 billion. Note that SpaceX’s “AI” segment actually includes both the xAI lab and X (the social media network formerly known as Twitter). Its AI cost of revenue was ~$1.7 billion in 2024, but this can be presumed to mostly be serving costs for X traffic, since xAI’s inference compute expenses were likely smaller than its R&D compute expenses in 2024.
This $1.176B in turn is an upper bound on xAI’s R&D cloud compute spend, since it would also include R&D spending for X, non-compute AI R&D expenses like staff compensation and data, and non-cloud compute R&D spend from Colossus 1 depreciation. Colossus was $6 billion in capex in 2024, so on a six-year depreciation cycle ($1 billion per year) with the depreciation clock starting in early September, xAI may have booked roughly $300 million in Colossus 1 R&D expenses in 2024.
Given these exclusions, even though the $1.176 billion in AI R&D spending in 2024 doesn’t include inference cloud compute, it is still probably higher than xAI’s total cloud compute bill that year. This is consistent with the size of the Grok 2 cluster: 20k H100s rented for $2/hour would cost $350 million per year, so xAI’s cloud spend run rate was probably in the $300M to $1B range at the end of 2024.
2025
SpaceXAI increased its “infrastructure and cloud-computing” expenses in 2025 by ~$1.8 billion. A large part of this $1.8 billion was likely the “infrastructure” side (i.e. depreciation on non-GPU equipment), since they reported an increase in GPU depreciation of $1.673 billion, and non-GPU equipment is a large minority of the capital costs of building an AI data center (the S-1 does confirm on page 91 that AI-related cloud computing spend was “higher” in 2025, without any numbers). Given the rough 2024 baseline of $300 million to $1 billion, this suggests a plausible spend rate of $1 billion to $2 billion/year for 2025, with a fairly strict upper bound of ~$3 billion. At $2/hour, these roughly correspond to 57k and 114k H100e, respectively.
Since we’ve established that cloud compute is likely only a small minority of xAI’s overall compute, it is not necessary to decompose cloud spending into a rigorous estimate of annual spending and price per H100-hour. For simplicity, we model a single H100e distribution of 20k to 60k H100e in 2024, and 30k to 120k in 2025, for xAI’s non-Colossus cloud compute capacity.
End-2025 model
End-2024 model
Appendix: Frontier developer compute in 2026
While we do not have a formal forecast for Anthropic’s and OpenAI’s compute as of the end of 2026, several lines of evidence point to continued rapid growth in their compute fleets.
OpenAI’s president, Greg Brockman, testified that the company would spend $50 billion on compute in 2026, roughly triple what it spent in 2025. This is somewhat faster than OpenAI’s growth in compute spending between 2024 and 2025, and if the incremental compute spending is more cost-effective due to improved chip efficiency over time, this suggests that OpenAI’s compute capacity will more than triple in 2026.
Anthropic is also aggressively ramping up its compute in 2026. Notably, in May 2026, Anthropic reached an agreement with SpaceX to rent the entire Colossus 1 data center (consisting of over 220k Nvidia GPUs, or ~280k H100e), and part of Colossus 2, paying $1.25 billion per month ($15 billion per year annualized) for this capacity. Additionally, we estimate that the Project Rainier campus in Indiana increased its compute capacity by around 200k H100e in the first half of 2026. Overall, Anthropic reportedly planned to spend around $6 billion on compute in Q2 2026 alone, or close to what it spent in all of 2025, indicating a very aggressive ramp in compute spending.
SpaceX is also rapidly scaling up its compute fleet. SpaceX’s total compute fleet in Colossus 1 and 2 now stands at around 1.4 million H100-equivalents. As mentioned above, Colossus 1, and possibly some portion of Colossus 2, is now being used by Anthropic, which implies around 1.1 million H100e in capacity available to SpaceXAI, SpaceX’s internal AI lab, as of mid-2026, not including external cloud capacity.
SpaceX has also signed deals with Google to rent out 110,000 GPUs (presumably Blackwell GPUs, for around 280,000 H100e) for $920 million/month beginning in October 2026, as well as a smaller $150 million/month deal with the AI model startup Reflection AI. This will further subtract from the capacity available internally to SpaceXAI, but we also forecast that Colossus 2 will grow to around 1.8 million H100e by early 2027.
Appendix: deployment lags between chip sales and data center deployments
Deployment lags between when chips are sold (revenue recognized by the chip vendor, e.g. Nvidia or Broadcom) and when they are deployed and available in a data center factor into the compute models above in two places:
- They are used to adjust estimates of Google’s and Meta’s owned compute stocks (which come from estimates of the respective companies’ purchases of Nvidia, AMD, and Broadcom chips) into deployed compute capacity.
- Less significantly, they are used to estimate the mix of OpenAI’s chip fleet over time between Nvidia GPU generations.
Our AI chip sales estimates are primarily based on recognized revenue from major chip vendors such as Nvidia, Broadcom, and AMD.24 These companies recognize revenue after hardware is delivered, but even after AI chips or servers have been delivered to a customer (which may be an intermediate customer such as a server ODM/OEM rather than a cloud company), some portion may be in storage, in transit, or being installed in a data center.
Detailed empirical evidence of these deployment lags is lacking. At a high level, there are two main sources of lag: server assembly and data center installation.
For data center installation, one useful reference is CoreWeave, which has disclosed that its hardware goes through a “~3 month installation time” between delivery and monetization. By late 2025, they had decreased this deployment time to “within weeks”.
Note that typical deployment lags may be misleading in a few ways. First, there can be systematic, industry-wide factors delaying the installation of AI chips, like technical problems with a new chip generation or infrastructure bottlenecks like power delays. For example, many Nvidia GB200 deployments were reportedly delayed for months in early 2025 due to rack heating issues, even after cloud companies received the servers. This means the ratio of deployed compute to sold compute was unusually low in the first half of 2025, though we’re not aware of any comparable issues with the GB300 or other modern AI chips right now.
If industry-wide deployment bottlenecks are persistent, they will eventually impact upstream chip sales. So when a chip company like Nvidia reports healthy growth in sales, we can retroactively judge that the industry probably did not experience severe deployment bottlenecks in the recent past. Customers may still temporarily ramp up purchases of chips they can’t install in order to secure future supply, but this will eventually become irrational or financially unsustainable.
Additionally, applying a typical/median deployment lag to past AI chip sales to estimate the deployed stock ignores the variance in deployment lags. Some chips may take longer to deploy than others. In an extreme example, imagine that two-thirds of AI chips wait in storage for an entire year, while the rest are installed almost immediately. If chip sales are growing rapidly, applying a uniform one year delay will underestimate the deployed chip fleet, because the one-third of chips that are installed right away will make up a disproportionate share of the deployed fleet at any given time.
-
“Used” in the sense of operational availability: for example, a developer may rent a certain number of AI chips from a cloud company but some of that capacity may be idle on occasion. We do not model actual utilization rates.

-
The phrase “renting” cloud compute is informal and not commonly used in industry, which more frequently speaks of “buying” and “selling” cloud compute capacity or services. “Renting” clarifies that the purchaser does not own any of the chips or data centers involved.
-
These are rounded figures, which means 0.2 GW and 0.6 GW are not very precise. Digitizing the plot they published confirms that the heights of the bars are essentially equal to the labeled numbers, so the bar sizes are probably derived from the rounded figures.
-
OpenAI has made deals to adopt AMD GPUs (signed late 2025), as well as Trainium chips and an upcoming custom chip from Broadcom, but we assume none of these reached significant scale in 2025.
-
For example, SemiAnalysis describes 5-year contracts as “typical”.
-
Excluding Chinese-market chips like the H800 and H20.
-
OpenAI also estimated that if Anthropic used OpenAI’s accounting standards, this would have reduced Anthropic’s revenue run rate by around one-fourth in early 2026, or by $8B out of a total of $30B. OpenAI doesn’t pay for Microsoft inference, so they may have meant that Anthropic should only count its gross profit from hyperscaler inference as revenue (i.e. that Anthropic should subtract both its revenue share to the hyperscalers, and the cloud compute cost payments), implying that OpenAI believed that the share of Anthropic’s booked revenue that came via hyperscaler platforms was somewhat greater than 25% at this time.
-
Though it’s almost certain that OpenAI is correct that it had significantly more compute than Anthropic at the time, e.g. due to OpenAI’s ~50% greater cumulative fundraising in 2025.
-
Based on 871 W per chip, from our data center modeling.
-
OpenAI’s compute in 2025 was comparatively less concentrated in its equivalent “Stargate” initiative, so reasoning from OpenAI data centers is less informative for OpenAI’s total compute. The only operational Stargate campus, Oracle’s Stargate Abilene, is currently less powerful than Rainier Indiana.
-
One article reports that “In 2025, Google expected to allocate around half of its computing capacity to Cloud, [Google CFO Anat] Ashkenazi said at a Morgan Stanley conference this spring.” Google will maintain a similar ratio in 2026, according to its Feb 2026 earnings call: “And for 2026, just over half of our ML compute is expected to go towards the Cloud business.” It is not clear whether this split is measured in power capacity, dollars, raw compute capacity (e.g. in FLOP/s), or some other metric.
-
“Enterprise” means serving businesses and corporate customers rather than individuals.
-
This is in tension with Google’s claimed 50/50 Cloud/non-Cloud decomposition, since DeepMind training compute would not be included in Google Cloud, and including consumer-side inference compute could easily put the DeepMind total at over 50% of all of Google’s compute, leaving no room for other, non-DeepMind internal AI compute uses.
-
This bucket dates back to 2023, when DeepMind merged with Google Brain. In 2023, Alphabet wrote that “[Alphabet-level activities] primarily include AI-focused shared R&D activities including development costs of our general AI models; corporate initiatives such as our philanthropic activities; corporate shared costs such as certain finance, human resource, and legal costs, including certain fines and settlements.” This language is essentially identical in 2024, but in 2025, while the full description of this expense category stays the same, they include a briefer summary that states “Alphabet-level activities primarily reflect expenses related to our shared AI research and development.” This implies that AI R&D had grown to make up the large majority of this bucket by 2025.
-
MSL contains a core team called “TBD” led by Alexandr Wang that is focused on frontier LLMs, but this estimate focuses on all of MSL.
-
If all of Meta’s capex went towards AI compute/data centers, and core business is most of capex, then more than half of their AI capex would go to core business uses like recommenders. But while the majority of Meta’s capex is likely AI-related, given its recent rapid growth, the AI share is not necessarily high enough to bound the generative AI share of capex. For example, if 70% of Meta capex went to AI, then AI recommenders might use just 21% of Meta’s overall capex (for a 51% core business share), and 21/70 = 30% of Meta’s AI capex. If just 60% of capex was for AI overall, AI recommenders might be only 11% of overall capex. On the other hand, Meta only said that the majority of capex would go to its core business; this share could be much greater than 51%.
-
Meta may not have actually used the entire 100k cluster for a full training run. Llama 4 Behemoth, which was the largest training run they disclosed in 2025 (though the model was never actually released) was trained using 32,000 H100s. We would guess a large training cluster like this probably would not be shared with a team working on recommenders, but we don’t know this for sure.
-
We estimate that Meta owned over 700k H100e in AI chips at the end of 2024, including 600k H100e in Nvidia GPUs (also equal to Meta’s own forecast of its 2024 year-end AI compute stock).
-
This claim about the compute per researcher isn’t specific enough to estimate MSL’s total compute. It may be scoped to “researcher compute”, distinct from compute for full-sized training runs and inference, and we don’t know how many people Meta counts as a “researcher” in this context.
-
They also attribute a surprisingly small sliver to MSL in 2024, though the meaning of this allocation is not clear, since “MSL” did not formally exist in 2024.
-
Meta disclosed that it signed a total of $40 billion in cloud compute contracts in October 2025. It’s unclear how much this overlaps with the publicly reported deals; $40 billion is roughly equal to the reported total value of the three public deals, but the Google deal was reportedly signed in August 2025 (while the reporting on the CoreWeave and Oracle deals were from late September, making them more likely to be included in the October total). Overall, at the end of 2025, Meta reported its “non-cancelable contractual commitments”, including cloud compute and other commitments, at $30B in 2026, ramping down to ~$20B per year in 2029-2030. This creates an upper bound larger than the ~$7B/year run rate based on the reporting on Google/CoreWeave/Oracle, though these commitments include other expenses. Meta signed another deal with CoreWeave in April 2026.
-
Customer A, which was 45% of Q1 2026 sales, also made up 72% of CoreWeave’s revenue in 2025, and Microsoft is known to historically be CoreWeave’s dominant customer. In its Q2 2026 filing, CoreWeave calls out OpenAI as another significant customer, with contracts worth $22 billion signed in 2025, along with Meta.
-
SpaceX’s disclosures don’t pin down the exact timeline of Colossus 2’s phases. For example, they report a capacity of 1.0 GW as of March 31, 2026, but do not report a figure for the end of 2025.
-
For Amazon Trainium and Huawei, we rely on company disclosures and third-party estimates respectively rather than recognized revenue, and it is not clear whether they better describe sold chip counts or deployed chip counts. See the AI Chip Sales methodology for more details.