
While GPUs are central to work done at frontier AI data centers, these advanced chips only use about 40% of the total power used during peak operation. Power inefficiencies, cooling, and interconnect between chips at the data center use much of the remaining energy.
| Layer | Percentage of facility power |
|---|---|
| Total facility power | 100 |
| Total IT power | 71 |
| Total server power | 63 |
| GPU power | 41 |
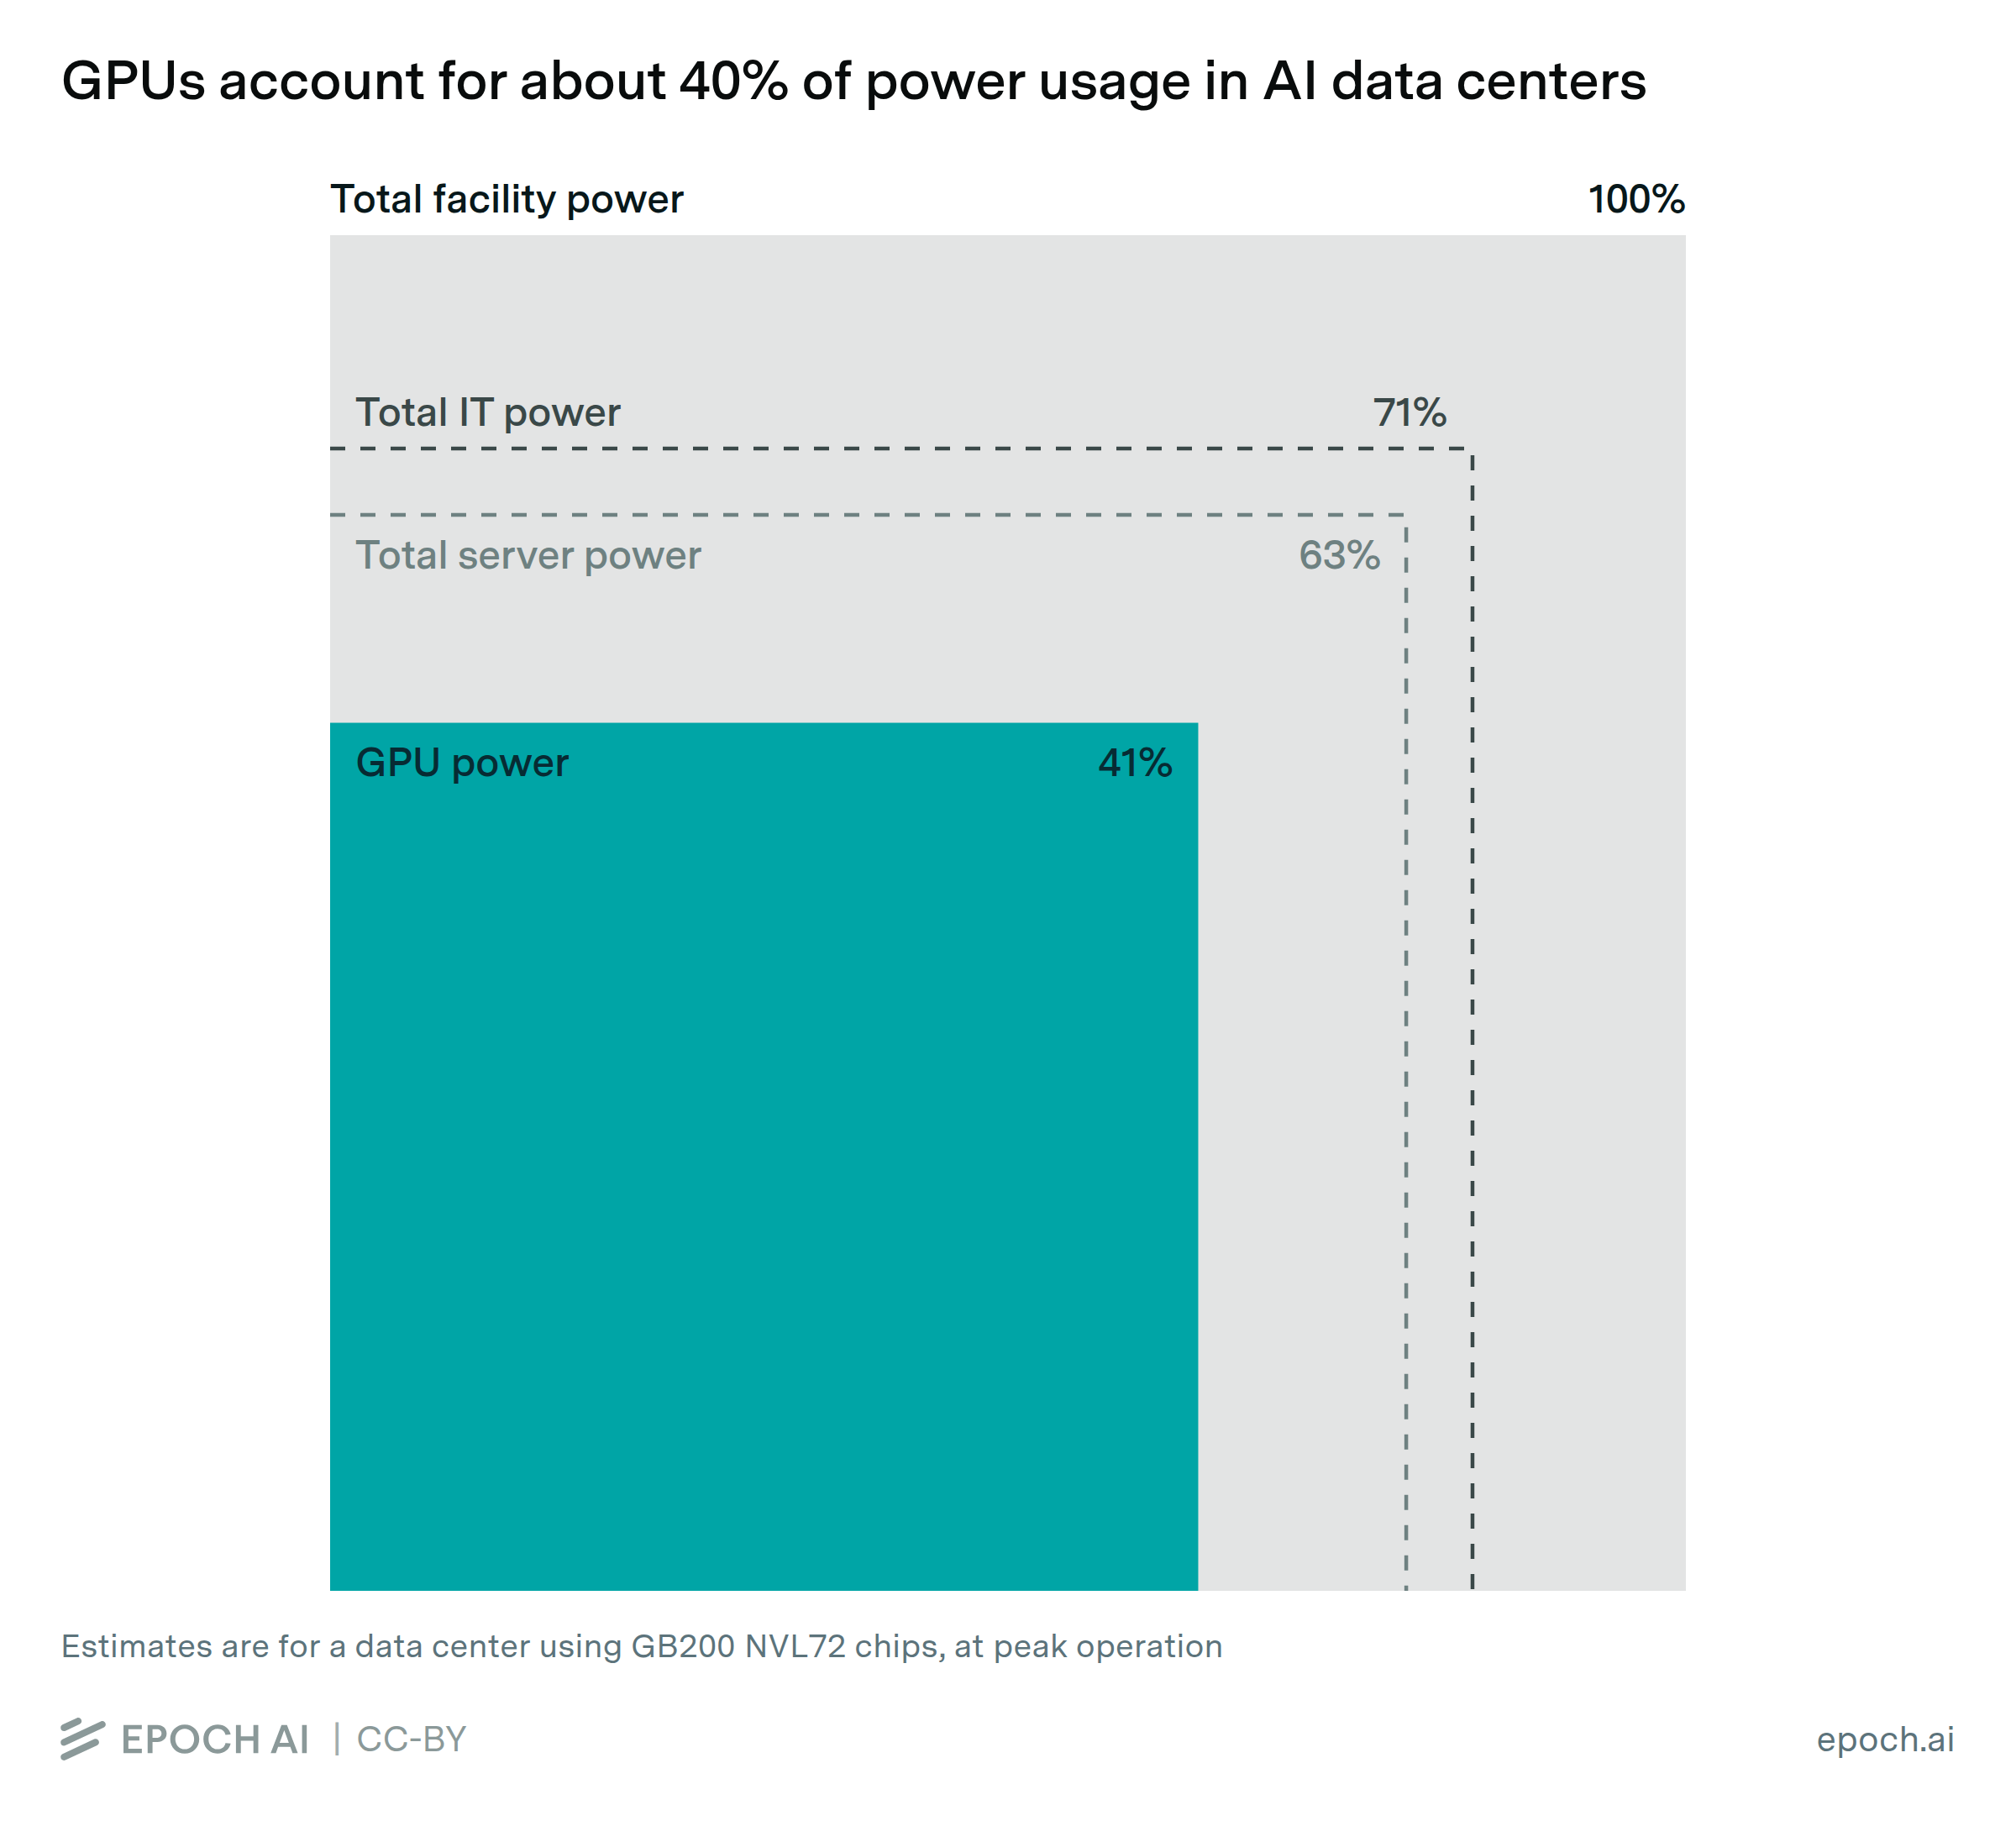
In a typical frontier AI data center, total server power is 1.53x GPU power alone. IT equipment uses 1.14x as much power as the servers, with needs like inter-server networking consuming the excess. At the facility level, cooling, lighting, and power conversion losses add a further 1.4x overhead.
Epoch's work is free to use, distribute, and reproduce provided the source and authors are credited under the Creative Commons BY license.
Learn more about this graph
We estimate the fraction of power within frontier AI data centers attributable to several nested categories of power use:
- GPUs
- Servers (GPUs plus CPUs, interconnect, storage, etc. within a server)
- All IT equipment (all of the above plus interserver switches, management nodes, etc.)
- Total facility power (accounts for extra power usage from things like lighting, cooling, and power inefficiencies)
All calculations are based on a data center at peak operation.
Data
Our analysis is based on data we obtained in order to estimate the total power demands of planned data centers for our Frontier Data Centers hub.
- Peak PUE (1.4)
- Total facility power / total IT power.
- It captures overhead from non-IT sources like lighting, cooling, and power loss due to inefficiencies.
- Obtained by averaging two sources: Uptime Institute (1.44, based on a sample of data centers over 30MW) and SemiAnalysis (1.35, for AI data centers using several types of NVIDIA chips)
- Power Usage Effectiveness (PUE) typically refers to average facility power usage divided by average IT power usage. We use the word “peak” here to indicate that we calculate the ratio at maximum utilization, rather than average utilization during operation over the course of a year.
- IT power overhead factor (1.14)
- Total IT power / total server power.
- Tells us how much extra power is needed to support non-server IT equipment, on top of server power demand specs.
- This value is obtained from the DGX GB200 SuperPOD reference architecture.
- Server power overhead (1.53)
- Total server power / total GPU power.
- Tells us how much extra power is needed to support within-server IT equipment (CPUs, interconnect, etc.), on top of GPU power demand specs.
- Calculated based on NVIDIA GB200 NVL72 specs.

Total overhead is given by 1.53 x 1.14 x 1.4 = 2.44. We report the fraction of this total amount used by each category.
Limitations
Our estimates are largely based on reference architectures and specs for NVIDIA GB200 systems, but values for real world data centers may vary. For instance, cooling is a substantial component of Peak PUE, and air-cooled and water-cooled chillers differ in efficiency by up to 2x.
Download this data
Explore this data

Open database of AI data centers using satellite and permit data to show AI compute, power use, and construction timelines.
Related insights