The AI data center buildout is one of the largest-scale infrastructure projects in human history. Empty plots of land are being transformed into sprawling, gigawatt-scale facilities in under two years, using as much electricity as a small city. The scale and speed of this transformation are hard to comprehend. We created the AI Data Centers explorer to make sense of this massive buildout, and now we’re scaling it up to more comprehensive global coverage. We also redesigned the page to make it easier to find and visualize key information.
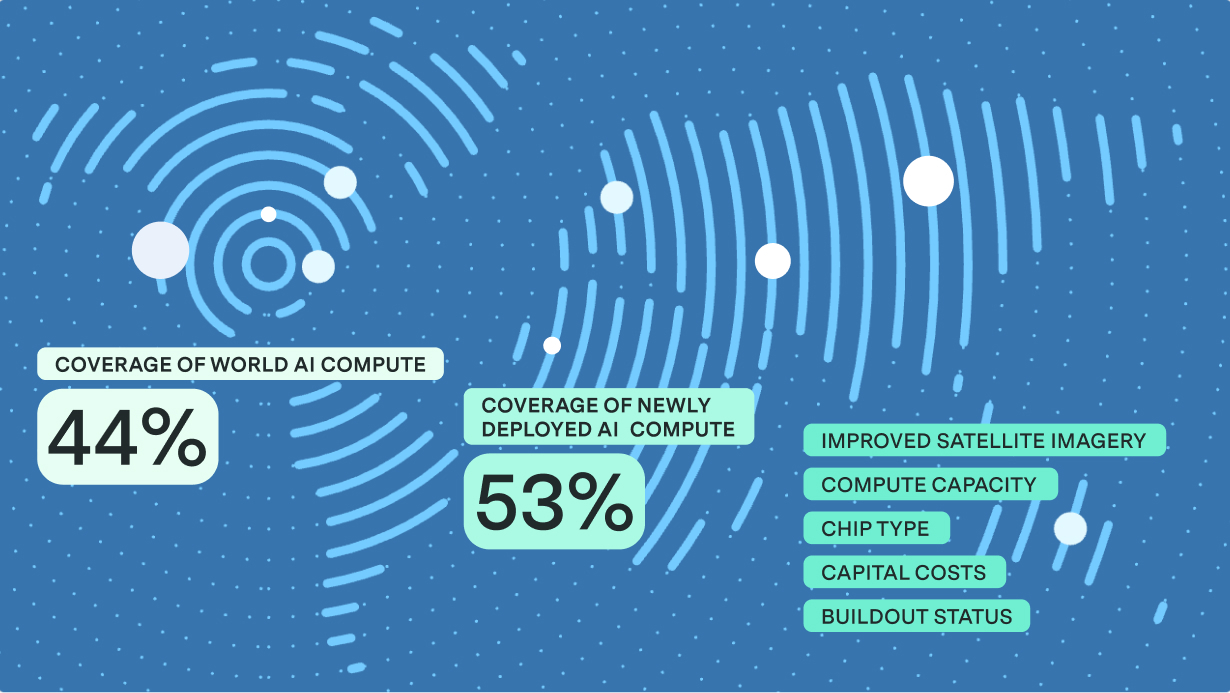
When we announced the explorer back in November, it covered 13 data centers that made up an estimated 15% of global AI compute. Today, our research covers an estimated 44% of global AI compute, spread over 86 data centers. For each site, we provide satellite imagery and detailed facility data, including compute capacity in H100-equivalents, chip type(s), capital costs, and construction status. So far in 2026, we’ve captured an estimated 53% of all newly deployed compute, compared with 39% of compute deployed in 2025 and 26% in 2024.

We began our data center research with a focus on the largest data centers used for frontier AI, but as we scale, we’re capturing a wider range of facility sizes in more countries; for example, the explorer now includes the 41-MW Southgate Melbourne in Australia and 72-MW Oracle Batam in Indonesia.
New design
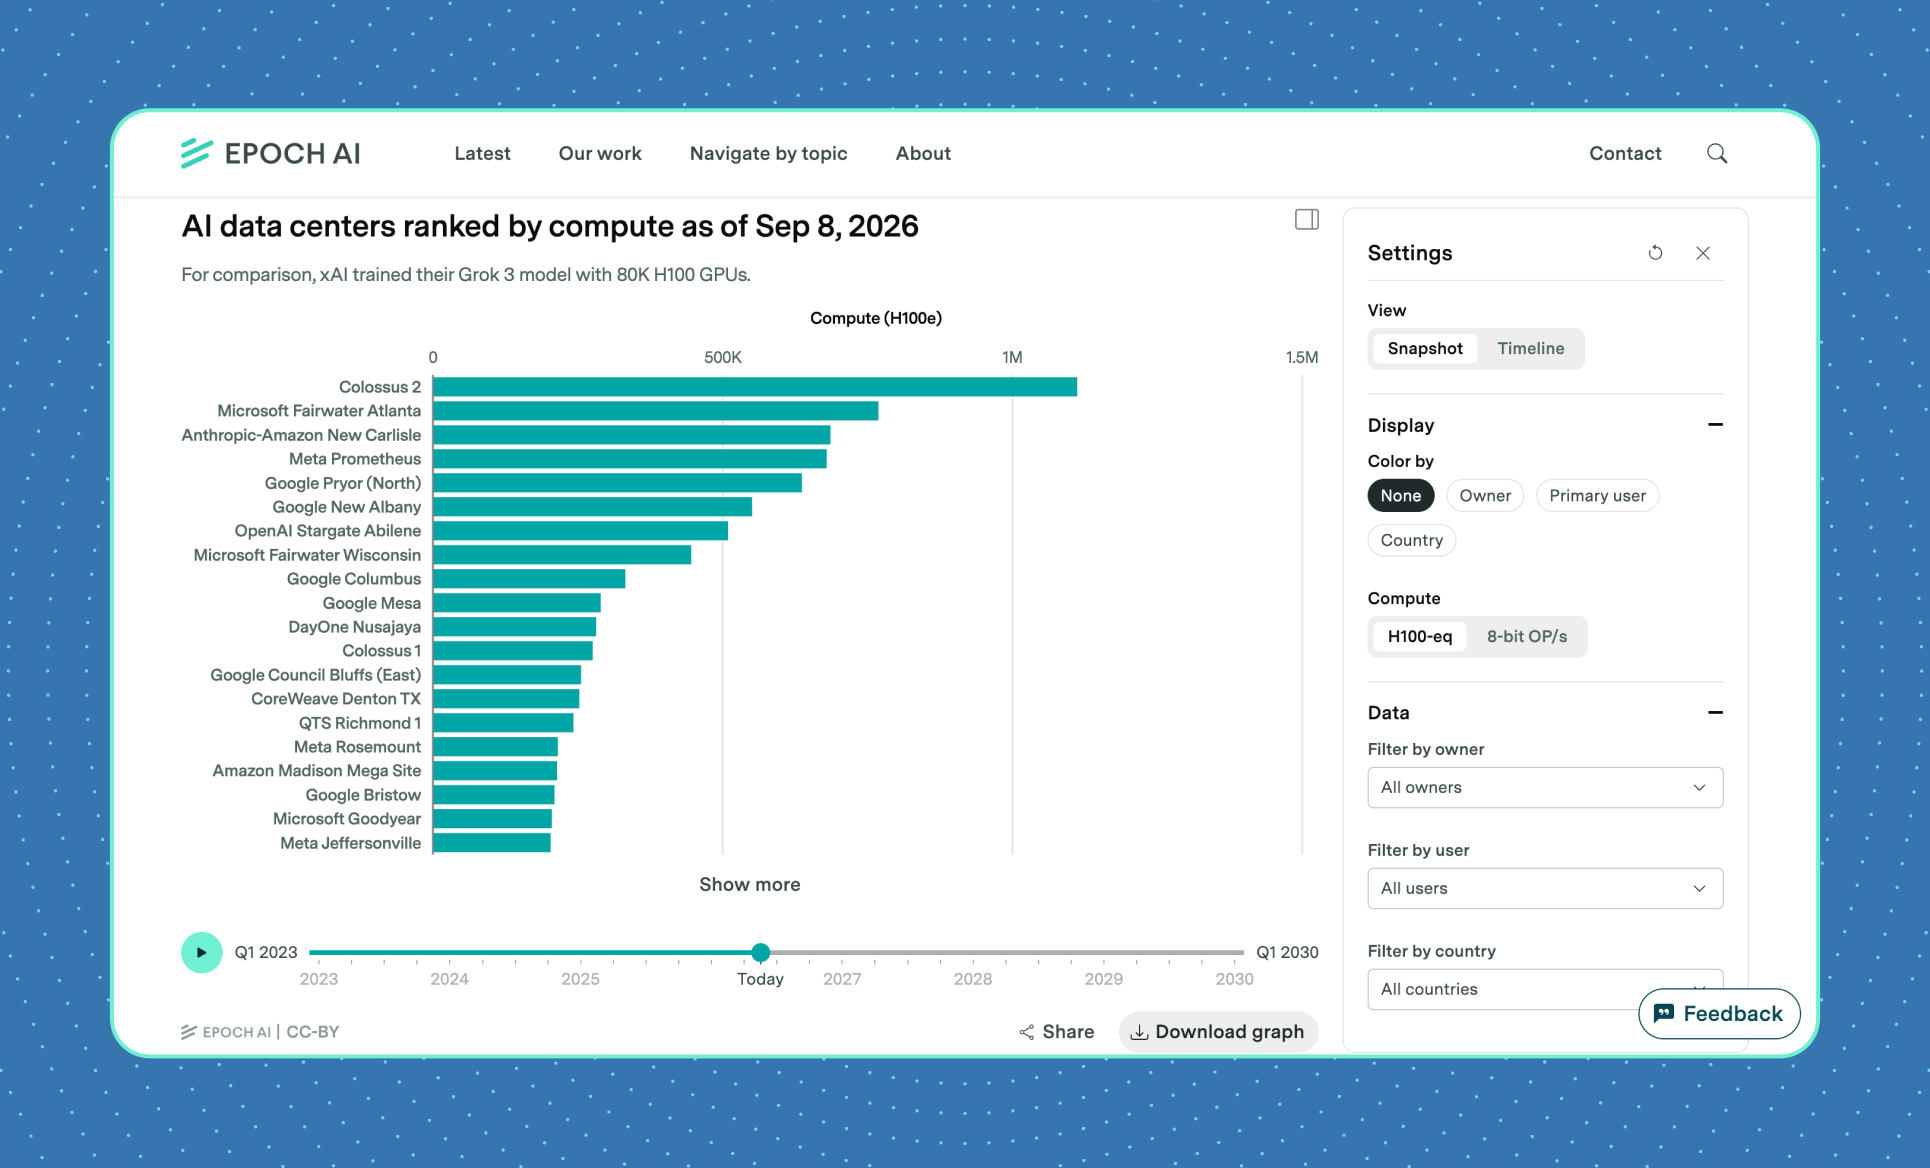
The first thing you’ll see on the landing page is a snapshot of the world’s largest data centers, ranked by computing capacity, IT power capacity, or cost. You can move backward and forward through time, and filter or recolor the chart by owner, primary user, or country.
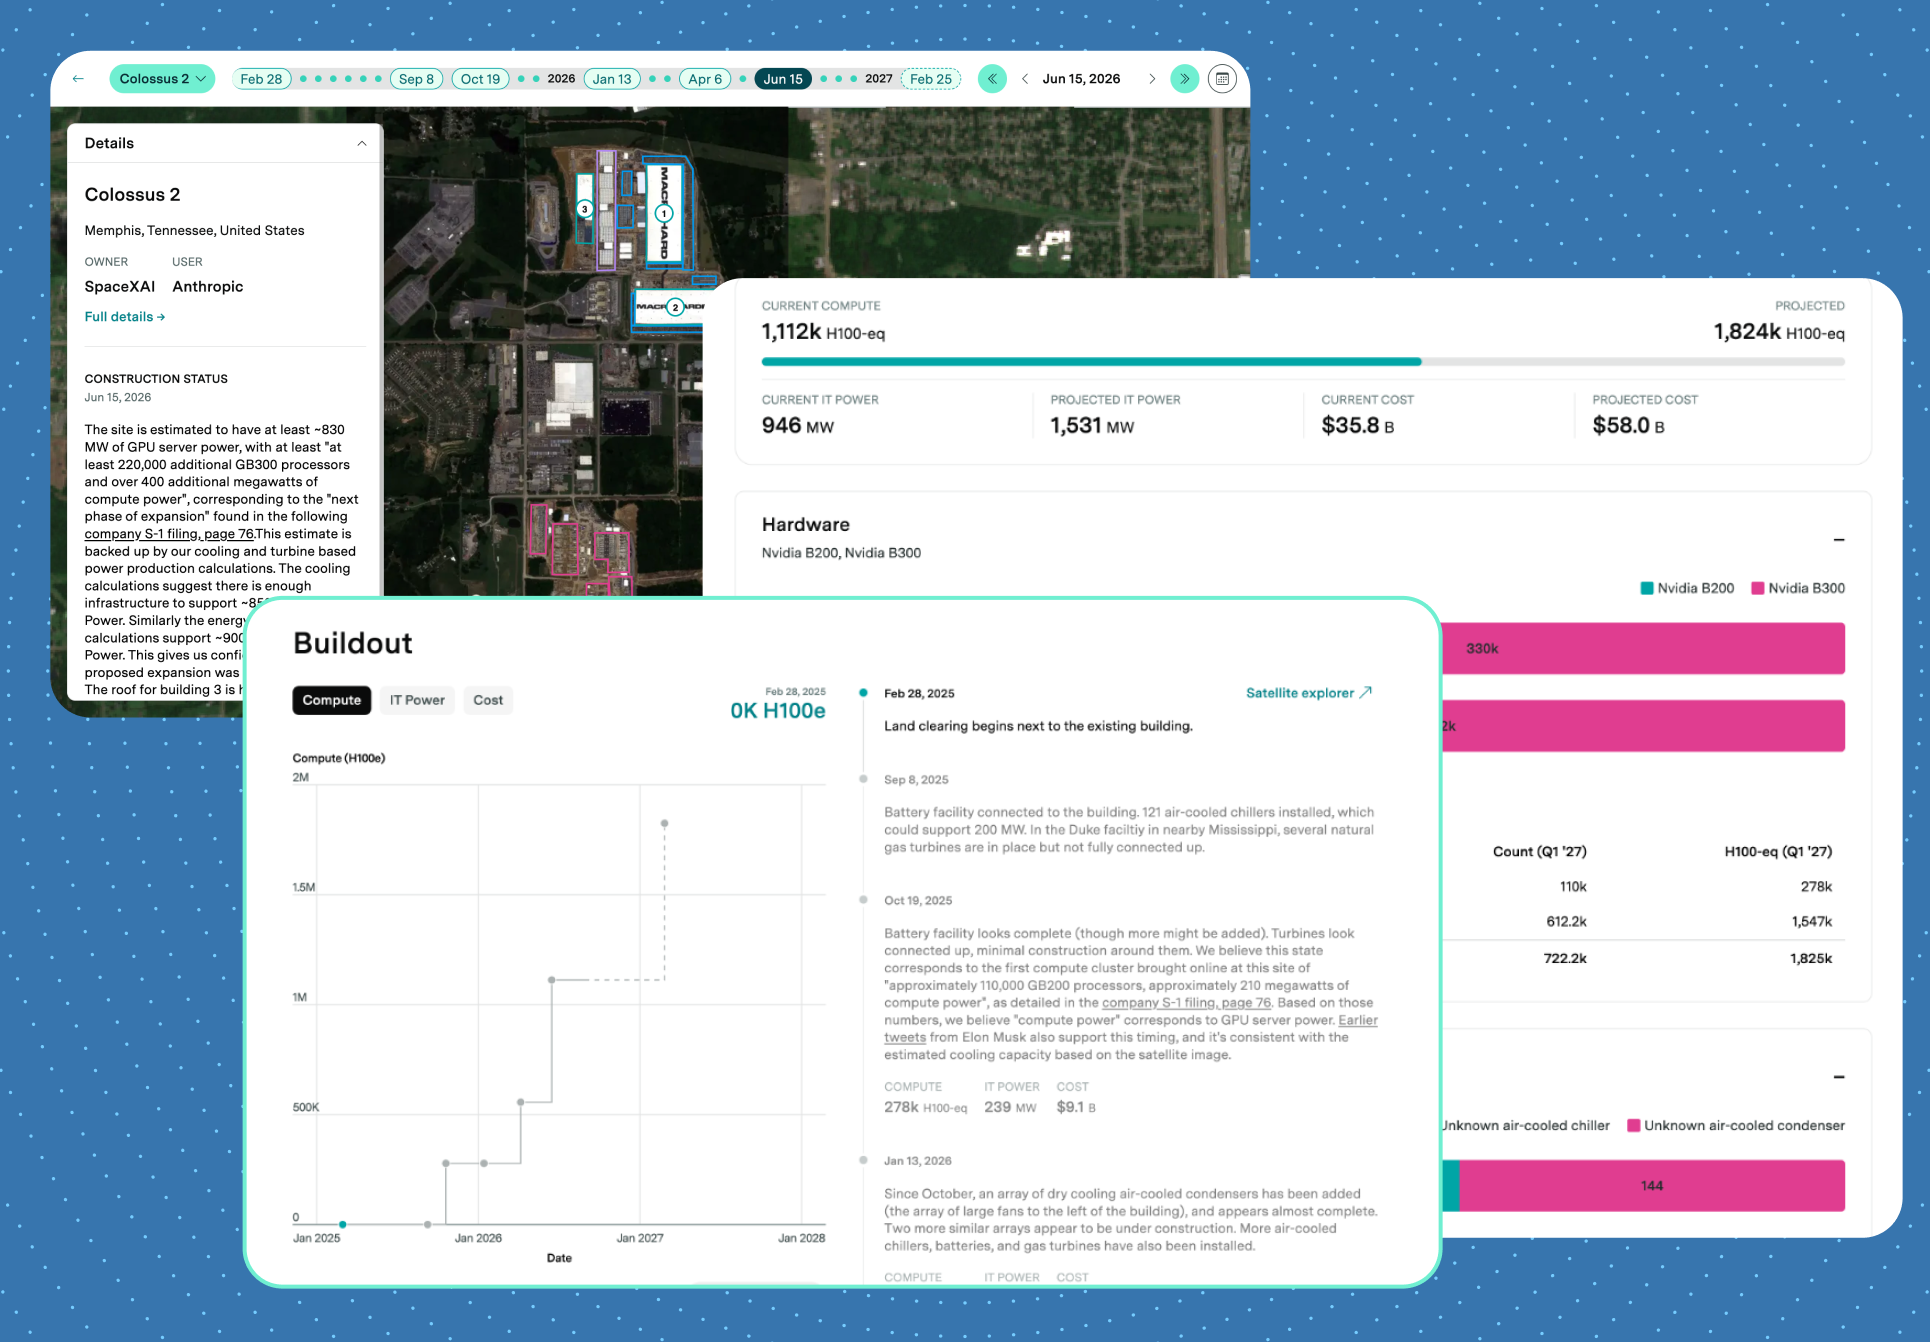
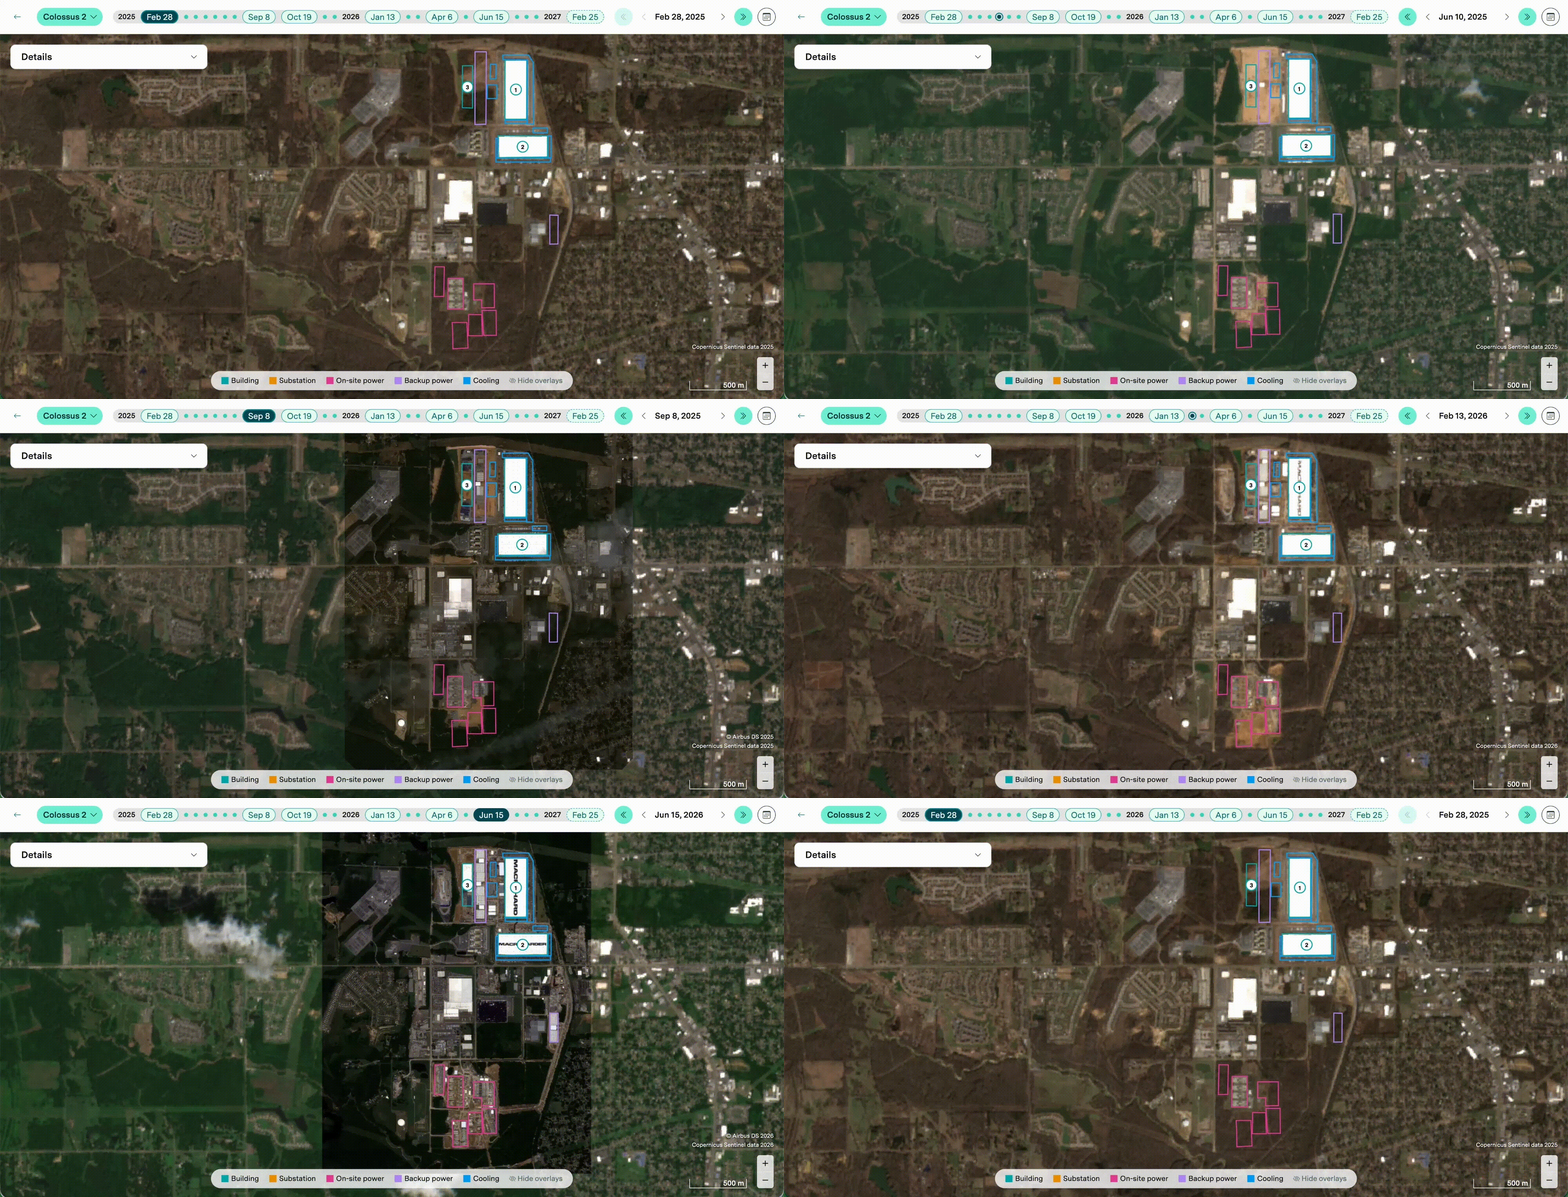
The new Directory tab lets you drill down into individual sites to see details like which AI chips and cooling equipment are used at each site. You can watch a site evolve from an empty field into a multi-building campus by comparing satellite imagery from different points in the buildout, with qualitative descriptions of what changed at each stage.
How do we know how much compute we’re missing?
The explorer now covers an estimated 44% of global AI compute. We estimate coverage by adding up all the compute capacity of operational data centers (in H100-equivalents) and dividing by the total amount of AI compute we estimate was delivered to the world’s major customers 3 months earlier, assuming a 3-month deployment lag. At the end of 2025, that total delivered compute was about 20.3 million H100-equivalents, and we extrapolated that to 31.6 million by September 2026. You can find those estimates and the methodology behind them in our AI Chip Owners explorer, and we’ve made the code used to calculate coverage estimates publicly available.
Coverage varies by company: our data currently includes most of Meta’s AI compute, while much of Microsoft’s and Amazon’s compute is not yet captured. Public-cloud deployments are harder to attribute and quantify because the same infrastructure may serve several customers.

Our coverage of Chinese data centers is relatively low, at 9-31%, and we aim to improve it in the coming months.
Finally, we added a changelog that shows when we’ve updated any data center info.
As the dataset grows, so does the picture it gives us of the global AI buildout, from individual facilities to broader trends. Use the explorer to see where, when, and how compute is being deployed around the world.
About the authors



Related work