
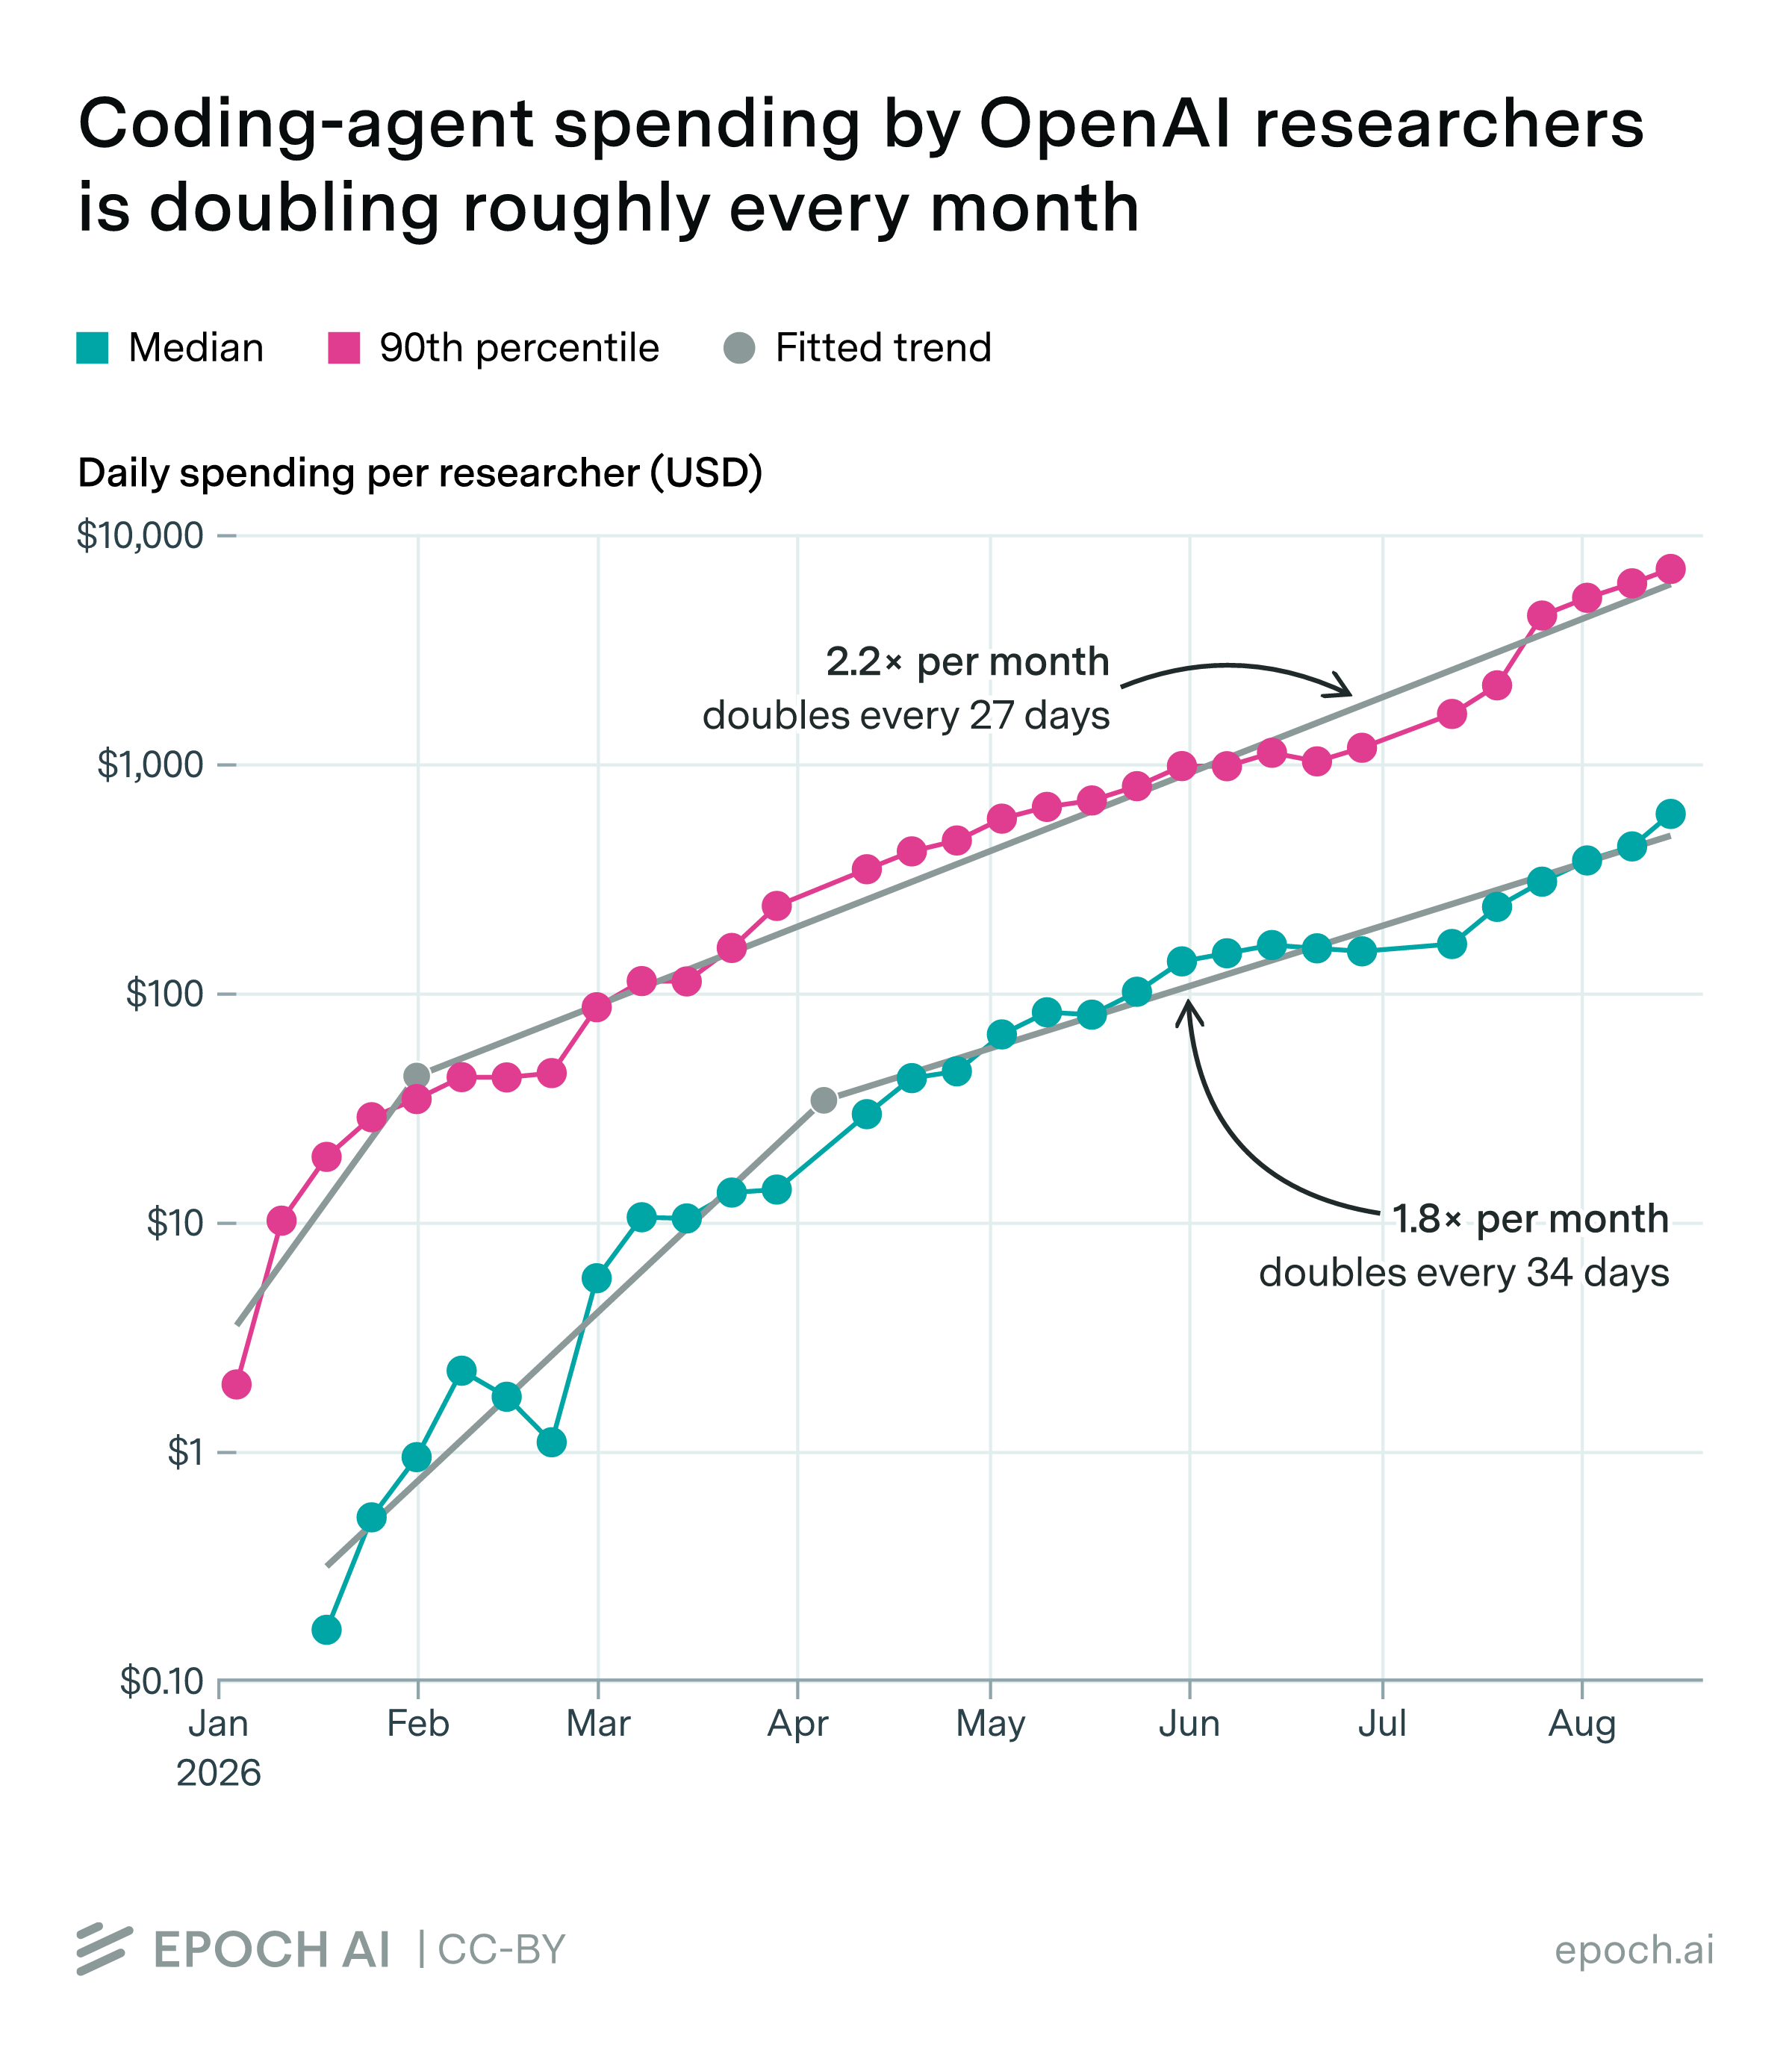
OpenAI’s researchers are spending rapidly growing amounts of compute on coding agents. According to data published in a September 2026 post by OpenAI, the median researcher’s daily coding-agent usage, valued at API prices, rose from under $1 in January 2026 to $601 by mid-August. Usage by power users grew at a similar rate, but spent substantially more, with the 90th percentile researcher spending over $7,000 per day by mid-August. Exponential fits to the weekly data imply a doubling time of roughly one month for both groups.
| Week ending | Median researcher (USD per day) | 90th percentile researcher (USD per day) |
|---|---|---|
| 2026-01-04 | $0.00 | $1.95 |
| 2026-01-11 | $0.00 | $10.10 |
| 2026-01-18 | $0.17 | $19.17 |
| 2026-01-25 | $0.51 | $28.56 |
| 2026-02-01 | $0.94 | $34.27 |
| 2026-02-08 | $2.24 | $42.72 |
| 2026-02-15 | $1.72 | $42.60 |
| 2026-02-22 | $1.09 | $44.49 |
| 2026-03-01 | $5.66 | $86.23 |
| 2026-03-08 | $10.45 | $112.15 |
| 2026-03-15 | $10.33 | $111.75 |
| 2026-03-22 | $13.40 | $156.41 |
| 2026-03-29 | $13.81 | $238.60 |
| 2026-04-12 | $29.44 | $344.95 |
| 2026-04-19 | $42.30 | $412.73 |
| 2026-04-26 | $45.30 | $460.49 |
| 2026-05-03 | $65.62 | $573.46 |
| 2026-05-10 | $81.96 | $645.31 |
| 2026-05-17 | $80.04 | $688.37 |
| 2026-05-24 | $100.74 | $794.73 |
| 2026-05-31 | $136.68 | $972.41 |
| 2026-06-07 | $148.29 | $971.08 |
| 2026-06-14 | $161.09 | $1,111.22 |
| 2026-06-21 | $155.84 | $1,019.54 |
| 2026-06-28 | $151.20 | $1,168.94 |
| 2026-07-12 | $162.73 | $1,641.76 |
| 2026-07-19 | $236.33 | $2,188.39 |
| 2026-07-26 | $304.45 | $4,412.50 |
| 2026-08-02 | $376.83 | $5,274.25 |
| 2026-08-09 | $433.89 | $6,099.65 |
| 2026-08-15 | $601.25 | $7,047.13 |
These figures price inference at OpenAI’s API list prices rather than its internal cost, so they do not measure OpenAI’s actual expenditures. They do, however, show how quickly researchers increased their coding-agent usage and illustrate its scale: if a 90th-percentile researcher used $7,000 worth of inference at API prices every working day, that would amount to around $2 million per year, which is comparable to or greater than the cost of employing a researcher.
Epoch's work is free to use, distribute, and reproduce provided the source and authors are credited under the Creative Commons BY license.
Learn more about this graph
OpenAI’s post “Research acceleration: The view inside OpenAI” describes how its researchers’ use of coding agents changed from January to mid-August 2026. We extracted the data embedded in OpenAI’s first two charts and fit trends to show how quickly usage grew for median and 90th percentile researchers. Our preferred fit is an exponential trend with a single breakpoint in the slope. In recent months, median and 90th percentile researchers have seen similar growth rates of 1.8× and 2.2× per month, or doubling times of 34 and 27 days, respectively. Both series grew several thousandfold from their first positive January values to mid-August.
Data
We use OpenAI’s weekly series for median and 90th-percentile coding-agent usage, valued at API prices. Each point averages the daily percentiles over that week. We fit all weeks with positive values, including the final partial week. OpenAI includes researchers with no usage when calculating daily percentiles and excludes company-wide holidays from weekly averages. For the median series, we omit the first two weeks, since they have values of zero, and the logarithm of zero is undefined.
OpenAI describes its methodology as follows. Usage is valued at retail API prices as of September 3, 2026, using the processing tier most similar to the internal deployment. Internal or pre-deployment models are mapped to the price of their nearest production counterpart, generally the final checkpoint released. The data cover traffic from research employees, with “researcher” defined broadly as any member of the research organization, including employees who build research infrastructure or manage research projects. Only product surfaces corresponding to interactive usage are included; programmatic automations such as Codex exec are excluded. OpenAI notes that the metrics cover most, but not all, coding-agent usage.
Analysis
We fit two models to the logarithm of each series: a simple linear trend and a continuous piecewise-linear trend with one fitted breakpoint. We require at least five observations in each segment, counting an observation at the breakpoint toward both segments, and select the model with the lower Bayesian information criterion (BIC). BIC penalizes the additional slope and estimated breakpoint. For both median and 90th percentile researchers, the breakpoint model is preferred. A summary of these fits is provided in the table below.
| Series | Model/phase | Growth per month | Doubling time (days) | BIC |
|---|---|---|---|---|
| Median | Simple | 2.7× (2.5–3.0) | 21 (19–23) | 67.0 |
| Breakpoint: before | 6.3× (4.9–8.3) | 11 (10–13) | 32.6 | |
| Breakpoint: after | 1.8× (1.6–2.1) | 34 (29–42) | ||
| 90th percentile | Simple | 2.4× (2.2–2.6) | 24 (23–26) | 49.4 |
| Breakpoint: before | 15× (7.0–23) | 8 (7–11) | 27.5 | |
| Breakpoint: after | 2.2× (2.0–2.3) | 27 (26–30) |
Parentheses show 90% confidence intervals: conventional OLS Student-t intervals for the simple fits, and approximate percentile intervals from 1,000,000 Gaussian log-error bootstrap replicates for the breakpoint fits.
At API prices, the final weekly values amount to about $160,000 per year for the median researcher and about $2 million per year for the 90th percentile researcher, assuming 260 working days per year. Such rapid growth is probably unsustainable: if the recent growth in our preferred models continued for another year, annualized run rates would reach about $185 million for the median researcher and $2.3 billion for the 90th percentile researcher.
Assumptions and limitations
These data are self-reported by OpenAI and cannot be independently verified. Because values are computed at API list prices, they do not reflect OpenAI’s internal marginal cost of inference; the post gives no information about hardware costs, utilization, or any discounts, so the figures cannot be converted into actual costs to the organization.
The median and 90th percentile are cross-sectional statistics computed over all researchers each day, so they do not track a fixed group of people: the composition of the research organization, and of the researchers at each percentile, can change over time. Because researchers with zero eligible usage are included, the early median values are sensitive to how many researchers had started using coding agents at all, and the median’s early growth reflects both adoption and increased intensity of use.
Changing the minimum segment size from five observations to four or six has little effect on the recent growth estimates. The median’s recent trend stays at 1.8× per month, while the 90th percentile’s recent trend varies only slightly, from 2.1× to 2.2× per month. The 90th percentile fit’s estimated breakpoint moves from January 25 to February 8, so the breakpoint date and initial growth rate are less robust than the recent trend.
Download this data
Related insights