LLM inference prices have fallen rapidly but unequally across tasks
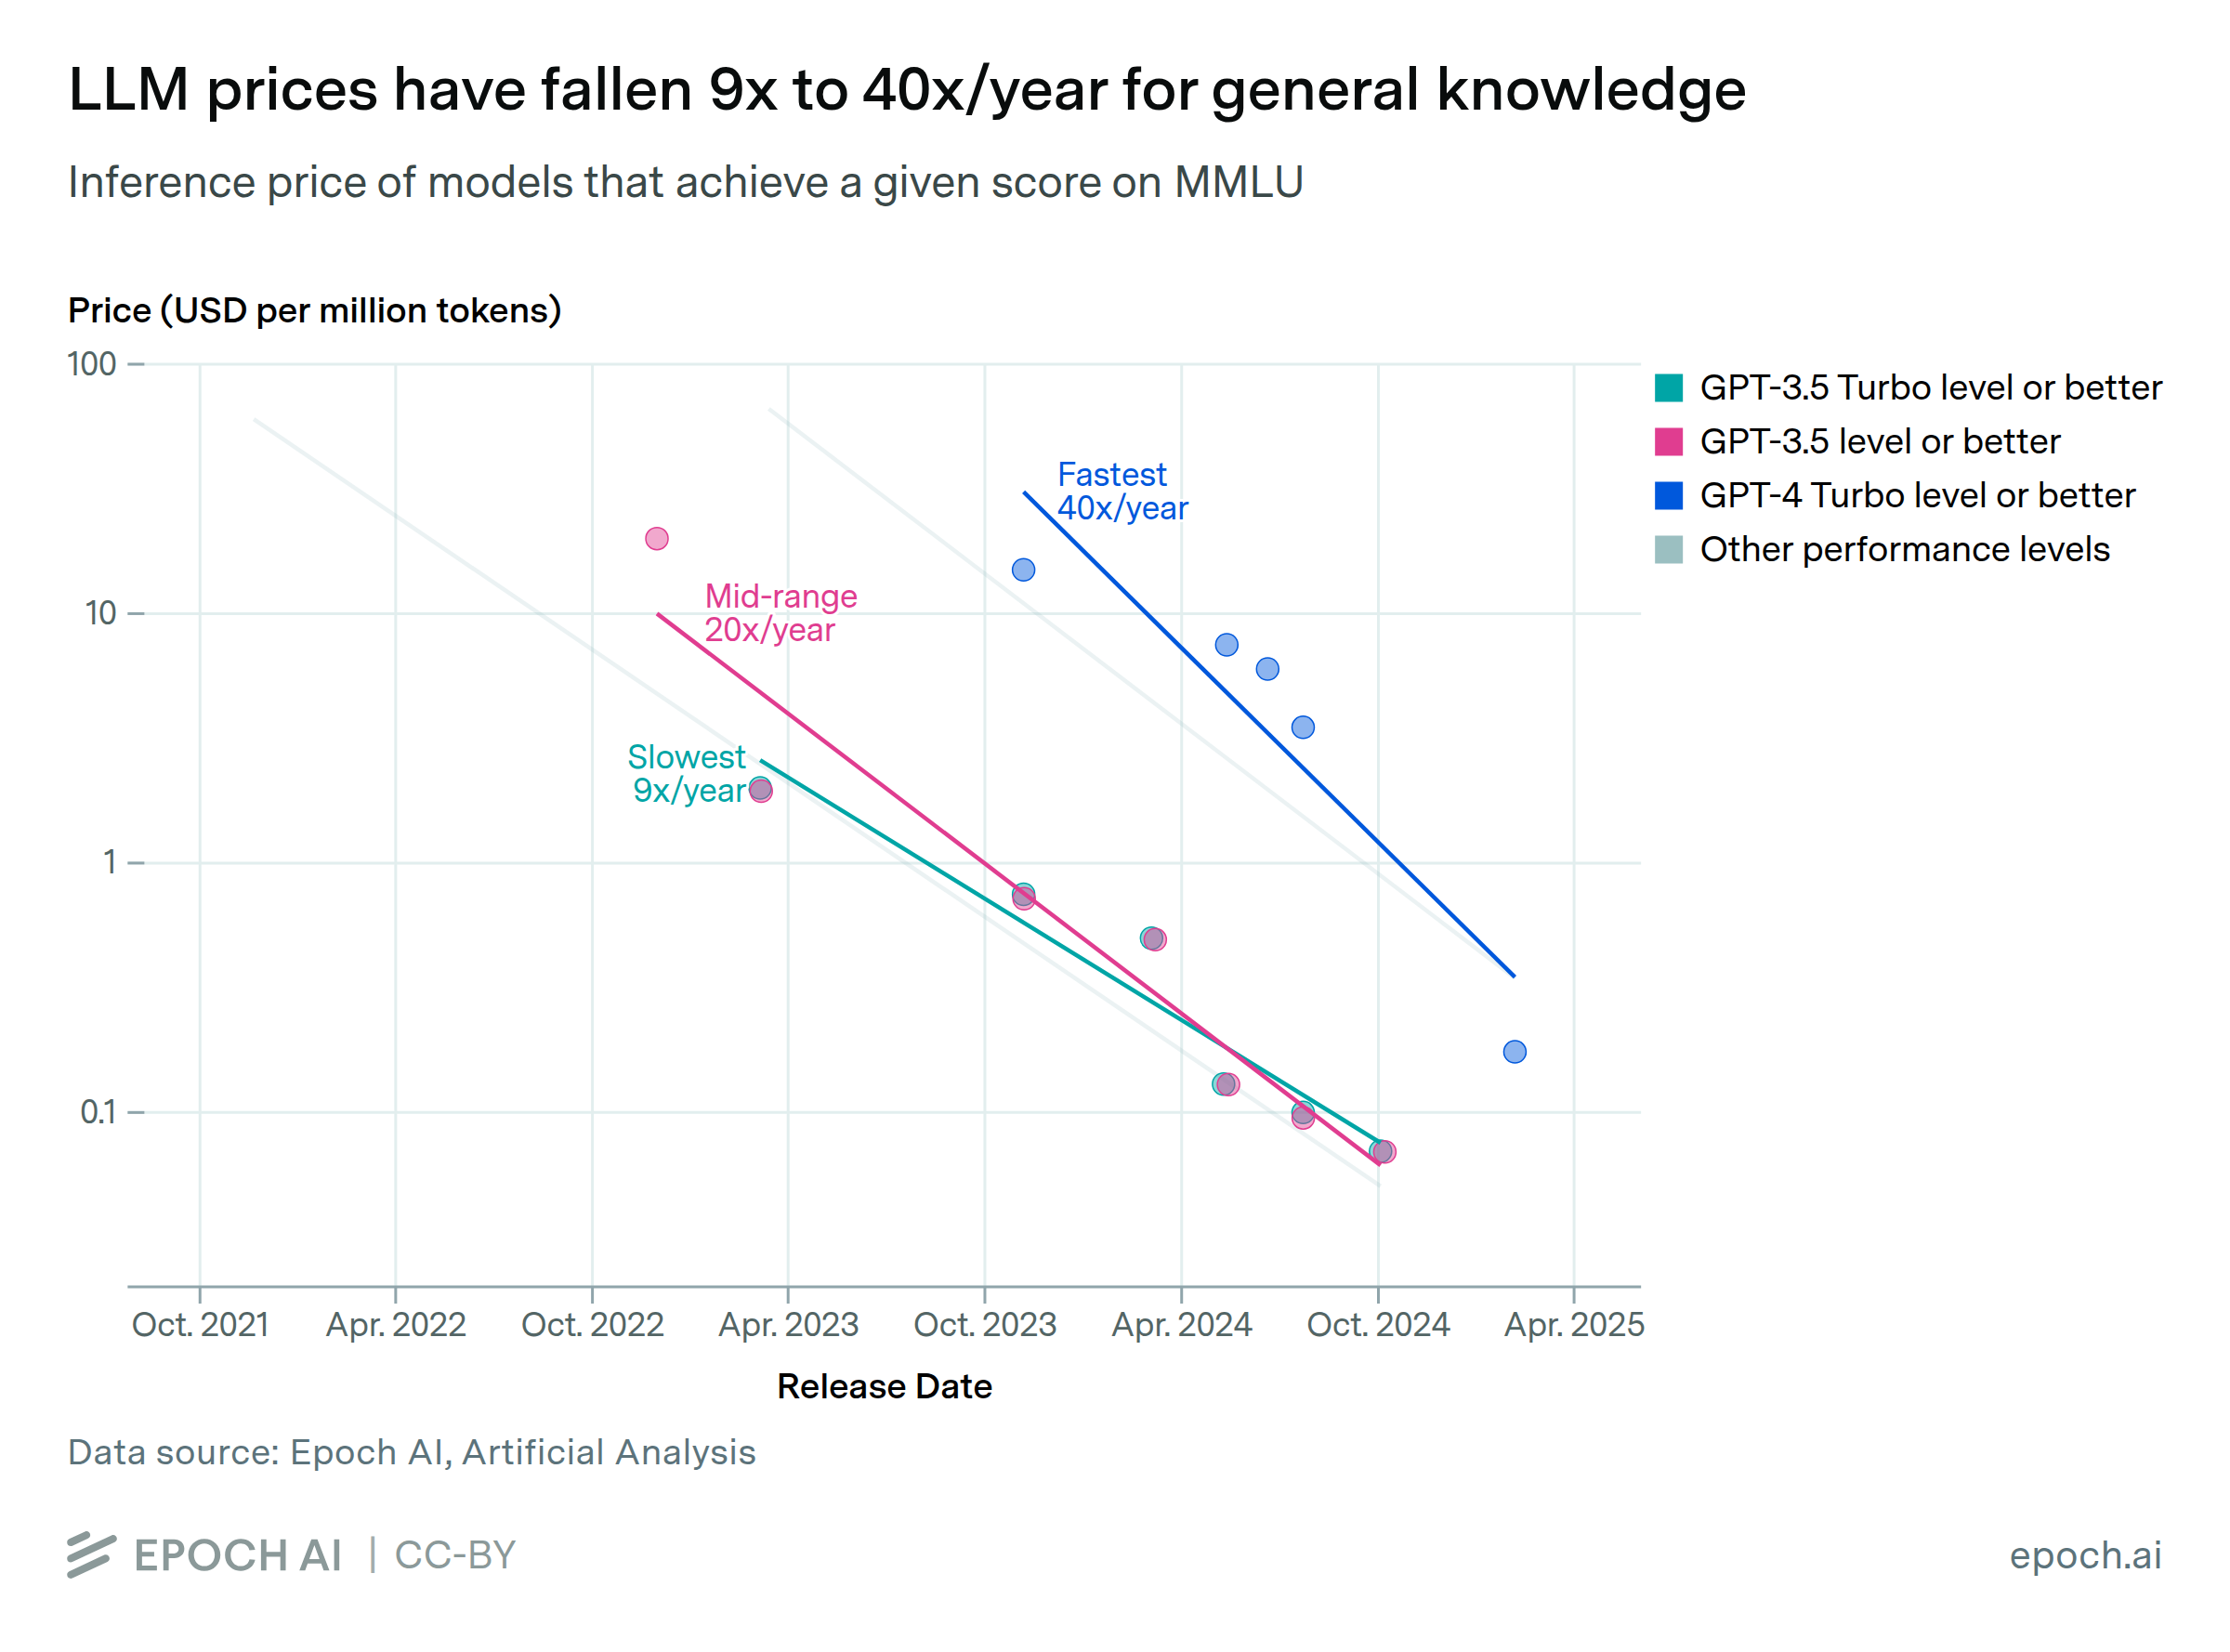
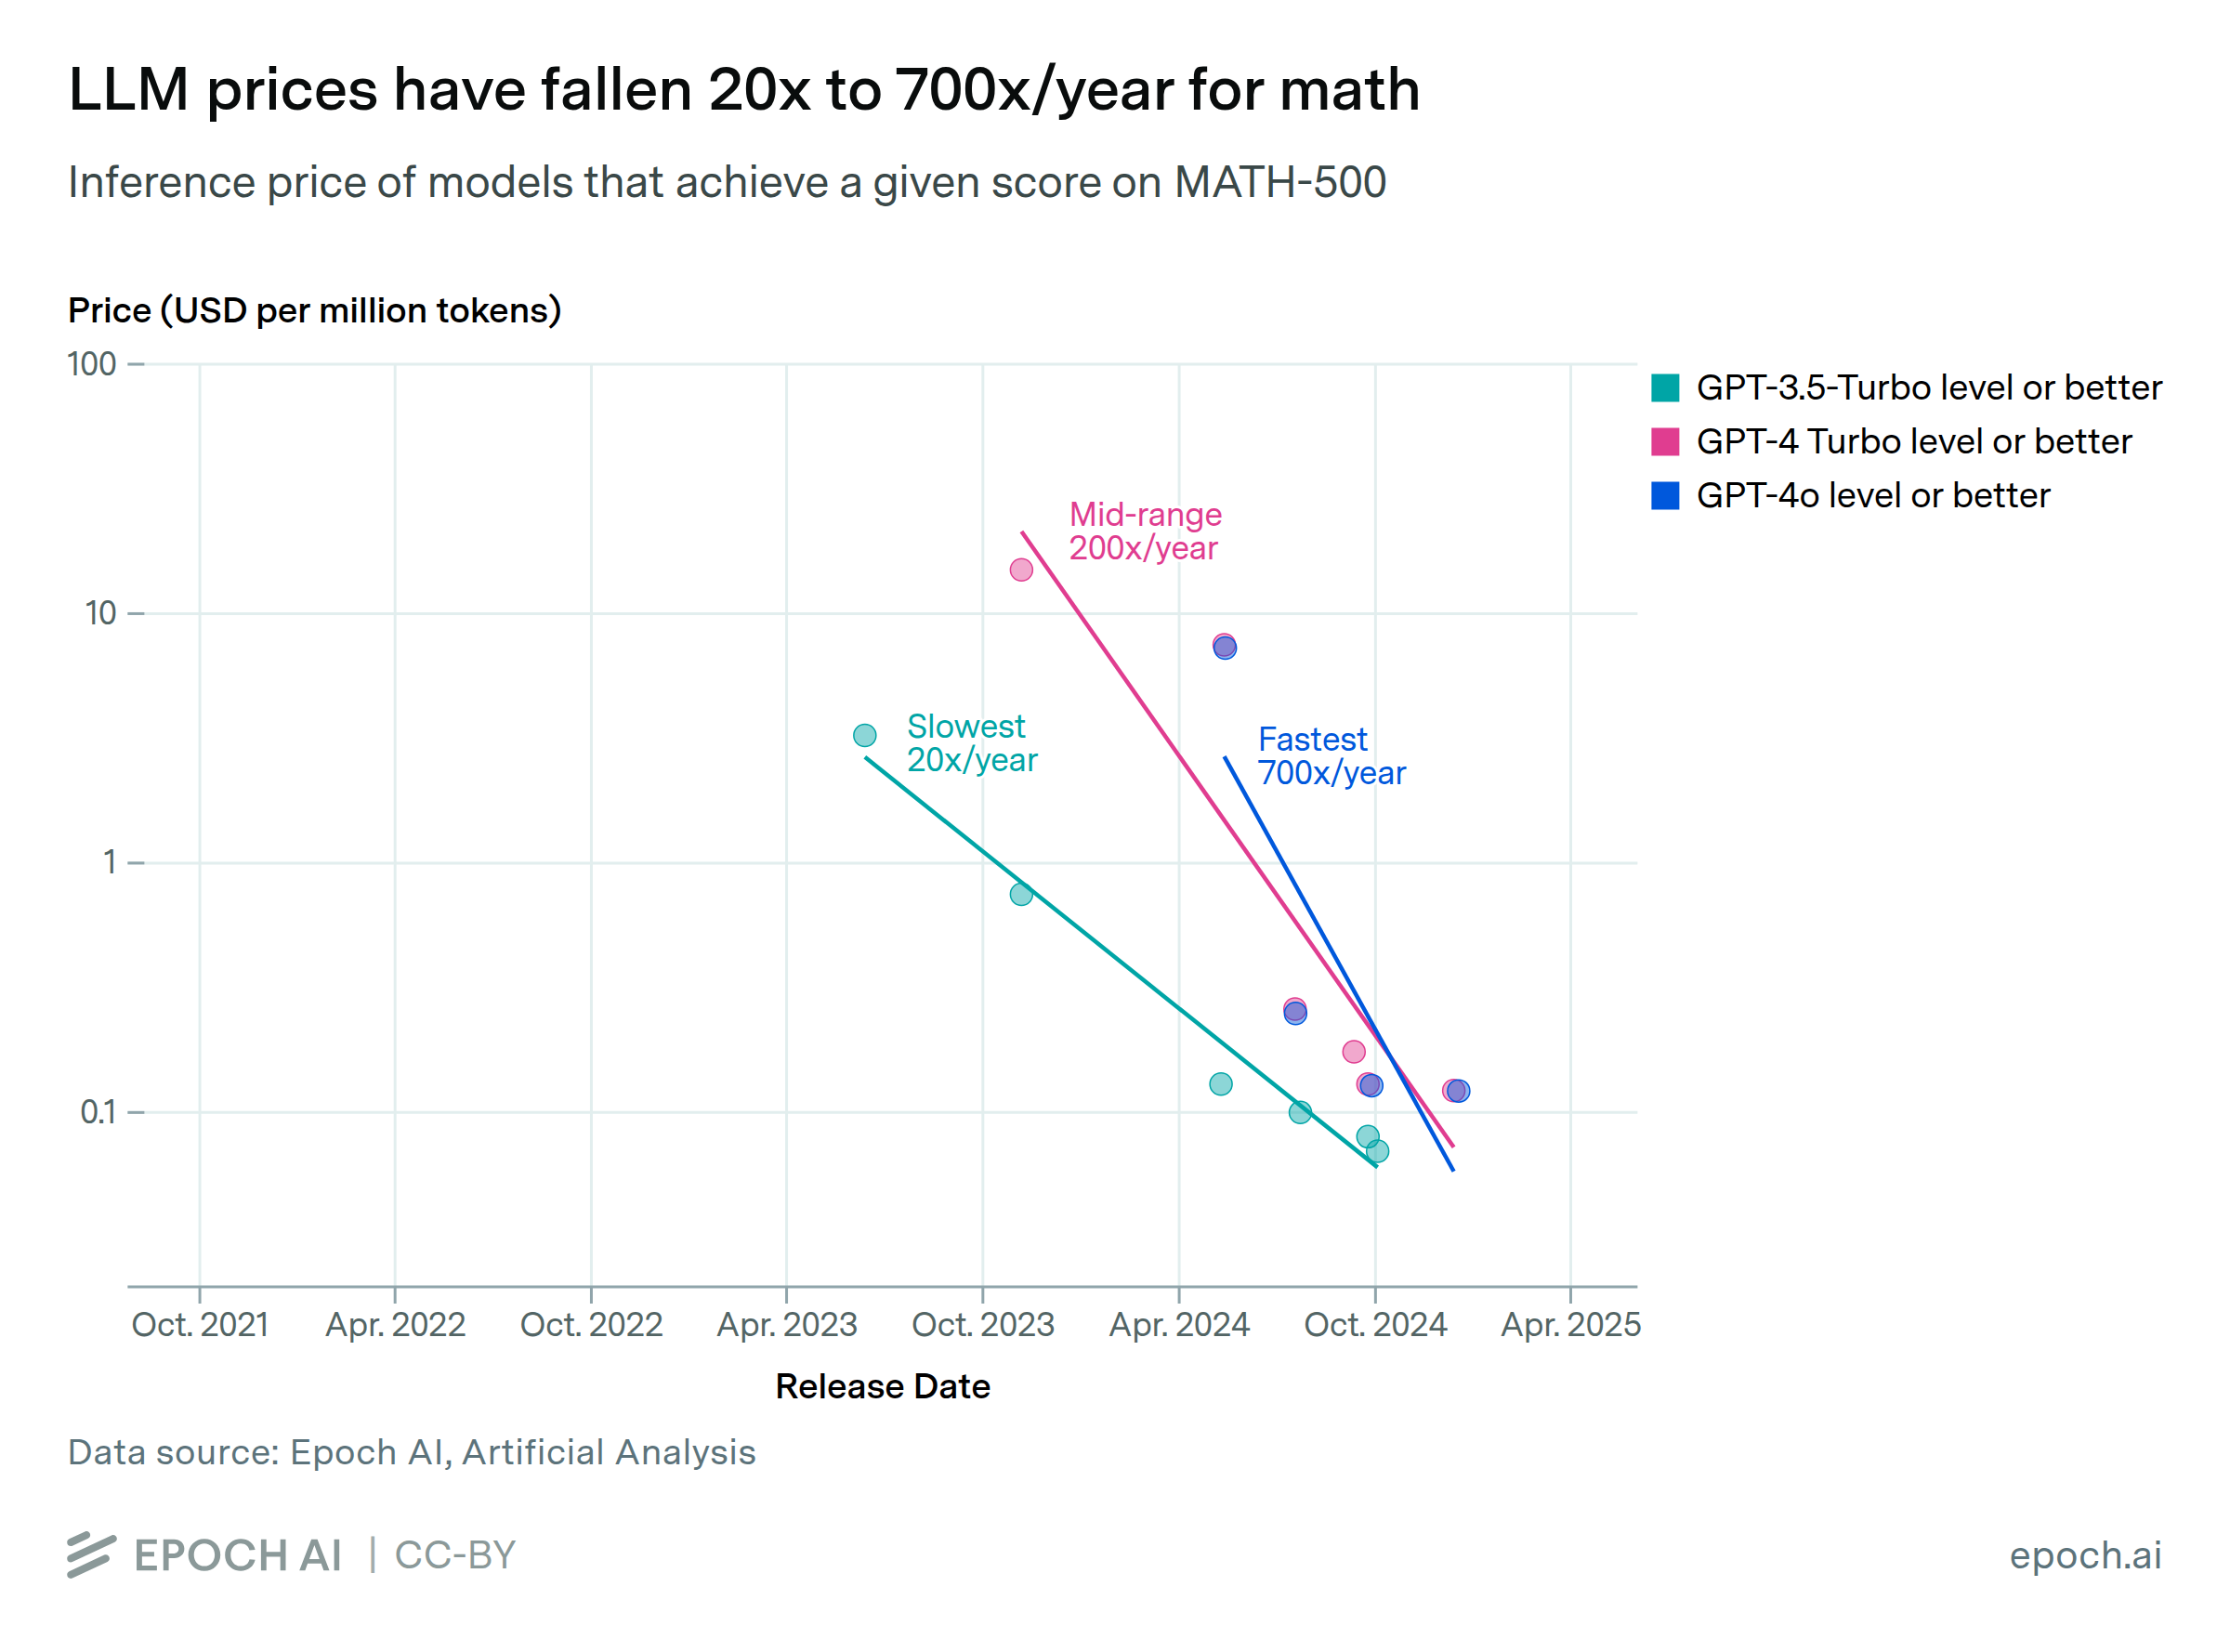
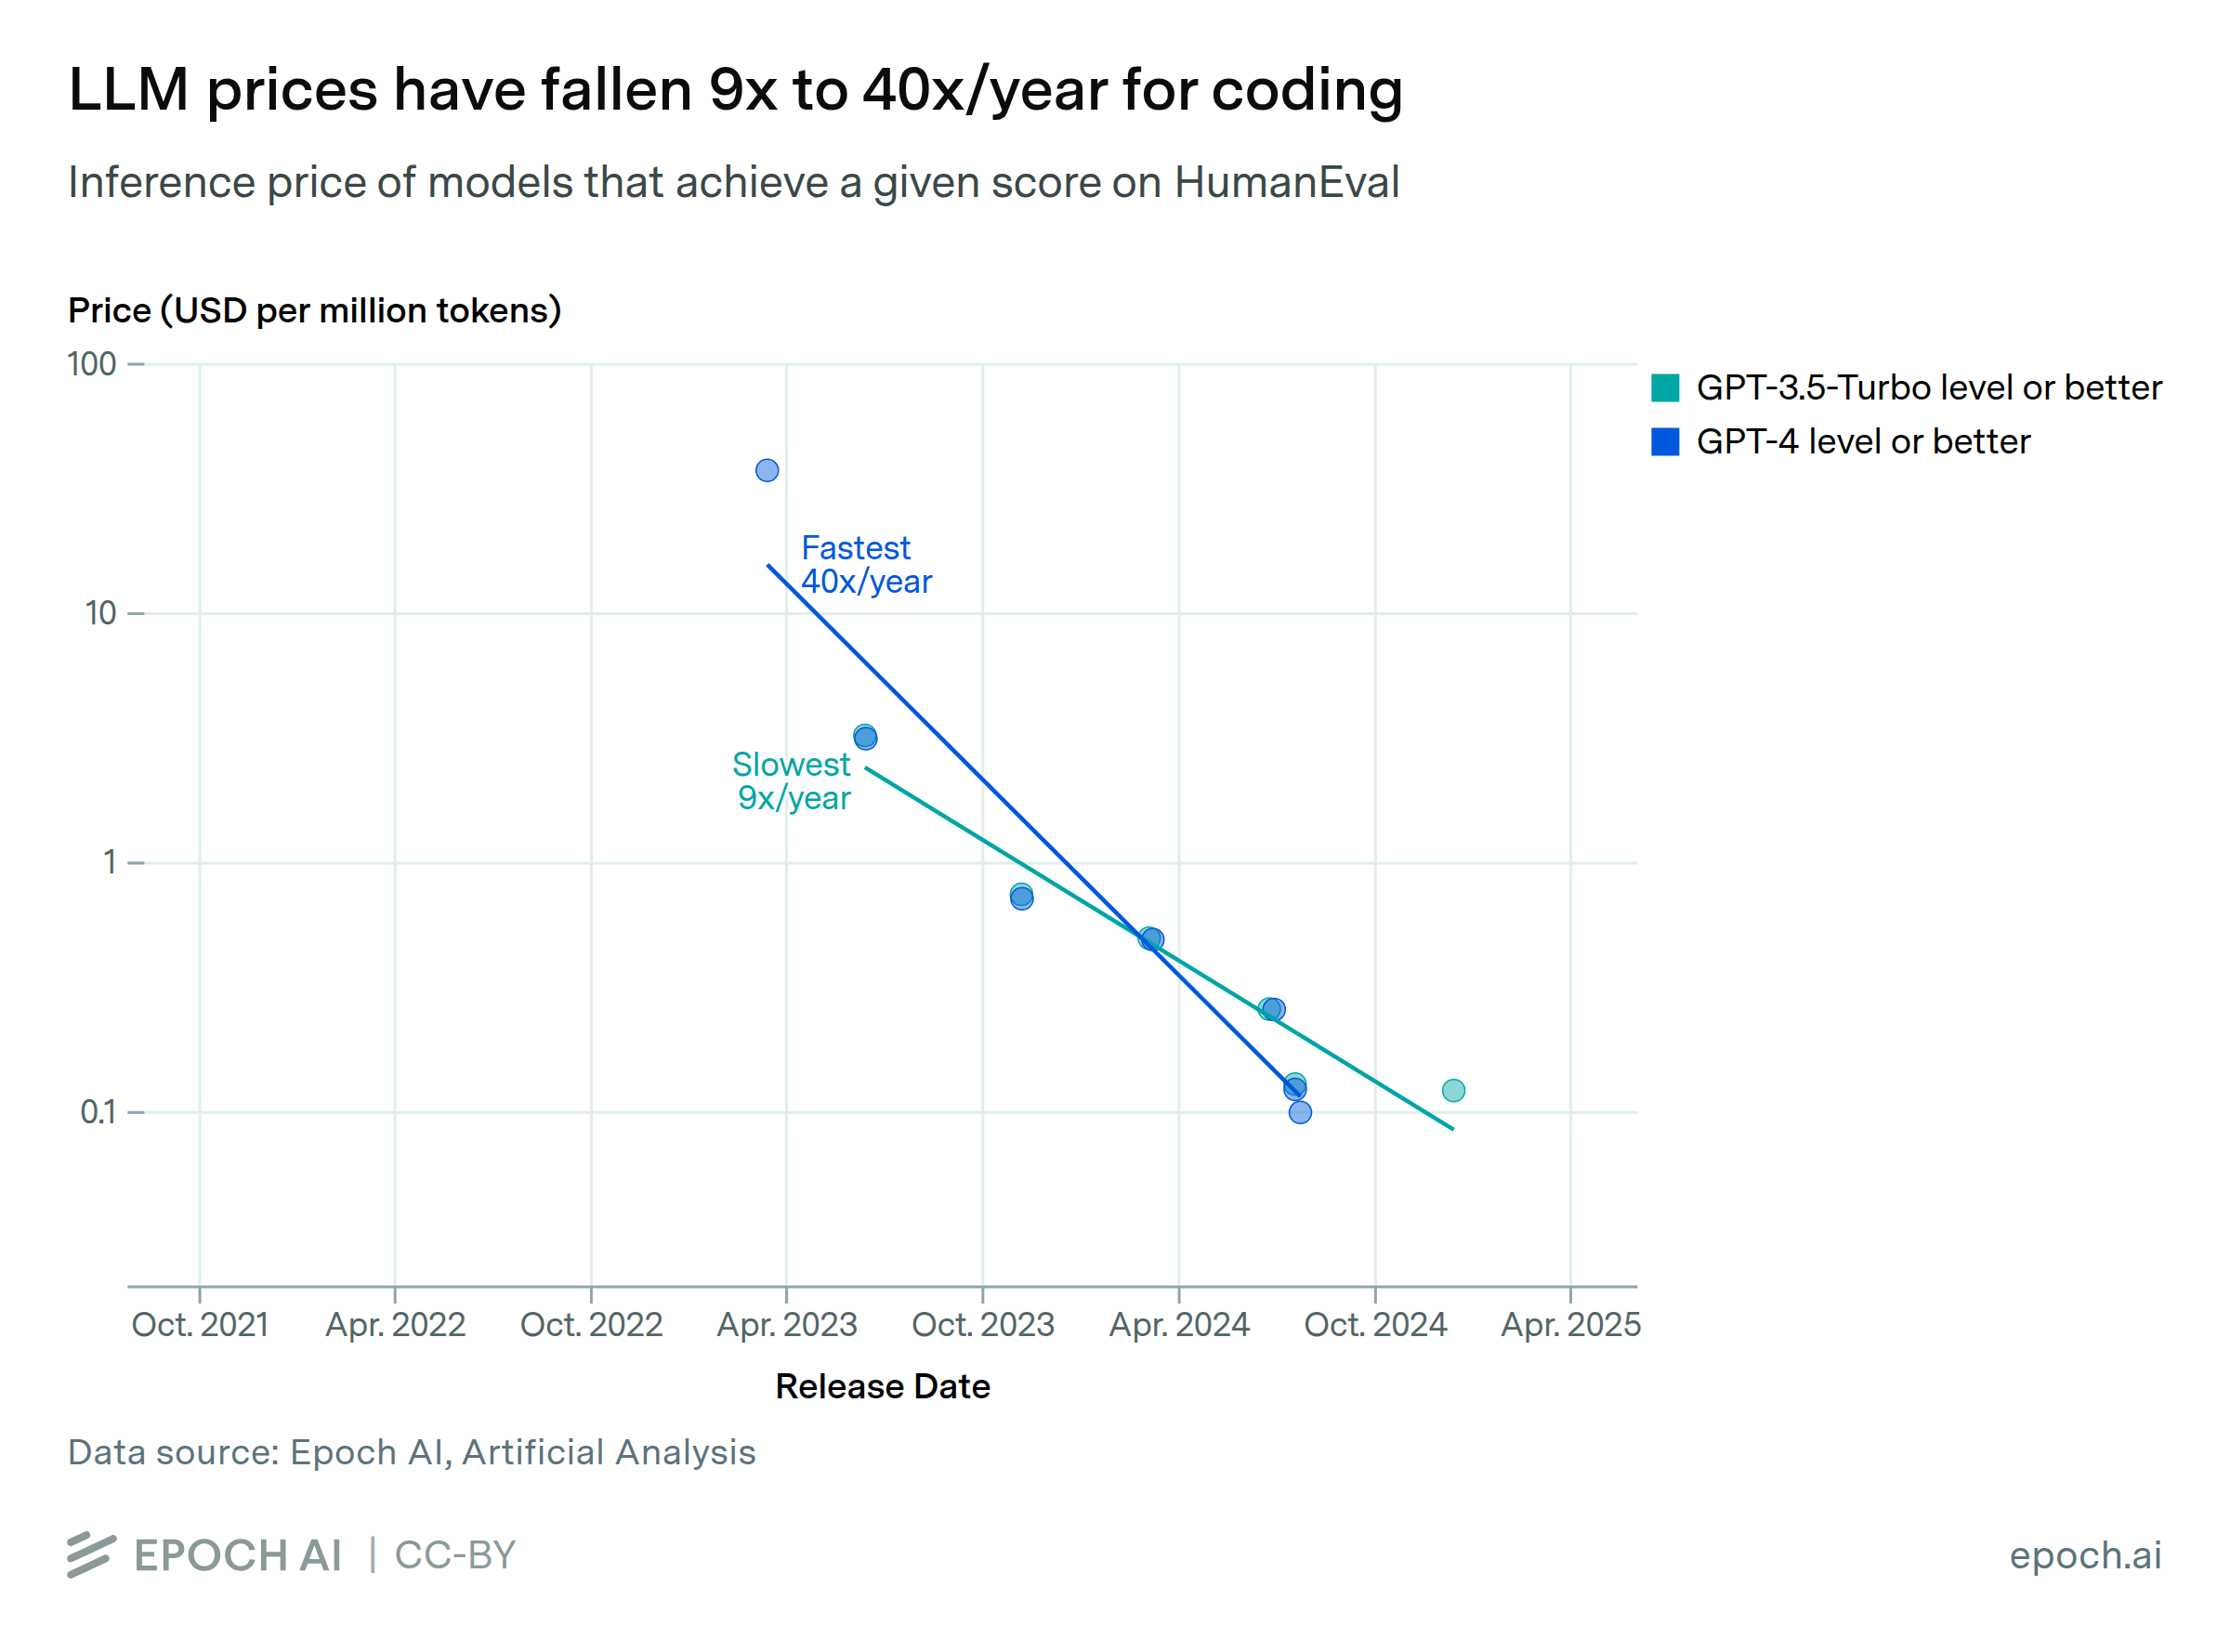
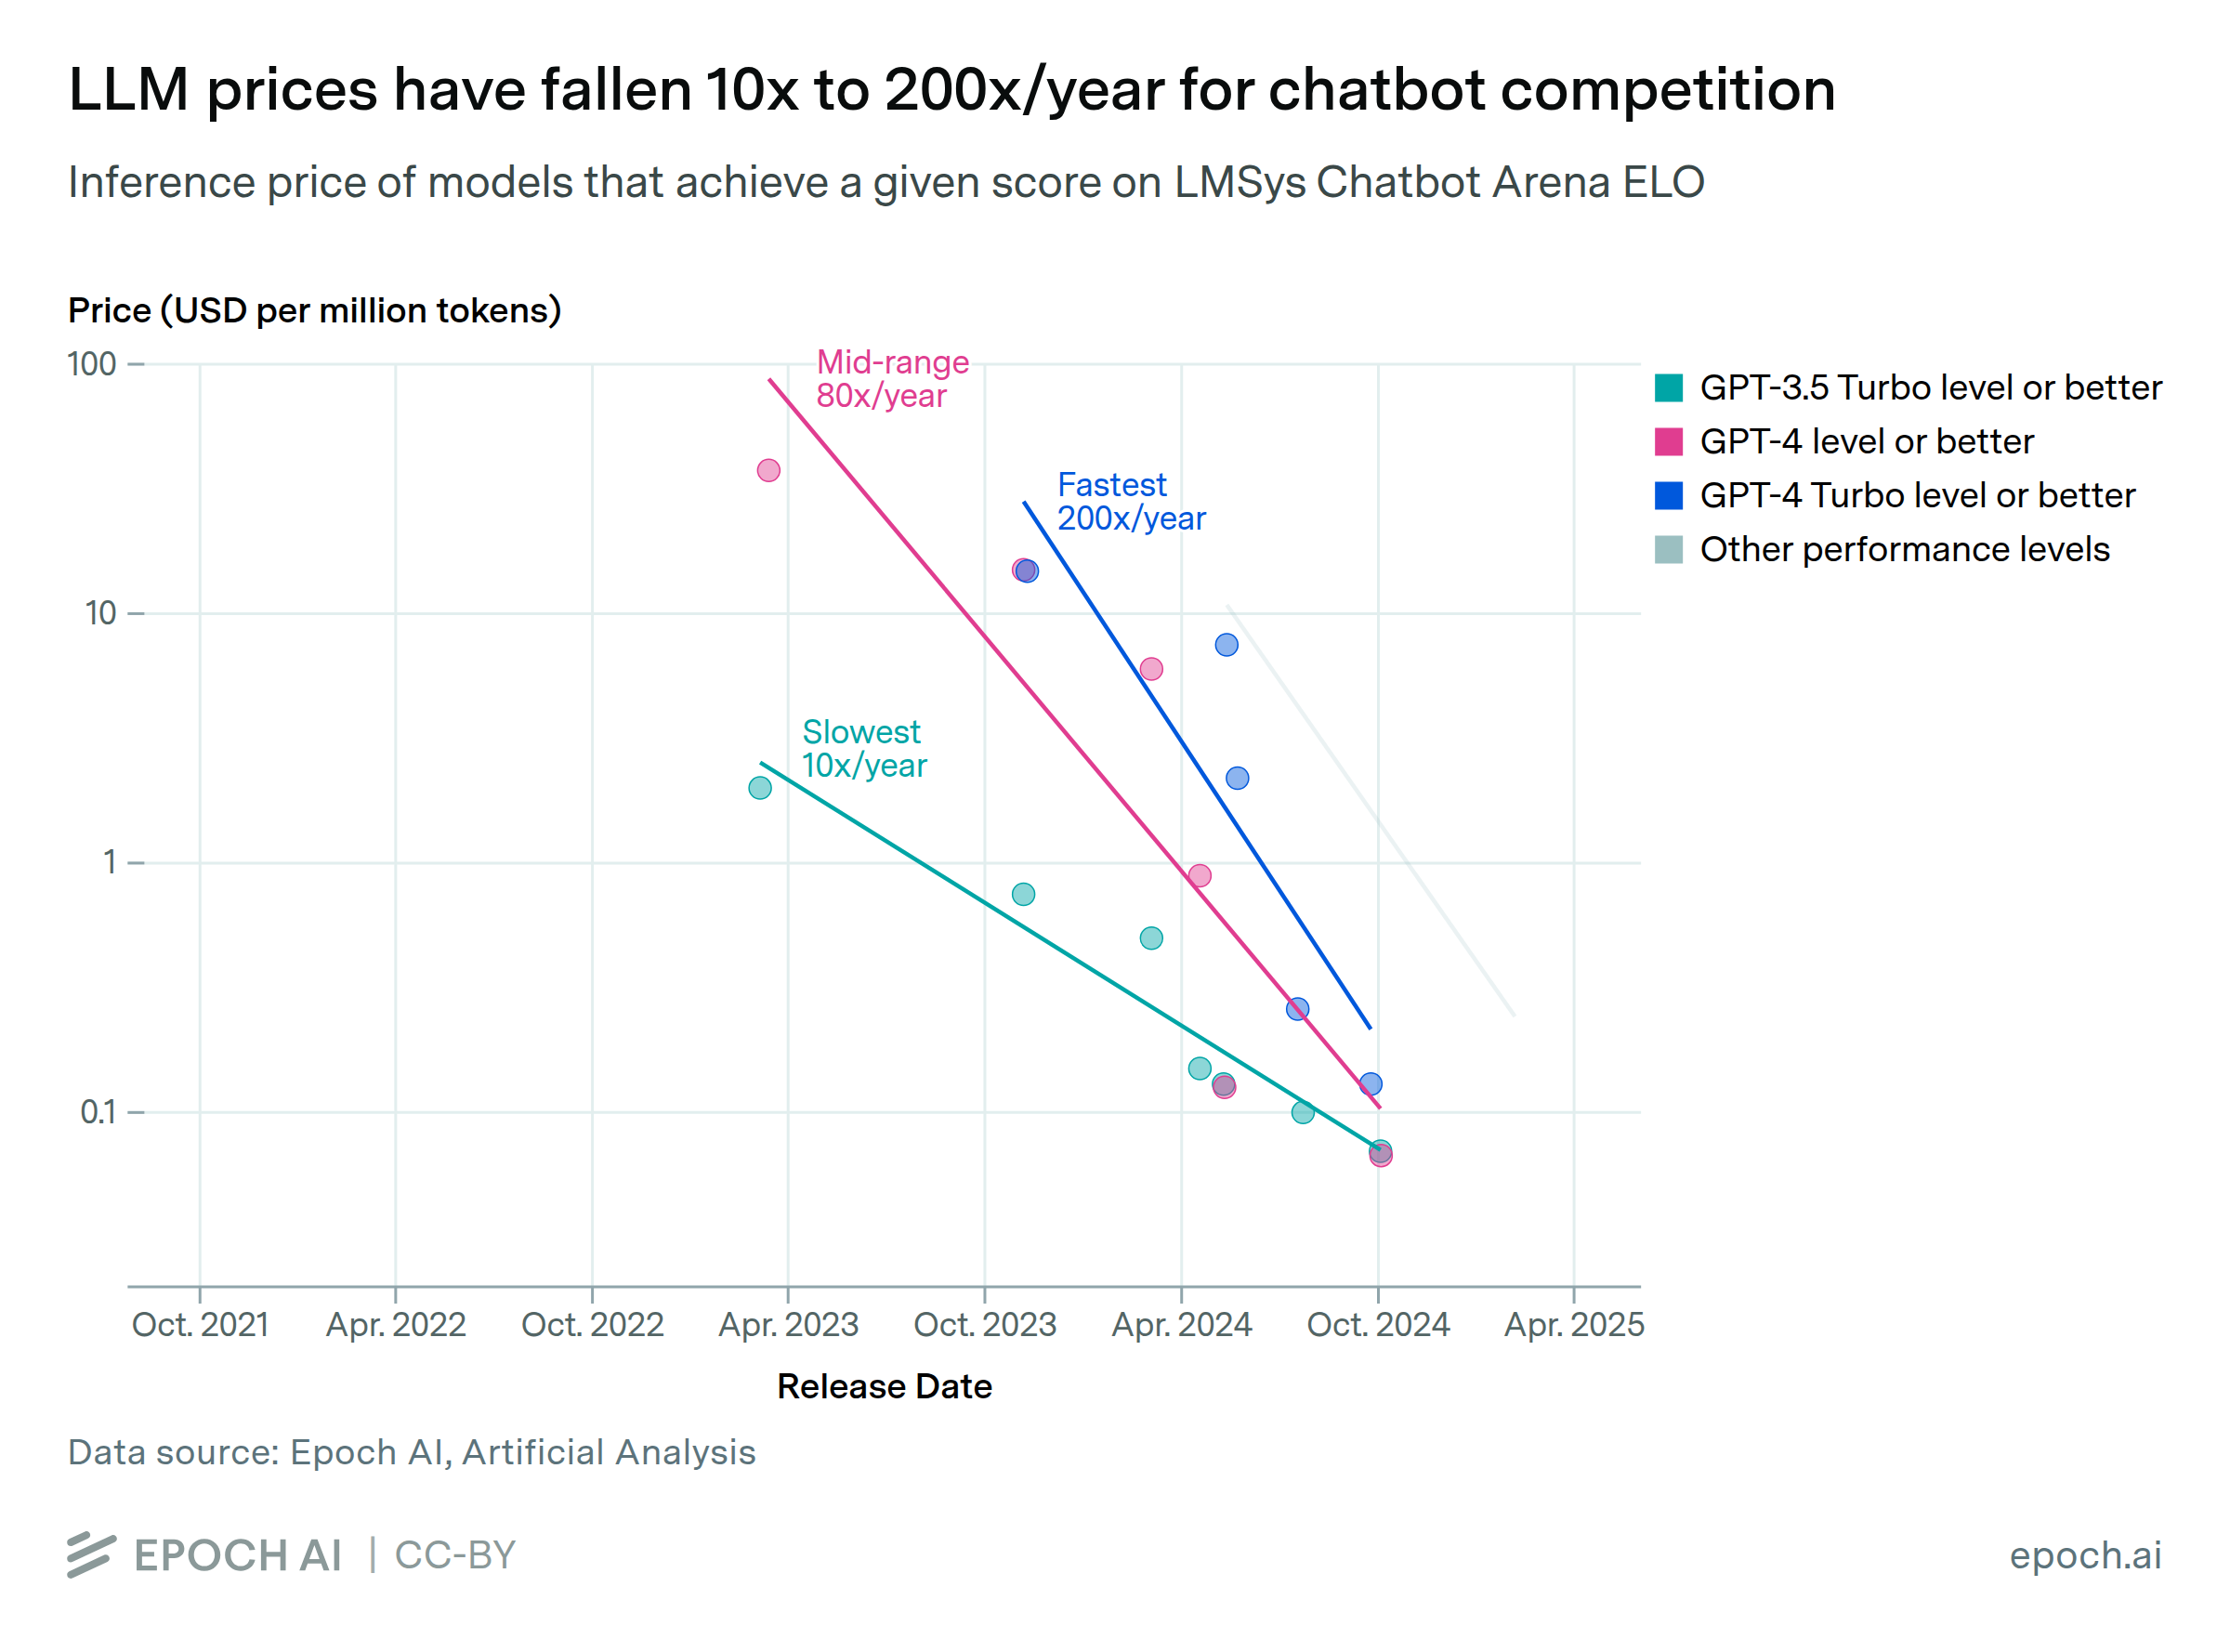
The inference price of LLMs has fallen dramatically in recent years. We looked at the results of state-of-the-art models on six benchmarks over the past three years, and then measured how quickly the price to achieve those milestones has fallen. For instance, the price to achieve GPT-4’s performance on a set of PhD-level science questions fell by 40x per year. The rate of decline varies dramatically depending on the performance milestone, ranging from 9x to 900x per year. The fastest price drops in that range have occurred in the past year, so it’s less clear that those will persist.
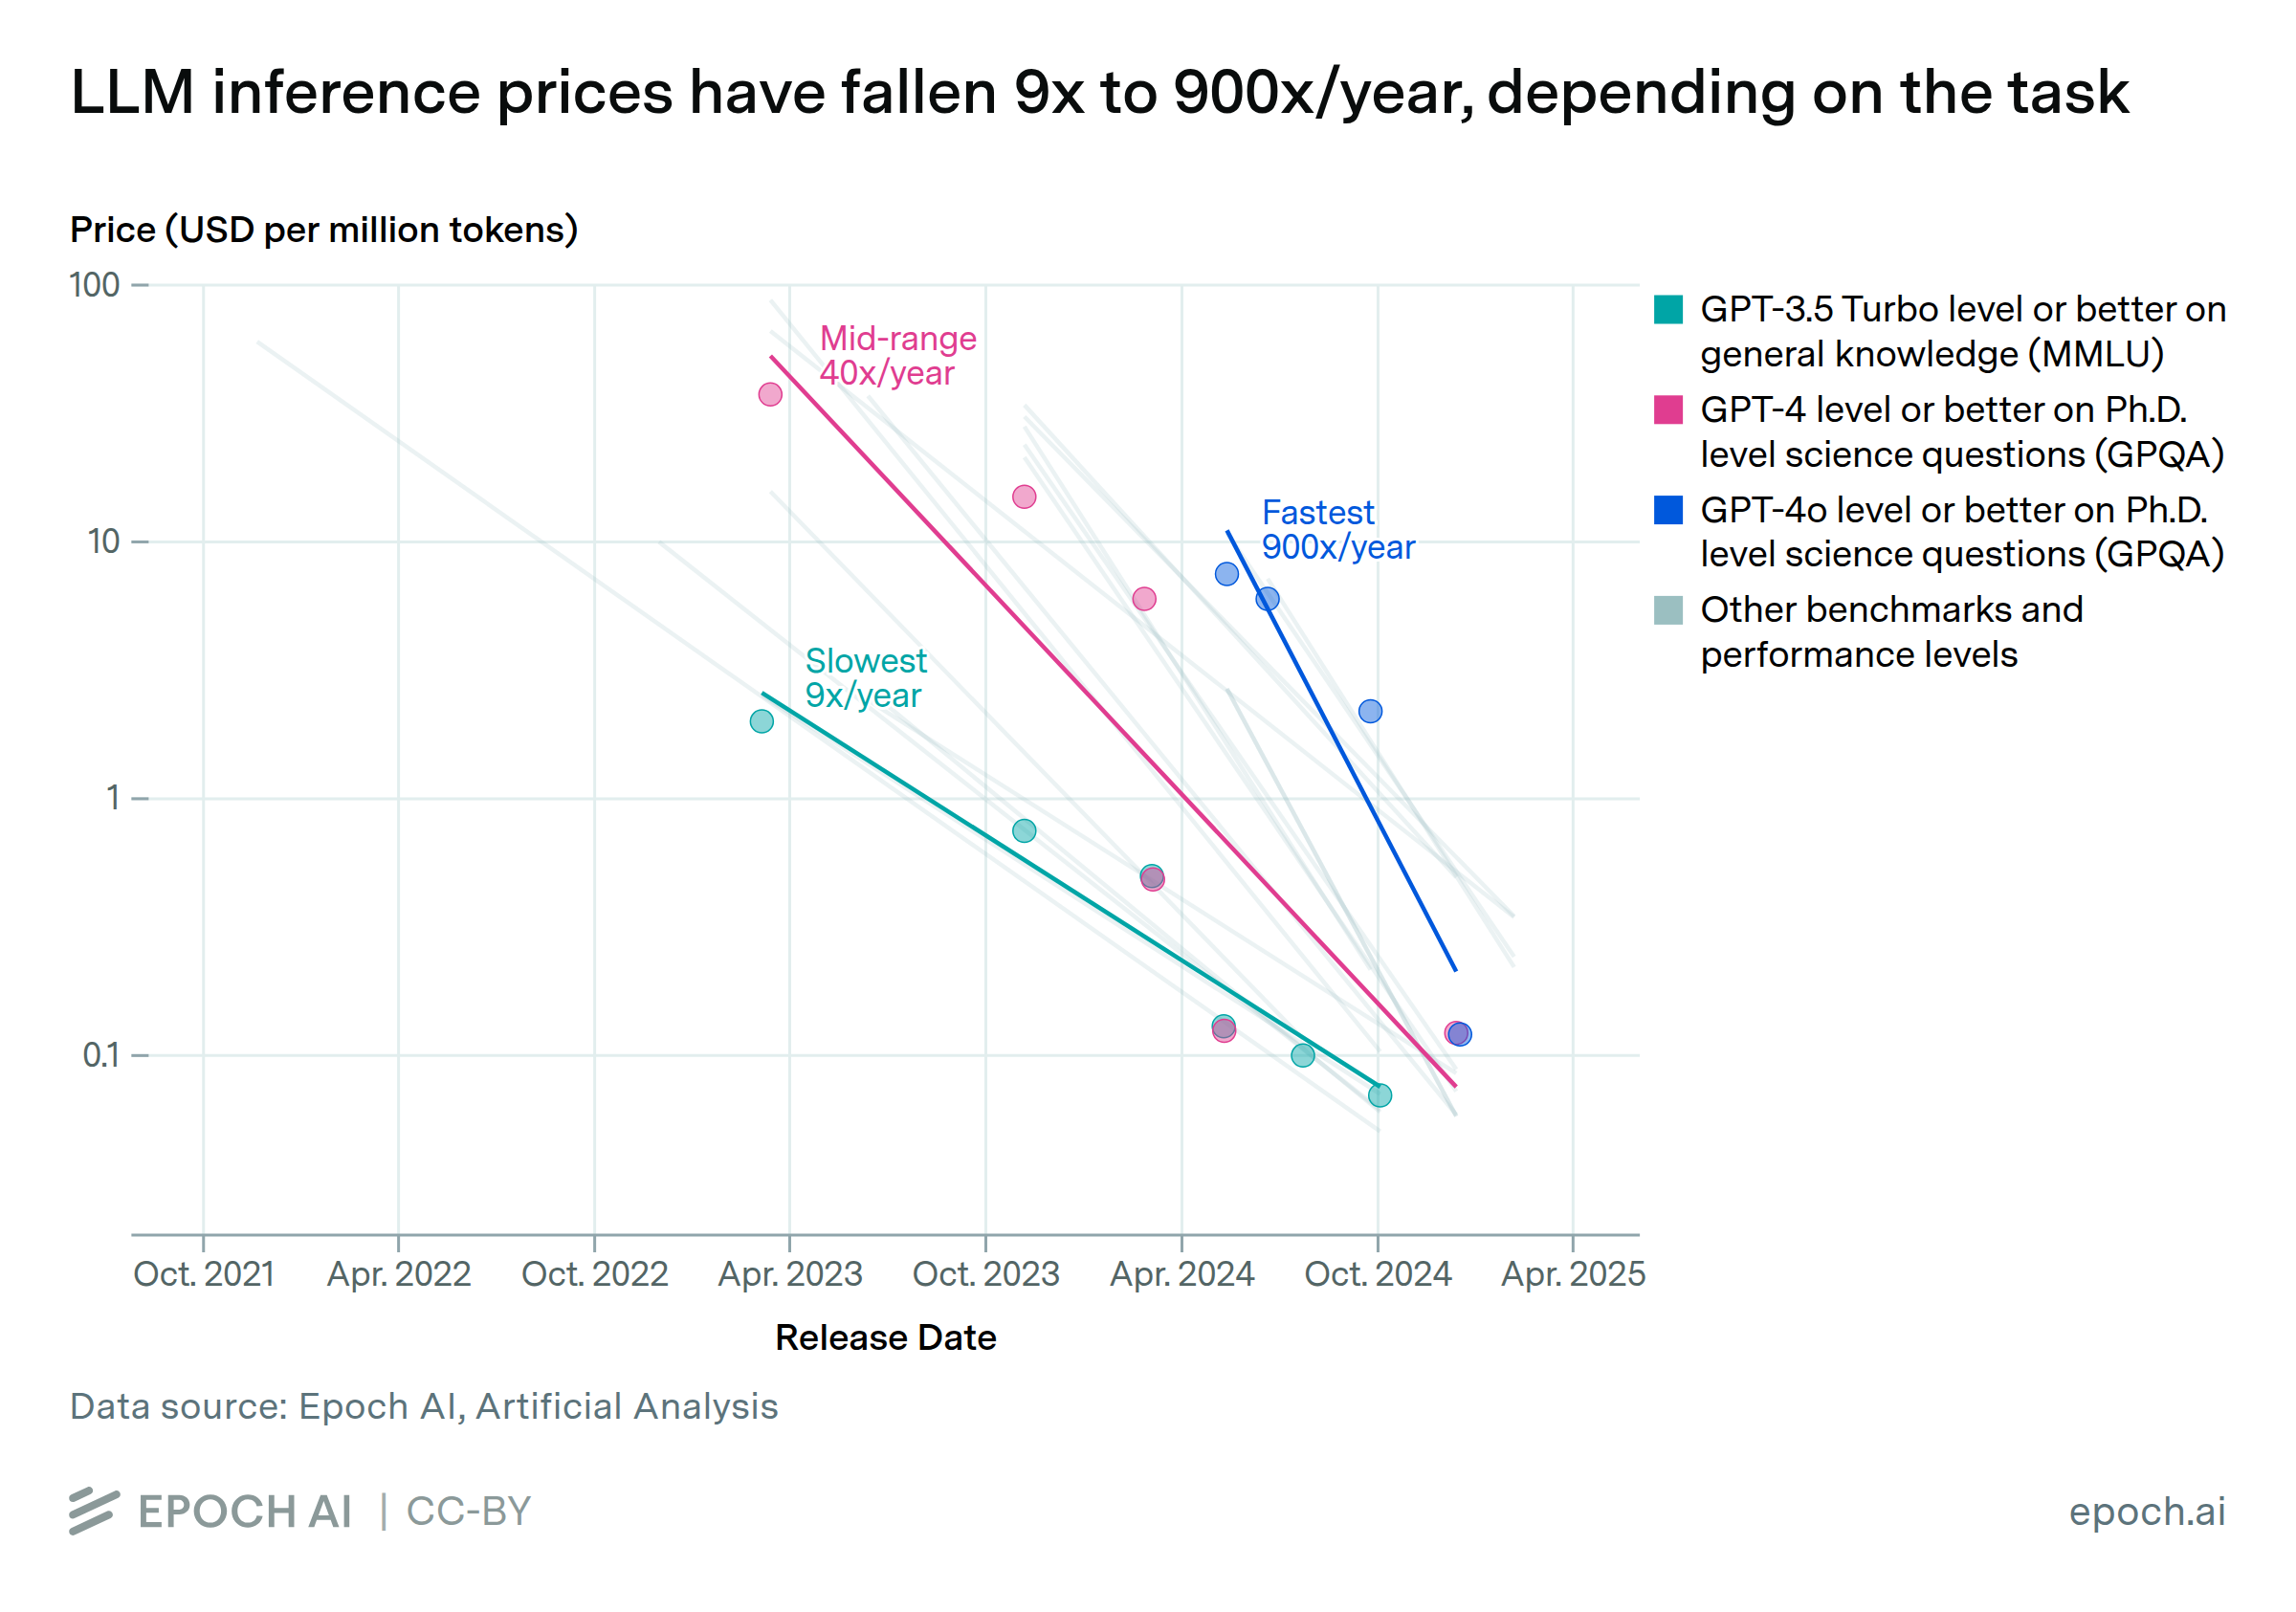
There are many potential reasons for these price drops. Some are well-known, such as models becoming smaller and hardware becoming more cost-effective, while other important factors might be difficult to determine from public information.
Published
March 12, 2025
Last updated
March 12, 2025
Learn more
Overview
The dataset for this insight combines data on large language model (LLM) API prices and benchmark scores from Artificial Analysis and Epoch AI. We used this dataset to identify the lowest-priced LLMs that match or exceed a given score on a benchmark. We then fit a log-linear regression model to the prices of these LLMs over time, to measure the rate of decrease in price. We applied the same method to several benchmarks (e.g. MMLU, HumanEval) and performance thresholds (e.g. GPT-3.5 level, GPT-4o level) to determine the variation across performance metrics.
Note that while the data insight provides some commentary on what factors drive these price drops, we did not explicitly model these factors. Reduced profit margins may explain some of the drops in price, but we didn’t find clear evidence for this.
Code to reproduce our analysis can be found here.
Data
The data on LLM API pricing comes from both Artificial Analysis and our own database of API prices. Our data contributed prices for GPT-3, GPT-3.5 and Llama 2 models, because prices for those models were not publicly available from Artificial Analysis. These prices made up 9 of the 36 unique observations shown in this data insight. If the price of an LLM changed after its initial release, then we recorded that as a unique observation with the same model name, but a new price and “release” date. Where prices differed by their maximum allowed context length, we only included the prices for the shortest context.
We aggregated prices over different LLM API providers and token types according to Artificial Analysis’ methodology, which is as follows. All prices were a 3:1 weighted average of input and output token prices. If the LLM had a first-party API, (e.g. OpenAI for o1), then we used the prices from that API. If a first-party API was not available (e.g. Meta’s Llama models), then we used the median of prices across providers.
We excluded reasoning models from our analysis of per-token prices. Reasoning models tend to generate a much larger number of tokens than other models, making these models cost more in total to evaluate on a benchmark. This makes it misleading to compare reasoning models to other models on price per token, at a given performance level.
The benchmark data covers 6 benchmarks: GPQA Diamond (PhD-level science questions), MMLU (general knowledge), MATH-500 (math problems), MATH level 5 (advanced math problems), HumanEval (coding), and Chatbot Arena Elo (head-to-head comparisons of chatbots, with human judges). Like the price data, the benchmark data is sourced from both Artificial Analysis and our benchmark database. In the combined dataset, most of the benchmark scores are as reported by Artificial Analysis. The methodology to obtain those scores is described by Artificial Analysis (except we use MMLU rather than MMLU-Pro).
We used data from our own evaluations for MATH level 5 (a benchmark not reported by Artificial Analysis), and for cases where Artificial Analysis did not have scores for GPQA Diamond. For other benchmarks where Artificial Analysis had missing scores, we used scores from Papers with Code or scores reported by the developer of the model. Our methodology for MATH level 5 and GPQA Diamond evaluations is described here. For the GPT-4-0314 model, direct evaluation on GPQA Diamond was unavailable. However, we know that GPT-4-0613 performed similarly to GPT-4-0314 across many other benchmarks (see here, p.5). Based on that, we assumed that GPT-4-0314 had the same GPQA Diamond score as GPT-4-0613.
Analysis
To analyze the decline in LLM prices over time, we focused on the most cost-effective LLMs above a certain performance threshold at each point in time. To identify these models, we iterated through models sorted by release date. In each iteration, we added a model to the set of cheapest models if it had a lower price than all previous models that scored at or above the threshold.
After identifying the cheapest models, we fit a log-linear regression to price vs. release date. We used a log-linear model because it had a much lower Bayesian Information Criterion than a linear model. The slope of the log-linear model corresponds to a price reduction over time, e.g. 40x per year. We set a threshold of at least 4 data points to include a regression result.
We applied the above method to all of the benchmarks and performance thresholds. For each benchmark, we identified instances where a new model achieved a better performance than all previous models, and used these instances as our performance thresholds. Across all of these benchmarks and performance thresholds, we found prices declining between 9x per year and 900x per year, with a median of 50x per year. Note that the “mid-range” value in the figure is close to the median of the trends that are shown, but is not always the exact median, for the sake of visual clarity.
In addition to measuring the rates that prices have fallen, we analyzed how the rate relates to the time period it occurred in. We found that the fastest trends (e.g. 900x per year) start after January 2024. When we removed all model data before January 2024 (after selecting the lowest-price models), the rates also increased overall—even at performance levels that were achieved before 2024. In particular, the median rate increased from 50x per year to 200x per year. This suggests that the fastest trends are caused by a recent acceleration in price drops across performance levels and benchmarks.
Assumptions
There is the potential for significant variation in the number of tokens that models generate to achieve their benchmark score, which could mean that trends in price per token differ from trends in evaluation cost. However, our investigations found that evaluation costs have declined similarly to prices per token. We used Epoch AI benchmark evaluation results for this analysis, as these report the number of tokens processed for each evaluation. For the six cost trends we estimated, the largest difference was 200x per year for evaluation cost vs. 400x per year for price per token, for Claude-3.5-Sonnet-2024-06 level performance on GPQA Diamond.
We relied on benchmarks to measure an AI model’s performance, which leads to several limitations. Firstly, benchmarks do not comprehensively measure a model’s usefulness: there are important capabilities besides knowledge and reasoning, and other important features like output speed.
Another limitation of benchmark scores is that AI models can be overfit to these benchmarks. AI developers may accidentally train models on benchmark data, or use knowledge about the benchmark to inform training (which seems to have become more common since 2024). These practices may drive up benchmark scores without generalizing.
Benchmark evaluations can also differ due to randomness in model outputs and variations in prompting. There were 33 evaluations on GPQA Diamond that overlapped between Artificial Analysis and our benchmark database. The mean absolute difference between scores from the two evaluations was 2.9 percentage points, with a standard deviation of 1.7 and an average signed difference of 0.1. This is within expectations, since the standard error on our GPQA Diamond scores is generally around 3 percentage points, and variance is further increased by subtle differences in prompting and scoring.
We also relied on our dataset having good enough model coverage to accurately measure trends in prices. There may be models not in our dataset that were more cost-effective than the “cheapest models” we selected. However, it’s unlikely that such models would greatly alter the observed trends, since the cheapest models at a given performance level are more likely to be well-known, and therefore captured in our dataset.
Explore this data

Data on Notable AI Models
Epoch AI's database contains over 900 notable ML models and 400 training compute estimates, offering a detailed exploration of trends in AI development.
Updated June 19, 2024

Data on Machine Learning Hardware
We present key data on over 150 AI accelerators, such as graphics processing units (GPUs) and tensor processing units (TPUs), used to develop and deploy machine learning models in the deep learning era.
Updated October 23, 2024