
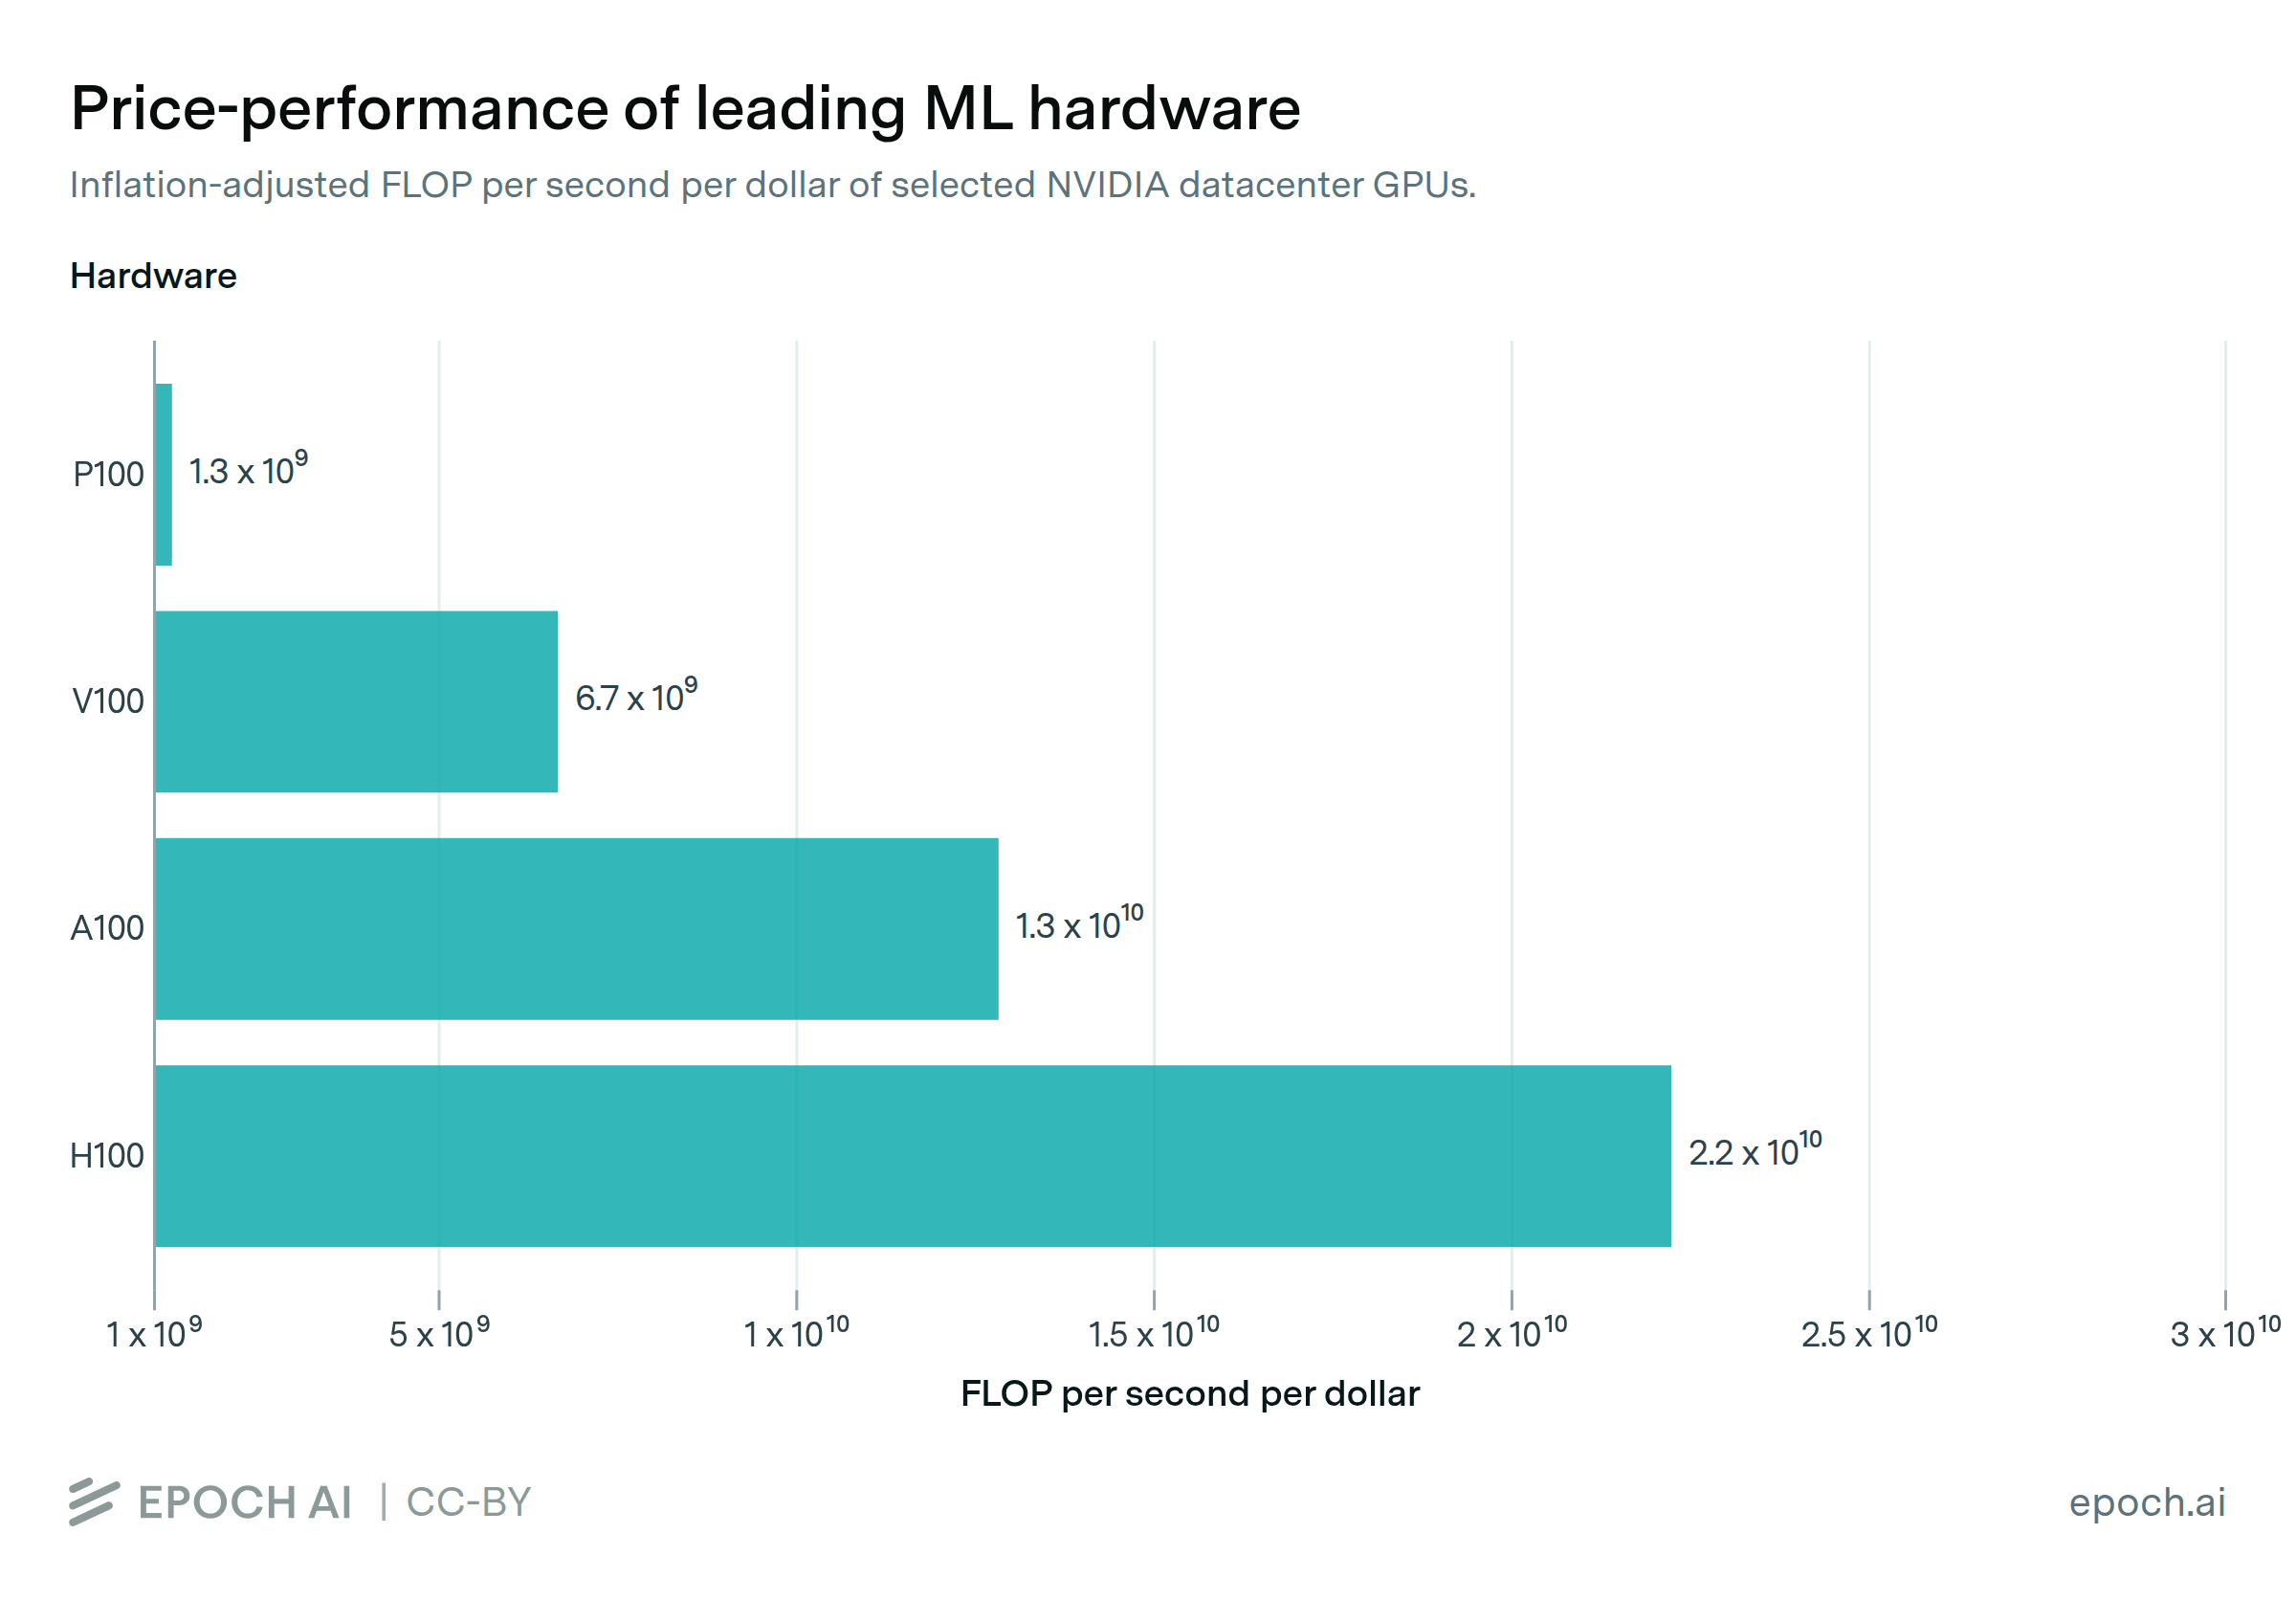
Performance per dollar has improved rapidly, and hardware at any given precision and fixed performance level becomes 30% cheaper each year. At the same time, manufacturers continue to introduce more powerful and expensive hardware.
| Hardware | Release price including server hardware (USD) | Inflation-adjusted release price (2022 USD) | Perfromance (FLOP/s) | FLOP/s per dollar (inflation-adjusted) |
|---|---|---|---|---|
| P100 | $16,000 | ≈$15,000 | 2 x 10^13 (FP16) | 1.3 x 10^9 |
| V100 | $20,000 | ≈$19,000 | 1 x 10^14 (TF32) | 6.7 x 10^9 |
| A100 | $25,000 | ≈$24,000 | 3 x 10^14 (TF32/FP16) | 1.3 x 10^10 |
| H100 | $44,000 | ≈$44,000 | 1 x 10^15 (TF16) | 2.2 x 10^10 |
Epoch's work is free to use, distribute, and reproduce provided the source and authors are credited under the Creative Commons BY license.
Learn more about this graph
In order to provide an apples-to-apples comparison of the performance of leading hardware, and determine the real rate of improvement over time, we show the prices of each GPU including its accompanying server hardware, and adjust for inflation.
Analysis
Nominal release prices shown are calculated by including all costs of a DGX server node with eight GPUs (as of the GPU’s release date), and dividing by eight. This accounts for server and interconnect hardware costs.
Prices are normalized to the release date of the H100 to determine the performance improvement rate in real prices. Inflation adjustment is performed using the data industry producer price index published by the Federal Reserve Bank of St Louis. The nominal prices are divided by the value of the price index as of the release date of each GPU, and then multiplied by the price index in October 2022, when the H100 was released.
The inflation-adjusted prices are then used to calculate the rate of improvement in performance per dollar of leading data center hardware.
Download this data
Explore this data

Key data on over 180 AI accelerators, such as graphics processing units (GPUs) and tensor processing units (TPUs).