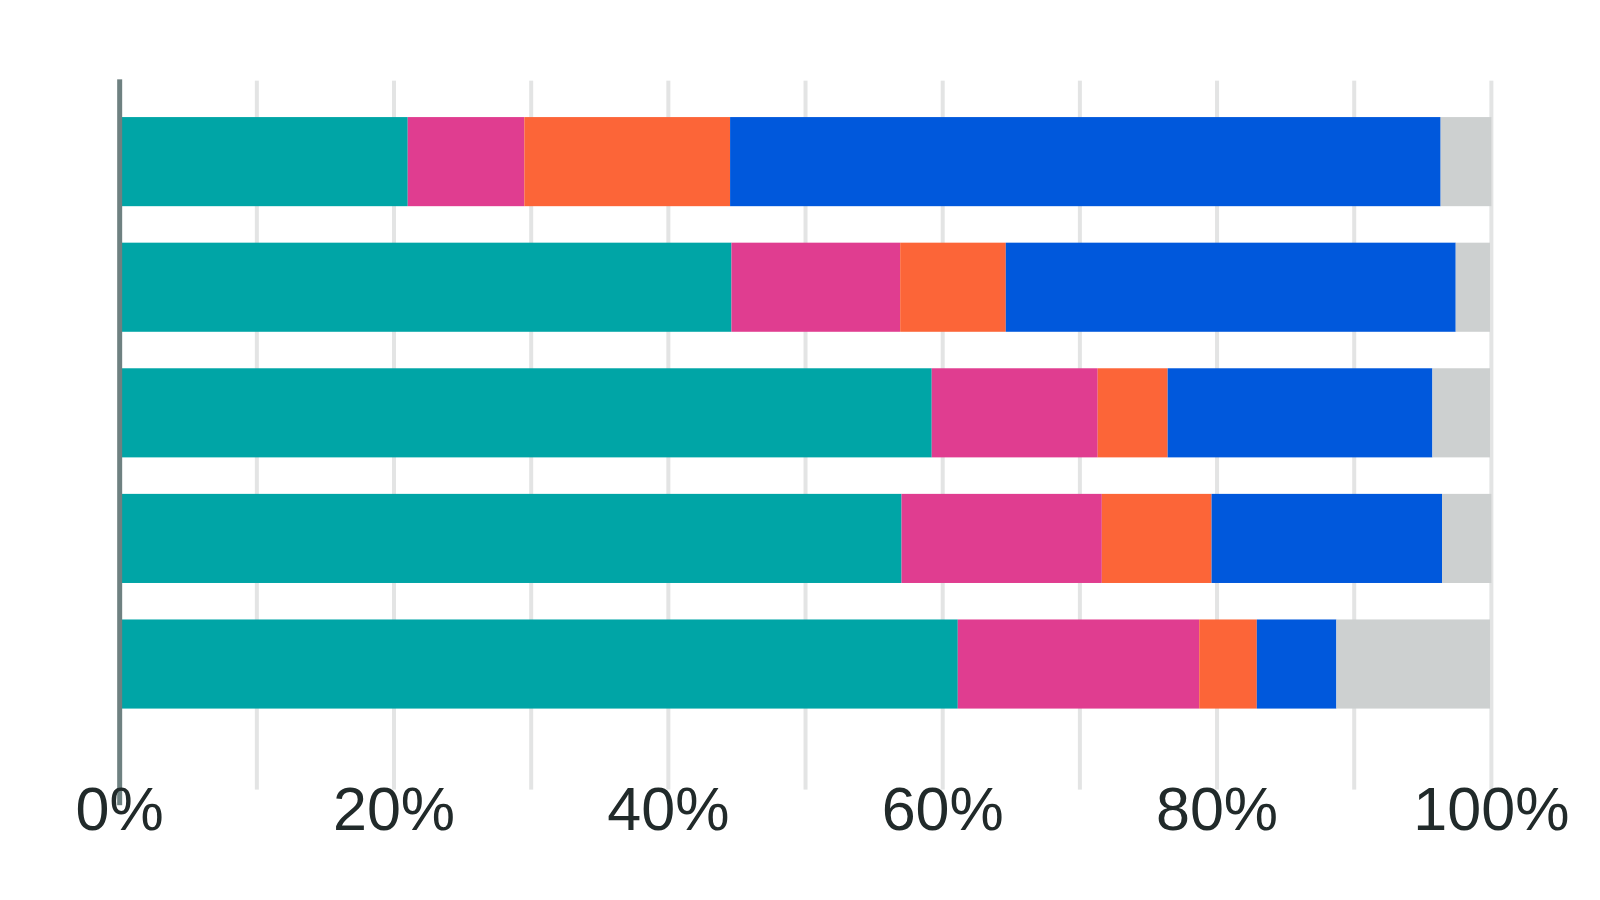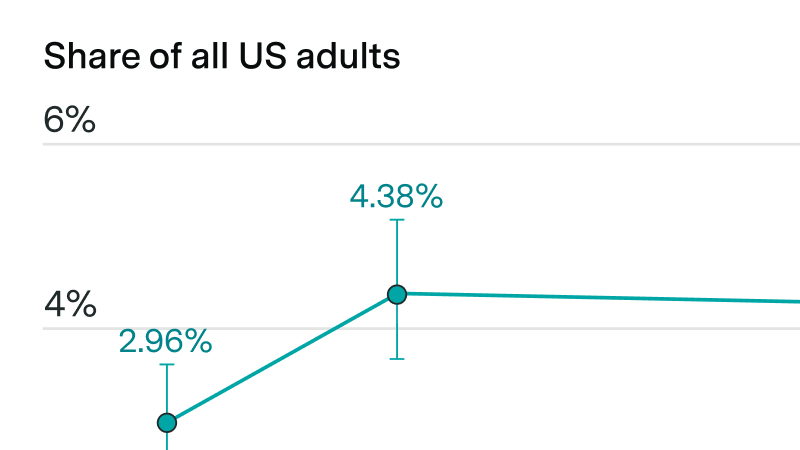


Polling by Epoch AI and Ipsos finds the share of US adults who reported using AI at least 6 days in the previous week more than doubled from March to August 2026, rising from 8% to 19%. Over the same period, the share of US adults who reported using AI just one day in the previous week fell from 17% to 10%.
| Survey wave | Field dates | Days of AI use in past week | Share of US adults (%) | 90% CI lower bound (%) | 90% CI upper bound (%) | Respondents (unweighted) | AI users (unweighted) |
|---|---|---|---|---|---|---|---|
| March 2026 | March 3-5, 2026 | Any AI use | 50.0 | 48.2 | 51.9 | 2,017 | 1,028 |
| March 2026 | March 3-5, 2026 | 1 day | 17.3 | 15.9 | 18.7 | 2,017 | 1,028 |
| March 2026 | March 3-5, 2026 | 2-5 days | 24.3 | 22.8 | 25.9 | 2,017 | 1,028 |
| March 2026 | March 3-5, 2026 | 6-7 days | 8.2 | 7.2 | 9.3 | 2,017 | 1,028 |
| March 2026 | March 3-5, 2026 | Days not reported | 0.2 | 0.1 | 0.5 | 2,017 | 1,028 |
| March 2026 | March 3-5, 2026 | No AI use | 50.0 | 48.1 | 51.8 | 2,017 | 1,028 |
| August 2026 | August 28-30, 2026 | Any AI use | 56.4 | 53.8 | 59.0 | 1,016 | 574 |
| August 2026 | August 28-30, 2026 | 1 day | 10.1 | 8.6 | 11.8 | 1,016 | 574 |
| August 2026 | August 28-30, 2026 | 2-5 days | 27.3 | 25.1 | 29.7 | 1,016 | 574 |
| August 2026 | August 28-30, 2026 | 6-7 days | 18.7 | 16.7 | 20.8 | 1,016 | 574 |
| August 2026 | August 28-30, 2026 | Days not reported | 0.3 | 0.1 | 0.8 | 1,016 | 574 |
| August 2026 | August 28-30, 2026 | No AI use | 43.6 | 41.0 | 46.2 | 1,016 | 574 |

Results are based on two Epoch AI/Ipsos surveys of US adults, fielded March 3–5, 2026 (n=2,017) and August 28–30, 2026 (n=1,016). Respondents were recruited at random, and estimates are weighted to be representative of US adults.
Epoch's work is free to use, distribute, and reproduce provided the source and authors are credited under the Creative Commons BY license.
Learn more about this graph
This analysis examines weekly AI use among US adults between March and August 2026. For each survey wave, we computed the share of respondents who used an AI service in the past week and grouped that share by days of use. The groups are 1 day, 2–5 days, and 6–7 days. All shares are percentages of all US adults rather than of AI users. Within each wave, the three groups and non-users therefore sum to 100%.
The two waves measured days of use differently. March asked a single overall question whose response options were these three groups, while August asked day counts for each service separately, which we collapsed into the same groups.
Data
Responses come from two Epoch AI surveys fielded on Ipsos’ KnowledgePanel, a probability-based online panel.
The March survey was fielded from March 3 to 5, 2026 and covered 2,017 US adults. Respondents were asked which AI services they had used in the past week. Those who reported using at least one service were asked on how many days they used an AI service, with the response options “Once (1 day)”, “2–5 days”, and “Nearly every day (6–7 days)”.
The August survey was fielded from August 28 to 30, 2026 and covered 1,016 US adults. Respondents were first asked which AI services they had used in the past 7 days. Then, for each service selected, they were asked on how many of those 7 days they used it. The response options were 1–7.
Before the analysis, we remove respondents who fail our attention check. The sample sizes above reflect this removal.
Analysis
For both surveys, we count a respondent as a weekly AI user if they selected at least one AI service on the question regarding AI service use in the past week. Respondents who skipped that question are counted as non-users.
For the March survey, the number of days of AI use is taken directly from the three response options mentioned above. Since the August question asks about days of use by each service and not just in aggregate, we create a comparable measure to the March survey’s three buckets. To do so, we take the maximum number of days across the respondent’s services and group it into the same three buckets. AI users who did not answer the days question, 4 in March and 3 in August, are classified as “Days not reported”, and not shown in the graph. For each survey, we compute the weighted share of respondents in each of these buckets.
All estimates are weighted to represent US adults aged 18 and over. We report 90% Wilson confidence intervals for each estimate computed on Kish’s effective sample size to account for unequal weighting.
Assumptions and limitations
Each wave surveys a fresh sample of respondents rather than tracking the same individuals, so the results reflect population-level changes rather than changes within the same people.
The days of use question changed between waves, in two ways. First, March asked about AI use overall while August asked about each service separately, and we take the maximum across services. A respondent who used one service on three days and another on three different days is counted at 3 days rather than 6, so August’s figures may understate frequency relative to an overall-use question. Second, the scales differ. March offered three broad bands, while August asked for an exact count from 1 to 7. An exact count requires respondents to recall each day of the week and may encourage rounding to salient values such as 5 or 7, whereas broad bands ask only for a rough placement. Being asked once per service also prompts respondents to think about their usage more than once, which may improve recall or inflate counts. For these reasons, comparisons of frequency across the two waves are approximate.
The AI service lists differed slightly between waves. March listed DeepSeek and Character.AI, which August dropped, and August described Meta AI with examples of where it appears, such as WhatsApp and Instagram. Both lists included an “Other” option, so these changes should have little effect on the share using any AI service.
As with all surveys, non-respondents may differ from respondents in ways that the weighting does not correct for. Usage is self-reported and may be affected by recall error or misclassification.
Download this data
Explore this data
Tracking how employed Americans use AI at work, across demographics.
Related insights