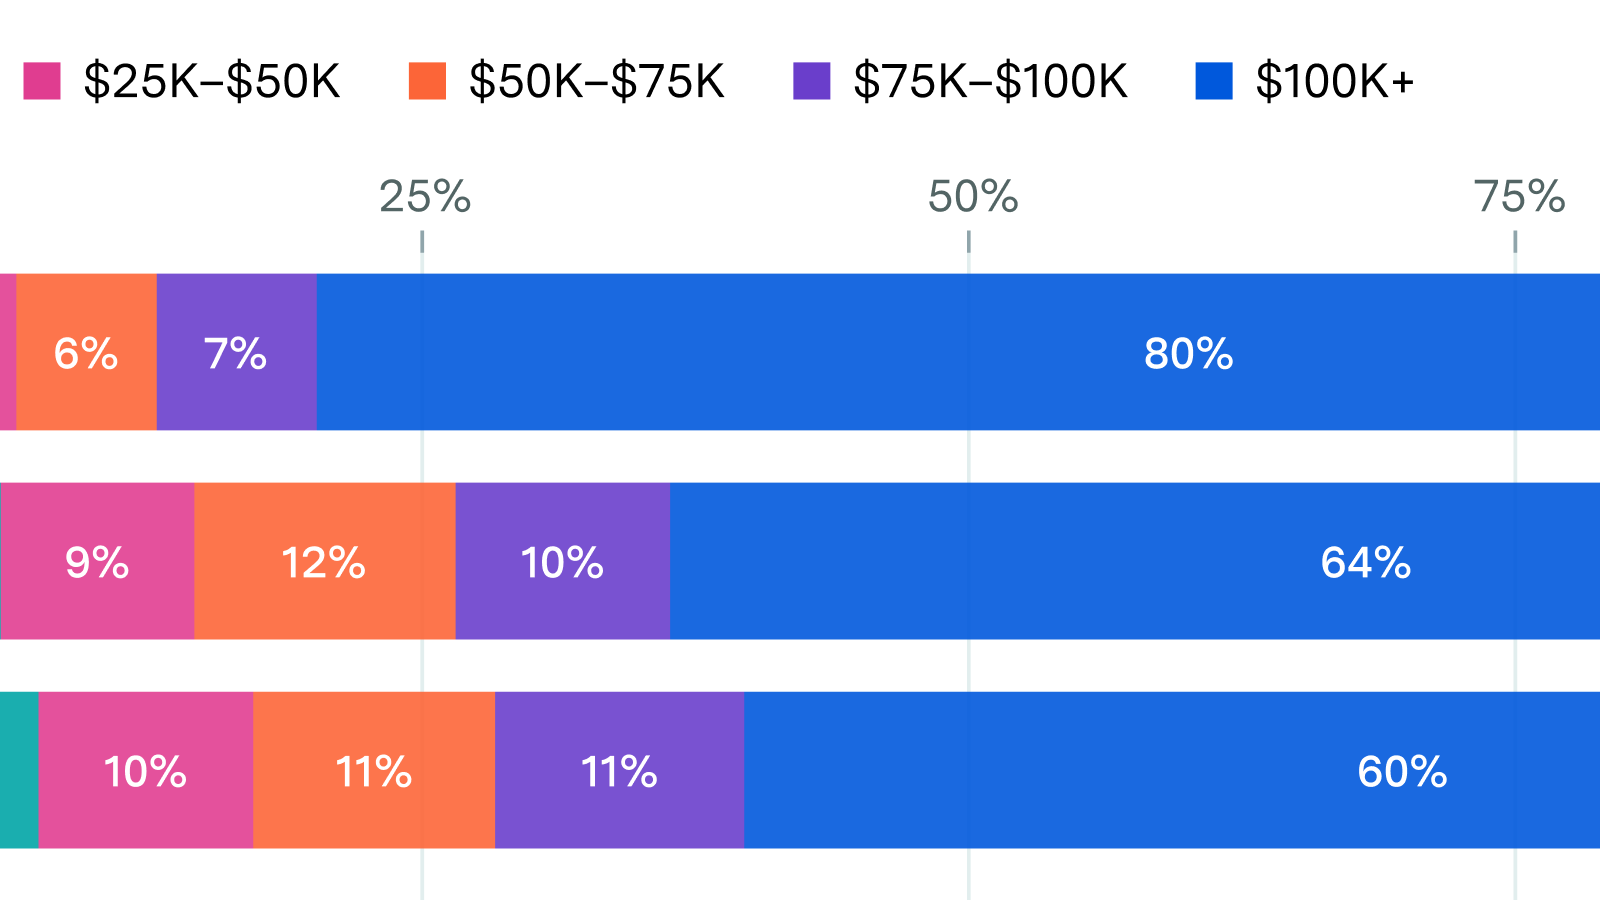

Most US workers who report recently using AI at work are not using an employer-provided subscription. For most occupation groups, free plans are the most common way to access AI at work (45% to 61% of workers). The exception is computer, engineering, and science occupations, where a majority (67%) use employer-provided subscription at least some of the time. For knowledge workers in the comparable fields of management, business and arts, that share falls to 41%.
| occupation | payer | pct | ci_lo | ci_hi | n | n_eff |
|---|---|---|---|---|---|---|
| All respondents who use AI at work | Both employer & personal | 8.3 | 6.4 | 10.7 | 37 | 462.4 |
| All respondents who use AI at work | Employer-provided | 28.6 | 25.3 | 32.2 | 137 | 462.4 |
| All respondents who use AI at work | Personal paid | 12.7 | 10.4 | 15.5 | 59 | 462.4 |
| All respondents who use AI at work | Free plan | 46.4 | 42.6 | 50.2 | 217 | 462.4 |
| All respondents who use AI at work | Not sure | 3.3 | 2.2 | 5.0 | 16 | 462.4 |
| All respondents who use AI at work | Refused | 0.6 | 0.3 | 1.6 | 3 | 462.4 |
| All respondents who use AI at work | Not sure / refused | 4.0 | 2.7 | 5.8 | 19 | 462.4 |
| All respondents who use AI at work | Employer-provided incl. both | 36.9 | 33.3 | 40.7 | 174 | 462.4 |
| Both employer & personal | 7.7 | 5.2 | 11.4 | 15 | 204.0 | |
| Employer-provided | 32.8 | 27.7 | 38.4 | 69 | 204.0 | |
| Personal paid | 12.3 | 9.0 | 16.6 | 25 | 204.0 | |
| Free plan | 44.6 | 39.0 | 50.4 | 93 | 204.0 | |
| Not sure | 2.0 | 0.9 | 4.4 | 4 | 204.0 | |
| Refused | 0.5 | 0.1 | 2.2 | 1 | 204.0 | |
| Not sure / refused | 2.5 | 1.3 | 5.1 | 5 | 204.0 | |
| Employer-provided incl. both | 40.6 | 35.1 | 46.3 | 84 | 204.0 | |
| Computer, engineering & science | Both employer & personal | 15.0 | 9.6 | 22.7 | 12 | 80.3 |
| Computer, engineering & science | Employer-provided | 51.8 | 42.7 | 60.8 | 42 | 80.3 |
| Computer, engineering & science | Personal paid | 8.5 | 4.6 | 15.0 | 7 | 80.3 |
| Computer, engineering & science | Free plan | 21.0 | 14.5 | 29.4 | 17 | 80.3 |
| Computer, engineering & science | Not sure | 2.6 | 0.9 | 7.4 | 2 | 80.3 |
| Computer, engineering & science | Refused | 1.2 | 0.2 | 5.2 | 1 | 80.3 |
| Computer, engineering & science | Not sure / refused | 3.7 | 1.5 | 9.0 | 3 | 80.3 |
| Computer, engineering & science | Employer-provided incl. both | 66.8 | 57.7 | 74.8 | 54 | 80.3 |
| Service | Both employer & personal | 8.0 | 3.7 | 16.5 | 4 | 52.4 |
| Service | Employer-provided | 16.8 | 10.0 | 26.8 | 9 | 52.4 |
| Service | Personal paid | 14.6 | 8.3 | 24.3 | 8 | 52.4 |
| Service | Free plan | 57.0 | 45.7 | 67.6 | 30 | 52.4 |
| Service | Not sure | 3.6 | 1.2 | 10.6 | 2 | 52.4 |
| Service | Refused | 0.0 | 0.0 | 4.9 | 0 | 52.4 |
| Service | Not sure / refused | 3.6 | 1.2 | 10.6 | 2 | 52.4 |
| Service | Employer-provided incl. both | 24.8 | 16.4 | 35.7 | 13 | 52.4 |
| Sales & office | Both employer & personal | 5.1 | 2.2 | 11.3 | 3 | 70.9 |
| Sales & office | Employer-provided | 19.3 | 12.8 | 28.1 | 14 | 70.9 |
| Sales & office | Personal paid | 12.1 | 7.1 | 19.9 | 9 | 70.9 |
| Sales & office | Free plan | 59.2 | 49.5 | 68.3 | 43 | 70.9 |
| Sales & office | Not sure | 2.7 | 0.9 | 8.0 | 2 | 70.9 |
| Sales & office | Refused | 1.5 | 0.4 | 6.2 | 1 | 70.9 |
| Sales & office | Not sure / refused | 4.2 | 1.7 | 10.1 | 3 | 70.9 |
| Sales & office | Employer-provided incl. both | 24.4 | 17.1 | 33.7 | 17 | 70.9 |
| Trades, production & transport | Both employer & personal | 4.2 | 1.4 | 11.8 | 2 | 48.5 |
| Trades, production & transport | Employer-provided | 5.8 | 2.3 | 14.1 | 3 | 48.5 |
| Trades, production & transport | Personal paid | 17.6 | 10.4 | 28.3 | 8 | 48.5 |
| Trades, production & transport | Free plan | 61.1 | 49.3 | 71.8 | 30 | 48.5 |
| Trades, production & transport | Not sure | 11.2 | 5.7 | 20.8 | 6 | 48.5 |
| Trades, production & transport | Refused | 0.0 | 0.0 | 5.3 | 0 | 48.5 |
| Trades, production & transport | Not sure / refused | 11.2 | 5.7 | 20.8 | 6 | 48.5 |
| Trades, production & transport | Employer-provided incl. both | 10.0 | 4.9 | 19.3 | 5 | 48.5 |

Results are based on the July, 2026 Epoch AI/Ipsos survey (1,103 employed respondents), using a subsample of 469 workers who used AI at least partly for work in the past 7 days. Survey respondents were recruited at random. Estimates are weighted to better reflect underrepresented groups, like those from lower socioeconomic backgrounds.
Epoch's work is free to use, distribute, and reproduce provided the source and authors are credited under the Creative Commons BY license.
Learn more about this graph
This analysis examines who pays for the AI tools that US workers use at work. For workers who used AI for work in the past seven days, we computed the share whose main AI subscription for work was provided by their employer, paid for personally, both, or a free plan. We also report a combined “employer-provided” measure that includes respondents who answered “both”, since in those cases the employer pays for at least part of the worker’s AI access.
We break these shares out by occupation, grouping occupations into the Bureau of Labor Statistics (BLS) high-level aggregation of the 2018 Standard Occupational Classification (SOC) major groups, with two modifications: computer, engineering and science occupations are shown separately, and natural resources, construction and maintenance is combined with production and transportation into ‘Trades, production & transport’.
Data
Analysis
Assumptions and limitations
Download this data
Explore this data
Tracking how employed Americans use AI at work, across demographics.
Related insights