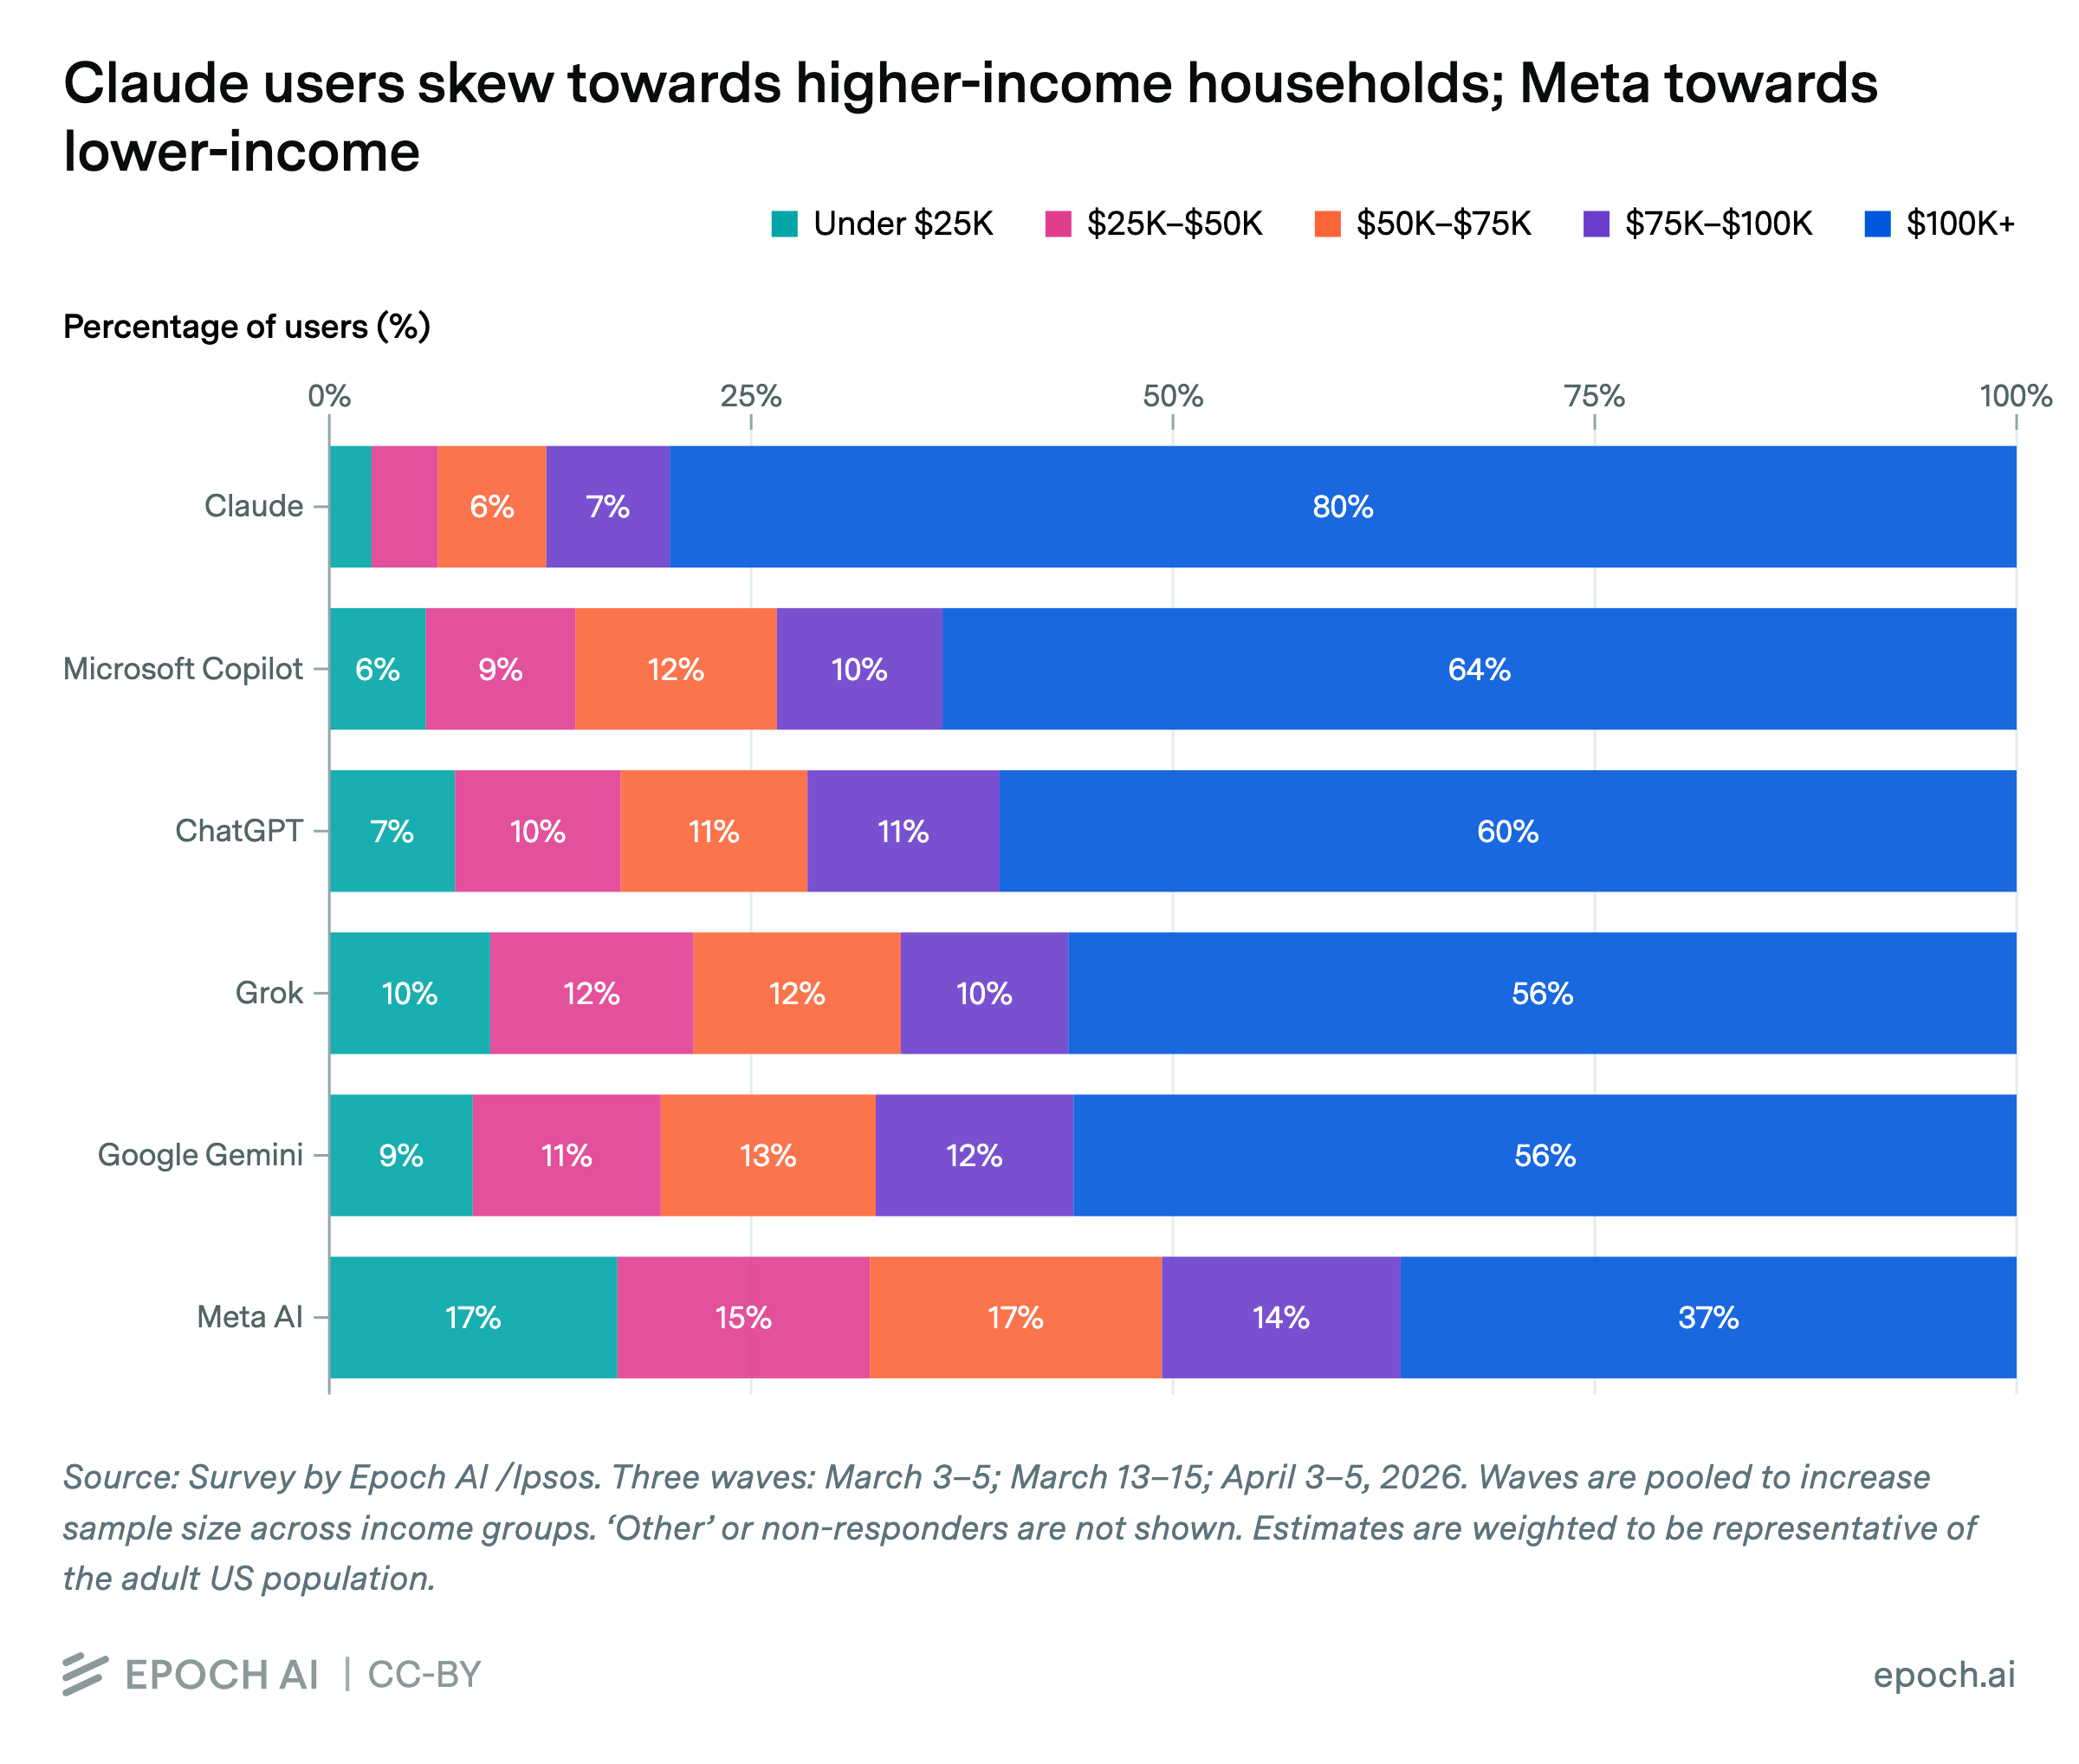
80% of US adults who report using Claude in the previous week live in households earning $100,000 or more a year, compared to 37% of Meta AI users. Nationally, about 50% of US adults fall in this income bracket. Among Meta AI users, 32% live in households earning less than $50,000, compared to 7% of Claude users and 24% of US adults. Other major providers cluster in a relatively narrow band, with 56–64% of users in $100,000+ households and 15–22% under $50,000.
Results are based on three pooled waves of the Epoch AI/Ipsos survey (~2,000 respondents in each of waves 1–2, ~1,000 in wave 3). Participants reported which AI services (if any) they used in the past week. Respondents were recruited at random. Estimates are weighted to better reflect underrepresented groups, like those from lower socioeconomic backgrounds. Users may report using more than one AI service, so groups are not mutually exclusive.
Epoch's work is free to use, distribute, and reproduce provided the source and authors are credited under the Creative Commons BY license.
Learn more about this graph
This analysis examines how household income is distributed among weekly users of six AI services measured in an Epoch AI/Ipsos survey: ChatGPT, Claude, Google Gemini, Grok, Meta AI, and Microsoft Copilot.
For each service, we compute the share of its weekly users who fall into five income brackets: under $25,000; $25,000–$50,000; $50,000–$75,000; $75,000–$100,000; and $100,000 or more and display these as stacked 100% bar charts sorted by the share of $100,000+ earners (descending).
Data
The data are responses from an Epoch AI/Ipsos survey fielded on Ipsos’ KnowledgePanel, a probability-based online panel that uses address-based sampling to choose respondents. For the analysis, we use three waves of sampling: March 3-5, March 13-15, and April 3-5, 2026. Among other questions, the survey asks respondents which AI services they used in the past week. All estimates are weighted to be representative of the adult U.S. population. Household income is drawn from KnowledgePanel profile data. The number of respondents are 2,021 in wave 1; 2,028 in wave 2; and 1,020 in wave 3.
For this analysis, we focus only on the question about usage of specific AI tools in the past week and and reported household income from respondents’ profile data. We also remove a small set of clearly invalid responses. In all three waves, respondents who reported using the fictitious service “Clarity AI” are excluded. For wave 1, we also exclude respondents who reported a Clarity AI subscription. This removes 25 observations in wave 1, 17 in wave 2, and 1 in wave 3.
We compute baseline US adults’ household income numbers from 2024 CPS ASEC (Census HINC-03): share of adults living in households at each income level, with ‘children of householder’ excluded to approximate the 18+ population. On this basis, 50% of US adults live in households earning $100,000 or more, and 24% live in households earning under $50,000.
Analysis
Responses from all three survey waves are pooled before computing income shares to maximize sample sizes. Pooled sample sizes for weekly users: ChatGPT (n = 1,611), Claude (n = 201), Google Gemini (n = 1,105), Grok (n = 221), Meta AI (n = 359), and Microsoft Copilot (n = 590). Users may report using more than one AI service, so these groups are not mutually exclusive.
For each service, we compute weighted income-bracket shares within that service’s weekly users. Specifically, we divide the sum of survey weights for respondents in each income bracket by the total sum of survey weights for all of that service’s weekly users. This yields a percentage breakdown that accounts for the probability-weighted representation of each income group.
To quantify uncertainty, we compute weighted standard errors using Taylor series linearization (following our polling hub methodology). We then construct 90% confidence intervals using these standard errors.
| Service | n | Under $25K | $25K-$50K | $50K-$75K | $75K-$100K | $100K+ |
|---|---|---|---|---|---|---|
| ChatGPT | 1,611 | 7.4% [6.4, 8.5] | 9.8% [8.6, 11.1] | 11.1% [9.8, 12.4] | 11.4% [10.0, 12.8] | 60.3% [58.2, 62.3] |
| Claude | 201 | 2.5% [0.8, 4.2] | 3.9% [1.7, 6.2] | 6.4% [3.6, 9.2] | 7.3% [4.3, 10.3] | 79.8% [75.2, 84.4] |
| Google Gemini | 1,105 | 8.5% [7.1, 9.9] | 11.1% [9.5, 12.7] | 12.7% [11.1, 14.4] | 11.7% [10.1, 13.3] | 55.9% [53.4, 58.4] |
| Grok | 221 | 9.5% [6.2, 12.9] | 12.1% [8.5, 15.6] | 12.3% [8.6, 15.9] | 9.9% [6.5, 13.4] | 56.2% [50.6, 61.8] |
| Meta AI | 359 | 17.1% [13.8, 20.3] | 15.0% [11.8, 18.1] | 17.3% [14.0, 20.6] | 14.1% [11.0, 17.3] | 36.5% [32.3, 40.7] |
| Microsoft Copilot | 590 | 5.7% [4.2, 7.3] | 8.9% [6.9, 10.8] | 11.9% [9.7, 14.2] | 9.8% [7.7, 11.9] | 63.7% [60.3, 67.0] |
| Perplexity | 86 | 12.0% [6.3, 17.6] | 13.1% [6.9, 19.3] | 7.5% [2.6, 12.4] | 7.5% [2.6, 12.3] | 60.0% [51.1, 68.8] |
| DeepSeek | 43 | 17.8% [8.0, 27.5] | 15.9% [6.6, 25.2] | 8.8% [1.7, 15.9] | 8.9% [1.8, 16.1] | 48.6% [35.7, 61.6] |
| Character.AI | 39 | 27.0% [15.2, 38.8] | 20.1% [9.4, 30.8] | 15.1% [5.6, 24.7] | 4.9% [0.0, 10.5] | 32.9% [20.0, 45.8] |
| Other | 115 | 13.3% [8.0, 18.6] | 13.8% [8.4, 19.2] | 9.5% [4.9, 14.1] | 10.3% [5.4, 15.2] | 53.1% [45.3, 60.9] |
| Service-use nonresponse | 58 | 12.1% [5.0, 19.3] | 11.1% [4.4, 17.9] | 16.2% [7.9, 24.5] | 17.1% [8.4, 25.9] | 43.4% [32.5, 54.3] |
From the graph, we exclude services with smaller shares (Perplexity, DeepSeek, and Character.AI, ‘other’ responses, and non-responses.
Assumptions and limitations
Each wave surveys a fresh sample (cross-section) rather than tracking the same individuals, so results reflect population-level changes. Pooling waves increases sample sizes and requires that the income profile of each service’s users be roughly stable across the three survey field periods (March, April 2026). In a series of Rao-Scott survey-weighted tests for homogeneity, we find no statistically significant evidence that any tool’s user income profile differs across waves.
Claude (n = 201) and Grok (n = 221) have relatively small pooled samples among the six charted services, so income-bracket estimates for these services carry wider uncertainty than for other services.
Although results are weighted to be representative, as with all surveys, non-respondents may differ from respondents in ways the weighting does not capture. Usage is self-reported and may be affected by recall error or misclassification.

