Since 2023, the average dollar spent on AI chips each quarter has yielded about 49% more performance each year. At that rate, the performance a dollar buys doubles every 1.7 years. Growth has come in spurts, as spending shifts to the newest generation of chips. Price-performance was nearly flat through mid-2024, then roughly doubled as Blackwell-generation chips grew to a majority of new spending.
| Quarter | Chip | Performance per dollar (relative to an H100 at its 2025 price) | Spending in quarter (billion 2025 USD) |
|---|---|---|---|
| 2023 Q1 | A100 | 0.63 | $0.76 |
| 2023 Q1 | H100/H200 | 0.80 | $1.83 |
| 2023 Q1 | Other | 1.28 | $1.19 |
| 2023 Q2 | A100 | 0.64 | $0.83 |
| 2023 Q2 | H100/H200 | 0.81 | $4.86 |
| 2023 Q2 | Other | 1.10 | $1.97 |
| 2023 Q3 | A100 | 0.64 | $0.70 |
| 2023 Q3 | H100/H200 | 0.82 | $8.29 |
| 2023 Q3 | Other | 1.05 | $2.93 |
| 2023 Q4 | A100 | 0.65 | $0.19 |
| 2023 Q4 | H100/H200 | 0.82 | $13.38 |
| 2023 Q4 | Other | 1.43 | $1.95 |
| 2024 Q1 | H20 | 0.31 | $1.75 |
| 2024 Q1 | H100/H200 | 0.89 | $16.14 |
| 2024 Q1 | Trainium2 | 4.19 | $0.06 |
| 2024 Q1 | Other | 1.34 | $4.49 |
| 2024 Q2 | H20 | 0.31 | $2.79 |
| 2024 Q2 | H100/H200 | 0.89 | $18.89 |
| 2024 Q2 | Trainium2 | 4.21 | $0.13 |
| 2024 Q2 | Other | 1.57 | $5.13 |
| 2024 Q3 | H20 | 0.31 | $3.41 |
| 2024 Q3 | H100/H200 | 0.90 | $22.96 |
| 2024 Q3 | Trainium2 | 4.23 | $0.33 |
| 2024 Q3 | TPU v6e | 5.68 | $0.17 |
| 2024 Q3 | Other | 1.70 | $5.56 |
| 2024 Q4 | H20 | 0.32 | $4.02 |
| 2024 Q4 | H100/H200 | 0.90 | $19.62 |
| 2024 Q4 | GB200 | 1.72 | $7.70 |
| 2024 Q4 | Trainium2 | 4.26 | $0.78 |
| 2024 Q4 | TPU v6e | 5.72 | $0.73 |
| 2024 Q4 | Other | 1.75 | $5.68 |
| 2025 Q1 | H20 | 0.32 | $4.43 |
| 2025 Q1 | H100/H200 | 0.98 | $8.71 |
| 2025 Q1 | GB200 | 1.73 | $19.76 |
| 2025 Q1 | Trainium2 | 4.30 | $0.86 |
| 2025 Q1 | TPU v6e | 5.77 | $1.70 |
| 2025 Q1 | Other | 1.48 | $6.53 |
| 2025 Q2 | H20 | 0.32 | $1.86 |
| 2025 Q2 | H100/H200 | 0.99 | $6.01 |
| 2025 Q2 | GB200 | 1.74 | $16.47 |
| 2025 Q2 | GB300 | 2.30 | $9.40 |
| 2025 Q2 | Trainium2 | 4.32 | $1.02 |
| 2025 Q2 | TPU v6e | 5.80 | $2.76 |
| 2025 Q2 | Other | 1.30 | $5.42 |
| 2025 Q3 | H20 | 0.32 | $0.21 |
| 2025 Q3 | H100/H200 | 0.99 | $3.32 |
| 2025 Q3 | GB200 | 1.75 | $13.01 |
| 2025 Q3 | GB300 | 2.32 | $23.43 |
| 2025 Q3 | Trainium2 | 4.35 | $1.17 |
| 2025 Q3 | TPU v6e | 5.84 | $3.04 |
| 2025 Q3 | Other | 1.81 | $6.76 |
| 2025 Q4 | H100/H200 | 1.00 | $0.61 |
| 2025 Q4 | GB200 | 1.76 | $15.51 |
| 2025 Q4 | GB300 | 2.33 | $32.03 |
| 2025 Q4 | Trainium2 | 4.38 | $1.34 |
| 2025 Q4 | TPU v6e | 5.88 | $1.63 |
| 2025 Q4 | Other | 2.42 | $9.00 |
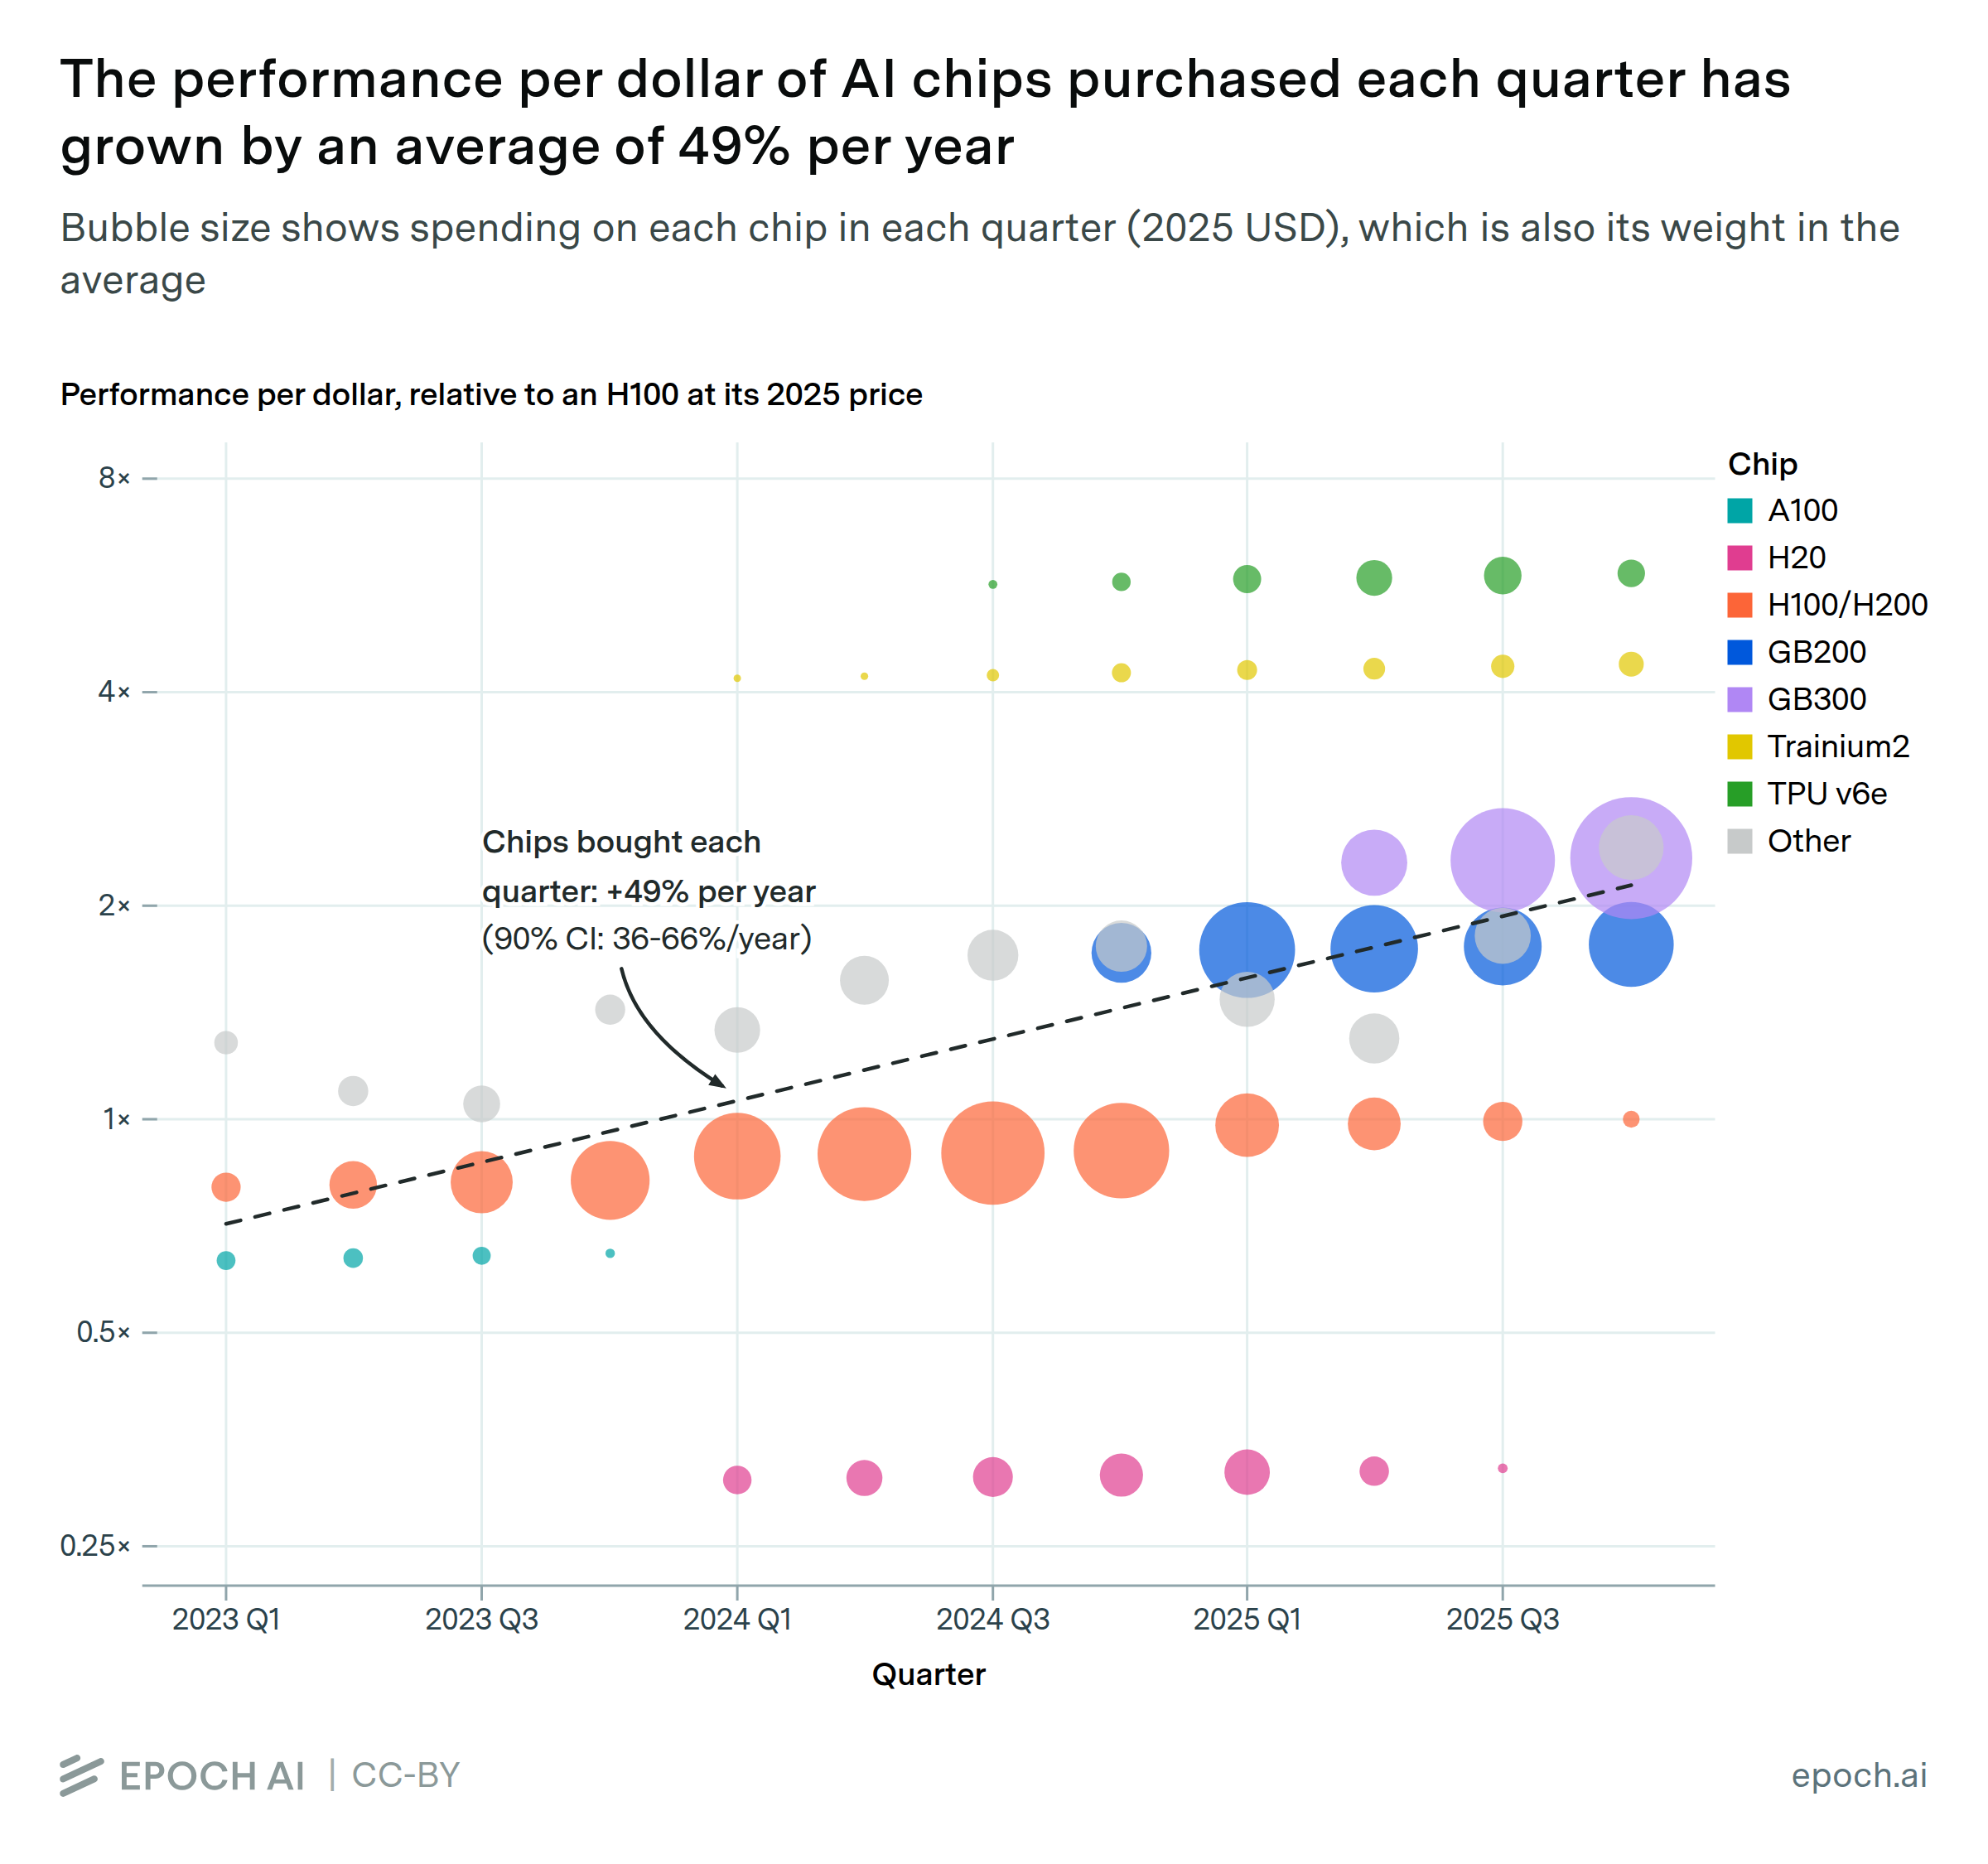
Using data from our AI Chip Sales Hub, we compute the performance per dollar of the chips sold in each quarter since 2023: their combined computing performance divided by the dollars spent on them, in constant 2025 dollars. Widely sold chips contribute more to each quarter’s figure than chips produced in smaller volumes.
Epoch's work is free to use, distribute, and reproduce provided the source and authors are credited under the Creative Commons BY license.
Learn more about this graph
We estimate the aggregate performance per dollar of the AI chips purchased in each quarter. Performance per dollar rose from about 5.6 × 1011 bit-operations per second per dollar in the first quarter of 2023 to about 1.4 × 10¹² by the end of 2025, in constant 2025 dollars. Fitting an exponential trend gives an average growth rate of about 49% per year (90% CI: 36% to 66% per year).
The gains are largely due to chips getting exponentially more powerful with each new generation. While recent chips have become more expensive, they have grown more powerful at an even faster rate. In 2025 dollars, NVIDIA’s GB300 costs about 5.5 times the P100’s 2016 launch price, yet it delivers roughly 200 times the performance, making it about 37 times more cost effective.
While chips are available with performance per dollar as high as 3.6 × 1012 bit-operations per second per dollar (Google’s TPU v6e), the average across each quarter’s purchases is lower. Most AI hardware spending currently goes towards Nvidia’s GPUs, which command a relatively high margin and thus have a lower price-perf than some custom ASICs.
Data
Our analysis draws data from several Epoch datasets:
-
Chip sales: Quarterly units of each accelerator, from our AI Chip Sales Hub. We begin the series in 2023 because coverage before then is sparse, and end it in Q4 2025 because sales estimates for later quarters are not yet complete. Note that the Chip Sales hub, and thus this analysis, models the amount of units and compute sold rather than deployed each quarter.
-
Performance: We use each chip’s Total Processing Performance (TPP), a precision-normalized throughput metric, equal to peak operations per second multiplied by the bit width of that number format.
-
Price: We use one representative purchase price per chip. These are the purchase prices rather than the rental prices, and they cover the accelerator card or module rather than a full server. Most of these chips have no single MSRP, so we estimate what buyers were paying around the time each chip started shipping in volume. For Nvidia, AMD, and Huawei we use reported transaction prices, executive statements, and order values, and take a geometric mean when we only have a range.
Google and Amazon did not sell their chips directly, so we use what it costs them to procure the chips from their manufacturing partners, based on BOM modeling plus the partner’s margin (see our Chip Sales Hub methodology).
For the H100/H200, whose price we model as slightly declining over its long sales run, we use year-specific prices: $30,000 in 2023, $28,000 in 2024, and $26,000 in 2025. Other chips keep one price across all quarters, so we do not capture any later price cuts or spot prices. You can find the price data here.
The analysis covers 24 chips with both sales and price data: Nvidia A100, A800, H100/H200, H800, H20, GB200, and GB300; AMD Instinct MI250X, MI300A, MI300X, MI308X, MI325X, MI350X, and MI355X; Google TPU v4, v4i, v5e, v5p, v6e, and v7; Huawei Ascend 910B and 910C; Amazon Trainium2; and Cambricon Siyuan 590. The H100/H200 are combined in the sales data, and we use H100 specs and prices for the combined line. For the Blackwell generation we use the GB200 and GB300 per-GPU specifications.
For the plot, we group the A800, the H800, AMD’s Instinct GPUs, Huawei’s Ascend chips, Cambricon’s Siyuan 590, and all Google TPUs except the v6e into a combined “Other” category.
Analysis
For each quarter (Q), performance per dollar across all chips sold is:
\[\text{perf}/\$(Q) = \frac{\sum_i \text{TPP}_i \times \text{units}_i(Q)}{\sum_i \text{price}_i \times \text{units}_i(Q)}\]where the unit term is the number of chip i sold within quarter Q, and TPP is its Total Processing Performance. The output is a dollar-weighted average of each chip’s performance per dollar, weighted by its share of that quarter’s spending. Since Nvidia accounted for most spending from 2023-2025, the average is pulled toward its higher-priced hardware.
Spending is adjusted for inflation using the consumer price index. Each quarter’s new spending is converted into Q4 2025 dollars at that quarter’s index value, so all figures are in constant 2025 dollars. There was no CPI published for October 2025, due to the government shutdown, so the Q4 2025 anchor averages November and December.
A log-linear fit over the 12 quarters from Q1 2023 to Q4 2025 gives an annual growth rate of about 49%, a doubling time of 1.7 years. The 90% confidence interval, from bootstrap resampling, is roughly 36% to 66% per year, or doubling times between 1.4 and 2.3 years. In nominal dollars, the growth rate is 45% per year. The growth comes in spurts: price-performance was nearly flat at 6% per year from 2023 to mid-2024, and then grew to roughly double per year as Blackwell-generation chips took over spending. Chips bought in 2024 averaged 23% better performance per dollar than 2023 purchases, and 2025 purchases averaged 91% better than 2024’s.
Assumptions and limitations
Our Chip Sales estimates, and thus the volumes used in this analysis, are chips that are sold rather than deployed. This is a price-performance measure of the hardware that has shipped, not of active computing capacity. Active capacity may differ both because old chips have depreciated, and because newly-sold chips have not yet become operational.
We use peak theoretical performance as given by each chip’s spec sheet, converted to peak bit-operations per second. Real-world performance depends heavily on software support for the hardware, the model architecture, the workload shape, the rack-scale system design, the networking topology, and memory and interconnect bandwidth. Realized performance per dollar on any given workload can differ substantially from on-paper specs.
Prices vary across vendors and designers. We price each chip at its cost to the primary owner of that compute. Nvidia, AMD, and Huawei primarily sell accelerators to external customers, so we use external sale prices, which include the designer’s margin. Google’s and Amazon’s accelerators are built primarily to serve their own internal workloads and to be rented to customers through their cloud platforms. Both companies design their chips in-house and procure them from manufacturing partners, paying production cost plus the margin of their manufacturing partners, which is typically lower than Nvidia margins. Their prices in this analysis are therefore closer to procurement cost than to a market price, which flatters TPU and Trainium price-performance relative to what an external buyer would likely pay. The margin Google and Amazon charge when renting this hardware to customers through their cloud platforms is not counted here. Google and Broadcom have recently begun selling TPUs directly to external customers, but those sales do not yet appear in our data.
Transaction prices vary. We use a single representative price per chip, while actual sale prices vary by customer, purchase volume, and timing, and are especially uncertain for chips sold into restricted markets.
The series covers 24 accelerators with price data. Coverage is broad but not complete. The analysis excludes Amazon’s first-generation Trainium and Inferentia, for which we lack a price estimate (less than half a percent of tracked compute sold), and does not cover accelerators our Chip Sales Hub does not track, including Intel’s Gaudi, Groq, Cerebras, Microsoft’s Maia, Meta’s MTIA, Tesla’s Dojo, etc.