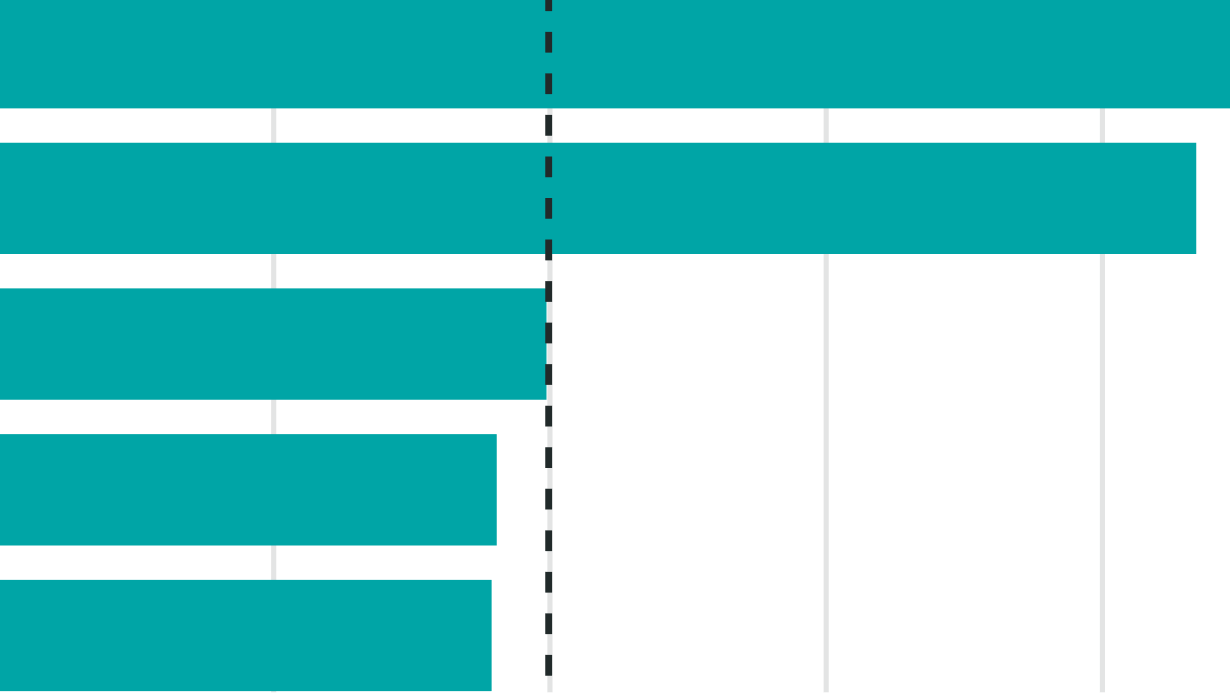
Between Q2 2025 and Q2 2026, the estimated agentic inference capacity of AI chips sold to date grew 4.6×, compared with 2.6× growth in computing power. We measure agentic capacity using our Inference Performance Index (IPI), which compares hardware on a fixed set of workloads with long, cached contexts.
| Quarter | Nvidia Blackwell Ultra: B300 / GB300 (× Q2 2025 inference total) | Nvidia Blackwell: B200 / GB200 (× Q2 2025 inference total) | Nvidia Hopper: H100 / H200 (× Q2 2025 inference total) | Other Nvidia GPUs (× Q2 2025 inference total) | Google TPU v8i (× Q2 2025 inference total) | Google TPU v7 (× Q2 2025 inference total) | Earlier TPUs (× Q2 2025 inference total) | AMD GPUs (× Q2 2025 inference total) | Amazon Trainium (× Q2 2025 inference total) | Other chips (× Q2 2025 inference total) | Total agentic inference capacity (× Q2 2025 inference total) | Peak 8-bit compute (× Q2 2025 peak compute total) | Total agentic inference capacity (GB300e) | Total peak 8-bit compute (H100e) | Nvidia Blackwell Ultra: B300 / GB300 peak 8-bit compute (H100e) | Nvidia Blackwell: B200 / GB200 peak 8-bit compute (H100e) | Nvidia Hopper: H100 / H200 peak 8-bit compute (H100e) | Other Nvidia GPUs peak 8-bit compute (H100e) | Google TPU v8i peak 8-bit compute (H100e) | Google TPU v7 peak 8-bit compute (H100e) | Earlier TPUs peak 8-bit compute (H100e) | AMD GPUs peak 8-bit compute (H100e) | Amazon Trainium peak 8-bit compute (H100e) | Other chips peak 8-bit compute (H100e) | Nvidia Blackwell Ultra: B300 / GB300 inference capacity (GB300e) | Nvidia Blackwell: B200 / GB200 inference capacity (GB300e) | Nvidia Hopper: H100 / H200 inference capacity (GB300e) | Other Nvidia GPUs inference capacity (GB300e) | Google TPU v8i inference capacity (GB300e) | Google TPU v7 inference capacity (GB300e) | Earlier TPUs inference capacity (GB300e) | AMD GPUs inference capacity (GB300e) | Amazon Trainium inference capacity (GB300e) | Other chips inference capacity (GB300e) |
|---|---|---|---|---|---|---|---|---|---|---|---|---|---|---|---|---|---|---|---|---|---|---|---|---|---|---|---|---|---|---|---|---|---|---|
| Q2 2025 | 0.12 | 0.55 | 0.15 | 0.0185 | 0.0000 | 0.00 | 0.0550 | 0.0223 | 0.07 | 0.0104 | 1.00 | 1.00 | 1,454,225.29 | 1.2e+7 | 543,689 | 2,917,769 | 4,166,599 | 677,274 | 0 | 0 | 2,015,803 | 816,567 | 603,144 | 463,126 | 175,660.28 | 804,413.51 | 216,832.15 | 26,875.61 | 0.00 | 0.00 | 79,991.08 | 32,402.88 | 102,967.64 | 15,082.16 |
| Q3 2025 | 0.42 | 0.72 | 0.16 | 0.0186 | 0.0000 | 0.03 | 0.0737 | 0.0317 | 0.10 | 0.0139 | 1.56 | 1.30 | 2,269,164.73 | 1.6e+7 | 1,912,499 | 3,792,171 | 4,293,907 | 679,834 | 0 | 119,573 | 2,700,026 | 1,019,806 | 793,498 | 602,653 | 617,908.81 | 1,045,482.20 | 227,175.64 | 26,977.21 | 0.00 | 38,028.82 | 107,142.35 | 46,071.69 | 140,095.12 | 20,282.88 |
| Q4 2025 | 0.84 | 0.92 | 0.16 | 0.0186 | 0.0000 | 0.14 | 0.0841 | 0.0493 | 0.13 | 0.0175 | 2.35 | 1.67 | 3,416,361.65 | 2.0e+7 | 3,791,541 | 4,847,303 | 4,317,291 | 679,834 | 0 | 617,899 | 3,081,039 | 1,240,170 | 1,013,389 | 742,894 | 1,225,008.24 | 1,336,376.60 | 229,075.54 | 26,977.21 | 0.00 | 196,516.57 | 122,261.70 | 71,650.07 | 182,983.77 | 25,511.95 |
| Q1 2026 | 1.40 | 1.09 | 0.16 | 0.0186 | 0.0000 | 0.31 | 0.0881 | 0.0698 | 0.16 | 0.0232 | 3.31 | 2.07 | 4,806,532.66 | 2.5e+7 | 6,300,067 | 5,724,742 | 4,317,291 | 679,834 | 0 | 1,401,132 | 3,227,368 | 1,470,702 | 1,243,127 | 957,706 | 2,035,486.90 | 1,578,282.55 | 229,075.54 | 26,977.21 | 0.00 | 445,616.21 | 128,068.32 | 101,485.26 | 227,792.80 | 33,747.86 |
| Q2 2026 | 2.15 | 1.19 | 0.16 | 0.0186 | 0.0161 | 0.62 | 0.0891 | 0.0971 | 0.20 | 0.0390 | 4.58 | 2.59 | 6,665,192.16 | 3.2e+7 | 9,670,561 | 6,288,720 | 4,336,647 | 679,834 | 130,928 | 2,845,408 | 3,264,762 | 1,731,783 | 1,531,333 | 1,174,747 | 3,124,459.48 | 1,733,768.09 | 230,648.14 | 26,977.21 | 23,395.44 | 904,953.97 | 129,552.17 | 141,148.32 | 293,553.54 | 56,735.80 |

The growth is largely driven by the Hopper-to-Blackwell transition: Nvidia’s Blackwell and Blackwell Ultra families account for 74% of the added capacity, with GB300 systems delivering roughly 8× the inference capacity of H200s per GPU. We expect this pace to slow as quarterly additions add to an increasingly large base. Chips sold in Q2 2026 added only 3.3× the capacity of those sold in Q2 2025. Continued hardware–model co-design should nevertheless keep inference capacity growing faster than peak computing power.
Epoch's work is free to use, distribute, and reproduce provided the source and authors are credited under the Creative Commons BY license.
Learn more about this graph
The chart shows the estimated agentic inference capacity of AI chips sold to date in each quarter from Q2 2025 to Q2 2026, as a multiple of the Q2 2025 total, with bars broken down by chip designer and chip family. Lines show total inference capacity and peak 8-bit computing power, each relative to its own Q2 2025 level.
Data
We apply version 1 IPI scores (GB300 equivalents, based on fixed agentic workloads with long cached contexts) to chip-sales estimates from Epoch AI’s AI Chip Sales dataset, using the same workload basket for every quarter. The index accounts for memory, inter-chip communication, and lower-precision computation, including both input processing and output generation.
The shipment data combine B200 with GB200 and B300 with GB300.
Analysis
Estimating capacity
We multiply the cumulative number of chips sold in each category by its per-chip IPI score, then sum across categories to get total agentic inference capacity. For comparison, we calculate the peak 8-bit computing power of the same chips. We then divide each series by its Q2 2025 value.
Applying this to AI Chip Sales data, agentic inference capacity grew 4.6× between Q2 2025 and Q2 2026, while peak compute grew 2.6×.
Chips sold in Q2 2026 added 3.3× the inference capacity of those sold in Q2 2025. That is less than the 4.6× growth in total capacity, so we expect total growth to slow.
Growth in additions
Quarterly capacity additions rose 3.3× from Q2 2025 to Q2 2026, driven largely by the Hopper-to-Blackwell transition. By Q2 2026, Blackwell and Blackwell Ultra accounted for roughly 73% of total agentic inference capacity, compared with 50% of total peak 8-bit computing power. Fitting a linear regression of log additions on time across those quarters gives annual growth of 3.2× for inference capacity, and 2.1× for peak compute. Over Q1 2024–Q2 2026, the fitted rates are 6.8× and 2.5× per year, respectively, equivalent to doubling times of 4.3 and 9.2 months. The longer window includes the initial Blackwell transition. These fitted rates describe historical growth, not forecasts.
Uncertainty
We test sensitivity to shipment quantities using uncertainty estimates from the AI Chip Sales dataset. We also vary the GB share from 30% to 90% and the H200 share of eligible shipments from 30% to 70%.
Accounting for shipment and hardware-mix uncertainty gives 90% uncertainty intervals of 4.2–5.1× for inference growth and 2.5–2.7× for peak compute. Changing the assumed correlations between shipment errors or hardware mixes gives similar ranges. A separate scenario with an earlier, faster H200 transition lowers inference growth from 4.6× to 4.5×.
Hardware–model co-design
On these workloads, inference capacity per unit of peak compute rose by about 77% over the year. We use hardware–model co-design broadly to describe improvements beyond proportional increases in arithmetic throughput and memory bandwidth, including larger scale-up domains, lower-precision computation and model architectures that make better use of the hardware. Future gains could also come from increasing memory bandwidth faster than arithmetic throughput.
Outlook
Sustaining 4.6× annual growth in total capacity requires annual additions equal to 3.6× the capacity at the start of each year. As that base expands, sustaining the same percentage growth therefore requires proportionately larger additions. The Hopper-to-Blackwell transition captured many of the largest co-design gains, and we expect smaller improvements in subsequent generations: modeled inference capacity per GPU rises 8× from H200 to GB300, but only 2.2× from GB300 to Vera Rubin VR200. Faster shipment growth could offset smaller generational gains. We expect additions to keep increasing, but at a lower percentage rate.
Assumptions and limitations
We assume 60% of GPUs in each combined pair are GB/NVL72 rack systems and 40% are B/HGX servers; this split is a judgment-based assumption. We split H100/H200 shipments evenly from Q4 2024 onward, treating earlier shipments as H100.
Hardware mixes can differ between Blackwell generations and change over time; chips already sold retain their original mix.
Differences in software efficiency are not modeled.
The uncertainty intervals cover shipment and hardware-mix uncertainty, not uncertainty in modeled inference performance. They depend on the assumed distributions and correlations, with per-chip scores and workloads held fixed.
Download this data
Explore this data

AI chip sales data.
Related insights