Executive summary
The compute used to train AI models has been a key driver of AI progress, informing many predictions of AI’s future capabilities. However, the number of AI models that will surpass different compute levels has received less attention. This is relevant to compute-based AI regulation, as well as AI development and deployment more broadly. We develop a projective model that relates key inputs such as investment and the distribution of compute to the number of notable AI models: models that are state of the art, highly cited, or otherwise historically notable. The projections can be explored in a new interactive tool.
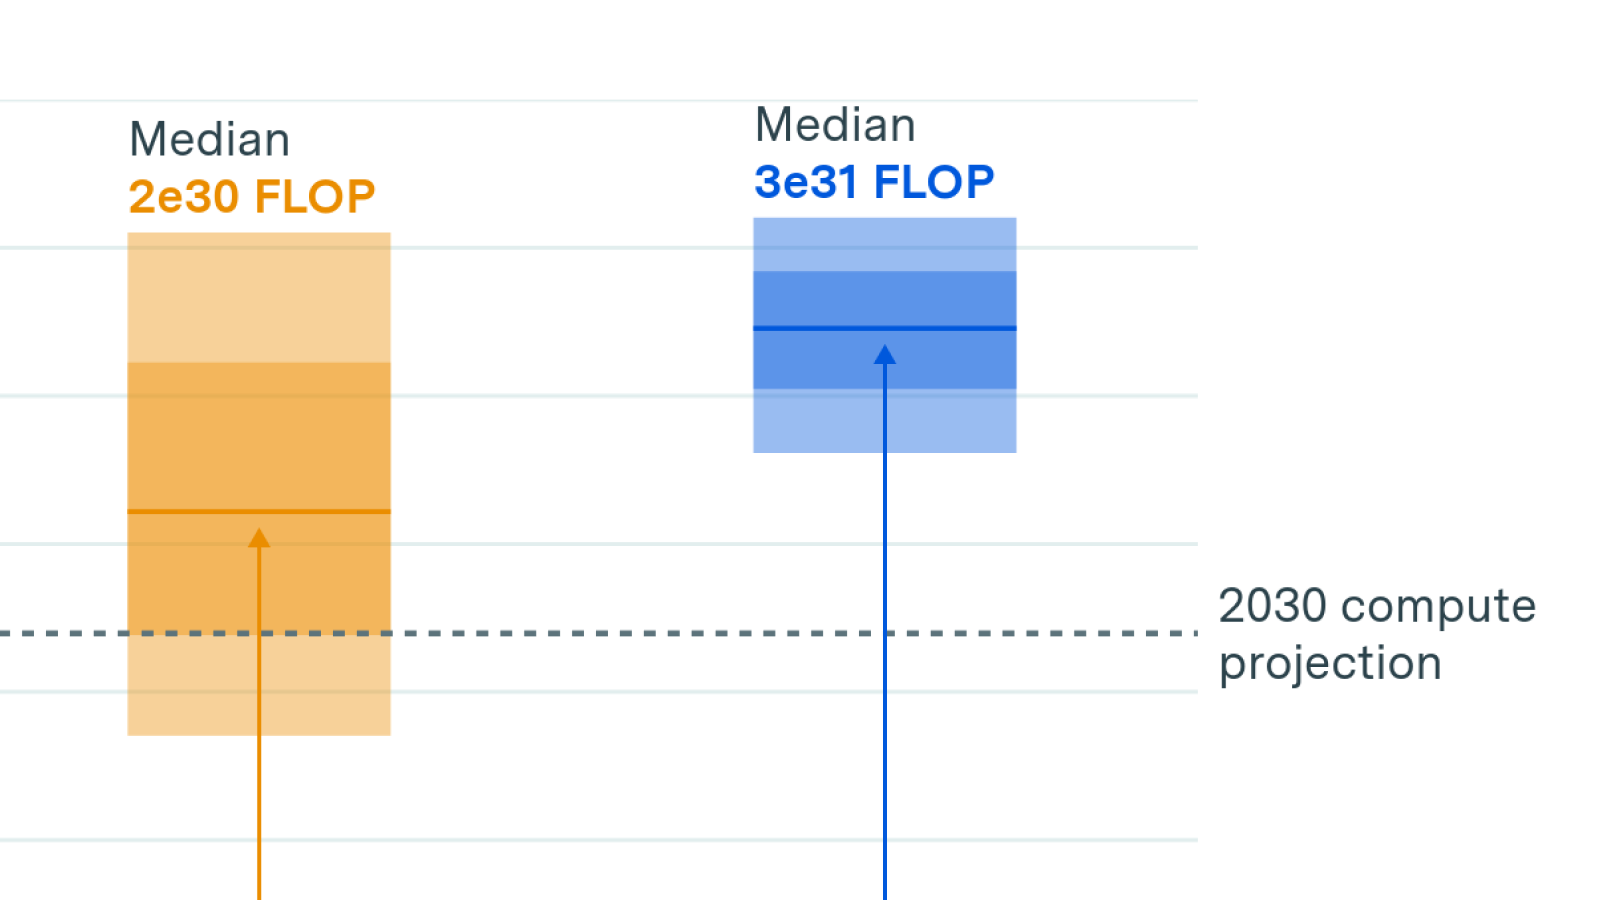
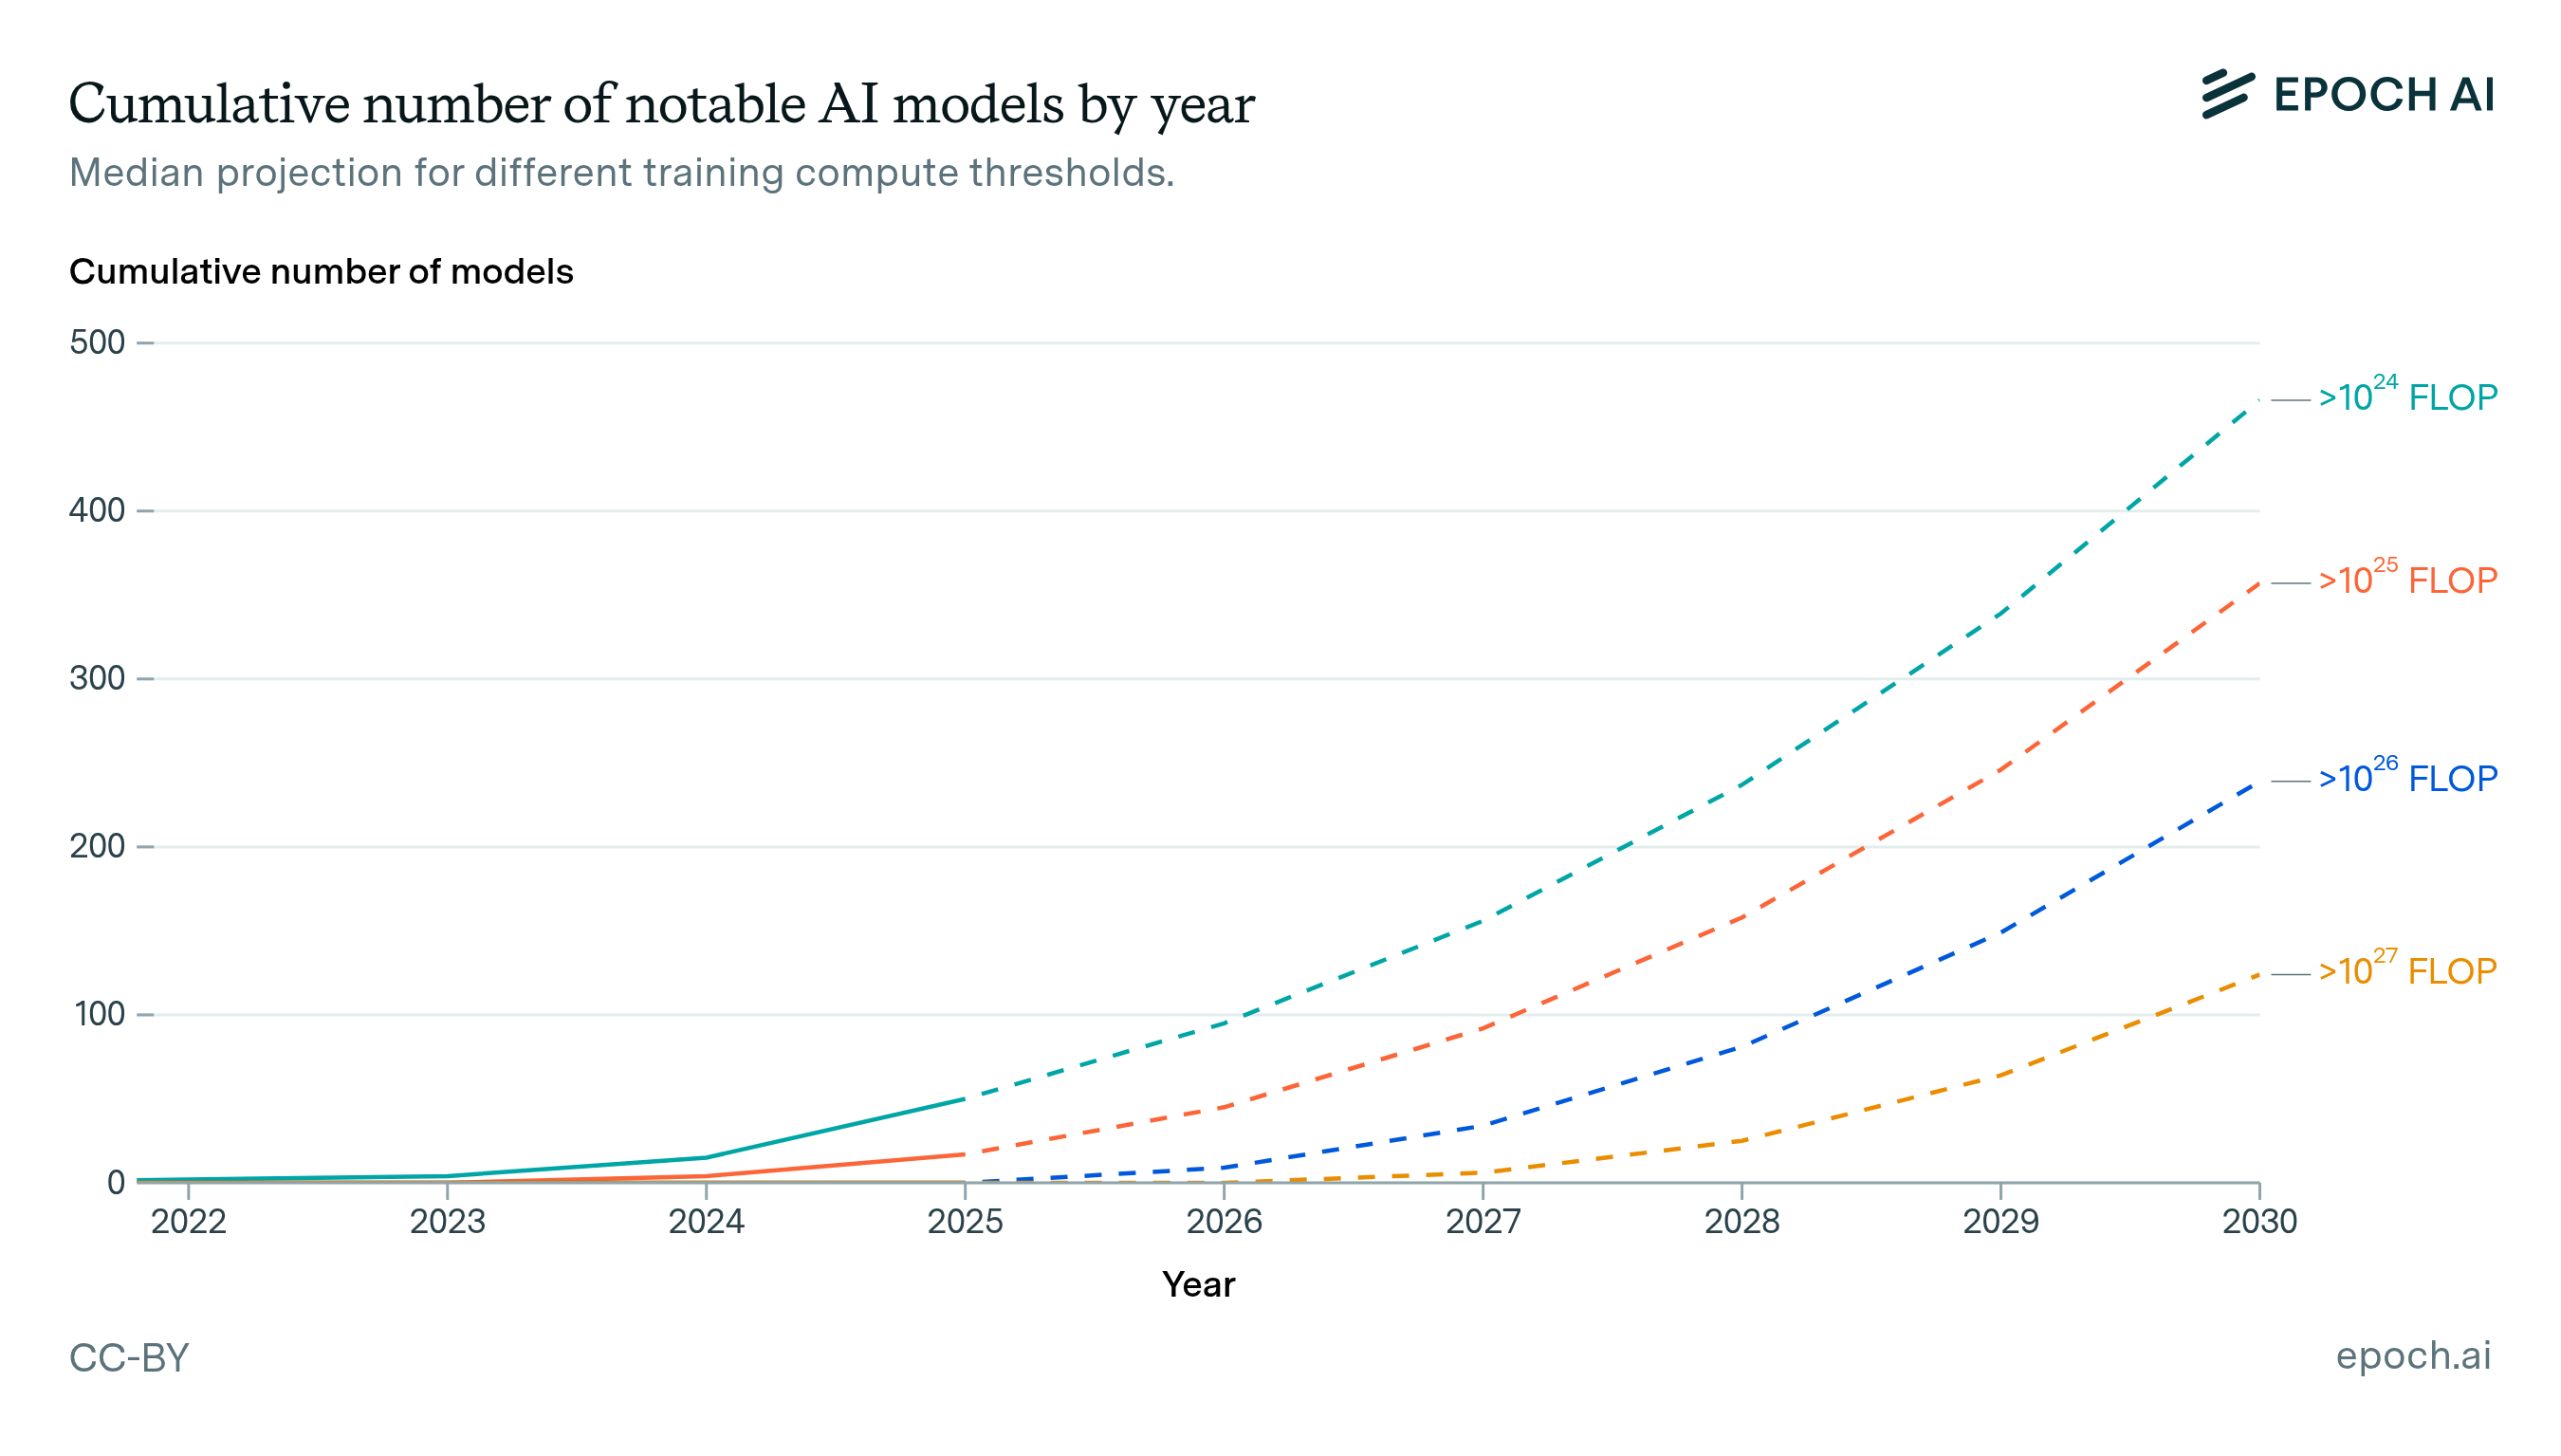
Figure 1: Median projection for future notable AI model releases with different levels of compute, by year. Note: these projections are likely to be smaller than total model counts as a compute threshold falls further behind the frontier, since lower-compute models are less likely to meet Epoch AI’s notability criteria or be publicly documented.
Our modeling shows that the number of notable AI models above a given compute threshold rapidly accelerates over time. For example, the first model in our dataset estimated to use over 1026 FLOP was Grok-3 from xAI, released in February 2025. Extrapolating current trends, there would be around 30 such models by the start of 2027, and over 200 models by the start of 2030. As the compute threshold is increased, the model count drops substantially, but growth remains rapid.
These counts focus on notable models involving a new training run that exceed a given compute threshold. These are based on our dataset of publicly announced notable models where we can estimate training compute—a subset of all AI models. For thresholds well below the frontier, such as 1023 FLOP today, the total number of published models could easily be 4x higher than our projections (see Dataset and inclusion criteria).
To illustrate the range of plausible model counts through to 2030, we developed two alternative scenarios to the median, denoted as “conservative” and “aggressive”. These scenarios are defined by three inputs: investment in the largest training run, total number of models per year, and number of models near the largest training run. For each of these inputs, we model extremes in how the current trends could change, grounded in evidence from historical variation, present day spending on AI, and potential bottlenecks to scaling (see Scenarios based on AI investment and model development). The conservative and aggressive scenarios predict about 10 and 80 notable models above 1026 FLOP by 2027, respectively. This highlights our uncertainty, while affirming that model counts are likely to grow rapidly.

Figure 2: The number of AI models above 1026 FLOP, comparing the median extrapolation to two alternative scenarios. The “conservative” and “aggressive” scenarios represent plausible extremes in the model counts. The counts accelerate across all scenarios, reaching tens to hundreds of models by 2030. Shaded regions indicate 80% confidence intervals, which reflect uncertainty in model inputs that do not vary between scenarios: hardware price-performance, training run duration, and the distribution of compute over AI models. Note: these projections are likely to be smaller than total model counts as a compute threshold falls further behind the frontier, since lower-compute models are less likely to meet Epoch AI’s notability criteria or be publicly documented.
Training compute thresholds have been used as a mechanism for regulation of advanced AI, for example in the EU AI Act. Our results highlight that any regulation based on training compute thresholds would need to cope with a large number of qualifying models, or would need to increase the threshold over time.
Introduction
The amount of compute used to train AI models is a useful proxy for their capabilities. This is evident from the link between training compute and AI benchmark performance. This is one reason why training compute thresholds are increasingly being used to identify AI models of interest. For example, the EU AI Act uses a threshold of 1025 floating point operations (FLOP) to identify models that pose “systemic risks”. At Epoch AI, we have been tracking models that exceed 1023 FLOP and 1025 FLOP. However, analysis of how many AI models will be trained above different thresholds in the future remains scarce.1
This work helps bridge the gap between the research on training compute trends and the uncertainty around AI model counts. We achieve this with a projective model that relates key inputs of AI development to the number of AI models at different levels of training compute. Informed by historical trends in key inputs such as investment, and concentration near the frontier of AI, we apply this model to three distinct scenarios of future AI development. These scenarios illustrate the range of outcomes in how many models will exceed a compute threshold in the coming years.
Our analysis can inform the feasibility of training compute thresholds as a regulatory tool, and provide evidence on how large and dynamic the AI ecosystem will become. For example, our results suggest that the total number of models above 1026 FLOP will quickly grow from a few in 2025, to over 200 by 2030. This rapidly increasing count could make it difficult to operate as a regulatory threshold after a few years.
The rest of this report provides further details on the projective model, the scenarios, and the results. The Methodology section clarifies which models are included in our analysis and how we developed the three scenarios of AI development. The Results section breaks down our predictions over time for different compute thresholds, along with some validation of the model’s predictions. We conclude by discussing broader limitations and areas for further research.
Methodology
Overview
We aim to predict the number of notable AI models exceeding specific training compute thresholds, based on historical trends and various scenarios for AI investment and development dynamics. This is in contrast to previous work, which mostly has focused on trends in training compute, but without predicting anything about how many models reach a given level of compute. In particular, we focus on modelling how many training runs will exceed a given compute threshold.
To predict the training compute of future models, we decompose AI model production into six key inputs, listed in Table 1. This decomposition lets us examine how different scenarios of AI development would affect the resulting distribution of model training compute. In this work we model three scenarios: a median scenario, continuing recent trends; and aggressive and conservative scenarios reflecting plausible extremes for future development trajectories. We discuss these scenarios further in Scenarios based on AI investment and model development.
| Input | Description | Varied between scenarios? |
|---|---|---|
| Investment in the largest training run | Hardware acquisition cost for the computing cluster | Yes |
| Number of models near the largest training run | Models with >10% of the compute of the largest training run, used to adjust the historical compute distribution | Yes |
| Total number of models per year | Notable AI models published annually | Yes |
| Hardware price-performance | FLOP/s per dollar achieved by hardware in the largest training run | No |
| Training run duration | How long the largest training run lasts | No |
| Distribution of compute over AI models | Historical distribution of training compute across models | No |
Table 1: Six key inputs to the projective model. Inputs that are not varied between scenarios are still modeled probabilistically, contributing to the confidence intervals of the projections.
Figure 3 illustrates our approach to projecting AI model counts based on the six key inputs. We begin by projecting the training compute for the largest training run in each future year, combining our estimates of investment in training hardware, hardware price-performance, and training run duration. The different development scenarios we model involve varying the expected future growth of these parameters.
Next, we model how training compute will be allocated across different models. This allocation follows the historical distribution of training compute, which we adjust based on how many models we expect to cluster near the frontier of compute. Again, scenarios for this input are informed by recent trends and plausible deviations from trend. We then extrapolate the total number of notable AI models that will be developed each year.
Finally, we draw samples from our projected training compute distribution according to the projected total model count. This sampling process allows us to determine how many models will exceed specific compute thresholds—such as 1026 FLOP—under each scenario.

Figure 3: Overview of our projective model for AI model counts. The model takes six key inputs and combines them to project future model counts above different compute thresholds. The process flows from specifying the compute for the largest training run, through modeling the distribution of compute across all models, to finally sampling and counting models that exceed specific thresholds.
The rest of this section will cover the following: (1) the dataset used to analyze historical trends and define the scope of included models, (2) three AI development scenarios based on these trends, illustrating a range of possible outcomes in AI model count, (3) the definition of the six key inputs, with three varied between scenarios and three held fixed, (4) a sensitivity analysis of the projections, and (5) the limitations of the projective model.
Dataset and inclusion criteria
To inform our projections, we use historical data from the Epoch Notable AI Models dataset. The dataset collects AI models satisfying any notability criteria: highly cited, large training cost, significant use, state-of-the-art performance, or historical significance.2 Where practical, it then documents many key details from their development, such as training compute, authors, date, etc. This dataset has previously been used to investigate trends in training compute, costs, and other important factors in AI development.
Using this dataset, we project the number of notable AI models that involve a distinct training run exceeding some compute threshold. This means that post-training runs are not counted separately: for example, GPT-4o counts as one model, while DeepSeek-R1 and DeepSeek-V3 together count as one model, since R1 is post-trained from V3. This avoids counting a potentially large number of post-trained variants that are difficult to track, but some of those variants could be significant in their own right. This definition may also be narrower than some policy frameworks if they count each deployed variant separately.3
As our dataset cannot achieve comprehensive coverage of every AI model, it is also important to reflect on what population of models it does cover, and how that might affect our projections. There are three main points to consider, which are explained below.
To be included in the dataset, an AI model has to be publicly known. This means that the data is likely to have a reporting lag, where publication or release occurs some time after the training run is conducted. Models that have never been publicly revealed will not be included. In general, it is likely that the largest AI models developed at a given time will be publicly known, whereas smaller AI models may not be.
To be eligible for inclusion, an AI model must meet the notability criteria. In practice, this is likely to mean that there is less coverage of smaller AI models. For instance, there are at least 324 models likely to be above 1023 FLOP now, but only 156 of those are considered notable. This suggests that our projections are likely to cover only a fraction of models that are three or more orders of magnitude from the frontier.
Some notable models have not reported their training compute, and hence there is no training compute value for these in the dataset. However, including all notable models would have a relatively small impact on our projections. To be sure, the total number of notable base models per year is higher than the total number with known training compute values, e.g. 70 vs. 44 in 2023. However, the former number has grown more slowly: 12% vs. 18% annually since 2010. This leads to extrapolations of 88 vs. 61 models in 2025, and 155 vs. 140 models in 2030. The difference between these two extrapolations is much smaller than the difference between our “conservative” and “aggressive” scenarios of AI development.
In short, these projections are best understood as covering a particular reference class: “AI models that involve a new training run which exceeds some compute threshold, and would hypothetically be included in the Notable Models dataset after their release”. Forecasting this population should capture the fundamental dynamics of model counts growing over time for a given threshold, although predictions about post-trained model variants would require further investigation, and is out of scope for this work.
Scenarios based on AI investment and model development
To illustrate the range of possible outcomes in AI model count, we apply our projective model to three scenarios of future AI model development. These scenarios are defined using three of the six key inputs, which are detailed in subsequent sections:
- Investment in the largest training run. This input directly impacts the scale of the largest training run in a given year. Increasing this input in the projective model shifts all of the model counts to higher training compute thresholds.
- Total number of models per year. This is the number of notable AI models published each year, across all levels of training compute. Increasing this count reflects a larger AI ecosystem, and increases the number of models at every training compute threshold.
- Number of AI models near the largest training run. This is the number of notable AI models with >10% of the training compute of the largest training run. Increasing this count reflects a lower concentration of compute near the frontier, and moves models from lower thresholds to higher thresholds.
We used these three inputs to define the scenarios because they are interpretable, backed by empirical data, and have a relatively large impact on the predictions (see Sensitivity analysis). The other three inputs to the projections were held fixed—hardware price-performance and training run duration have much less impact on the projections, and the distribution of compute across AI models is less interpretable. However, the uncertainty in these other three inputs is still captured by the confidence intervals for each scenario.
To design the three scenarios, we started with historical trends related to the inputs, such as training cost. We then considered how trends could change in the future, examining previous modeling on the potential constraints to scaling compute through 2030. The trajectories were also informed by infrastructure plans announced by frontier AI labs. After prototyping the scenarios based on this evidence, we did a sense-check on the total resources implied by all of the projected training runs combined. We found that the implied total power demand was unreasonably high in 2030 for the median and aggressive scenarios, which led us to reduce the investment input for the final scenarios. Details of this sense-check are in Appendix A.
As a final source of information for the scenarios, we elicited subjective forecasts from 13 Epoch AI staff on the 24th of March, 2025. Staff were asked for a median and [10th, 90th] percentile forecast of investment in the largest training run in 2028, and the number of AI models near the largest training run in 2027. The trajectories we chose for these two inputs roughly intersect the average forecast across staff members, demonstrating that our scenarios align with researcher judgement.
The “median” scenario simply extrapolates historical trends in the three inputs until 2030, resulting in our median prediction. We assume that growth in investment, hardware efficiency and training time can sustain the training compute trend of 4.6x per year, leading to a $200B training cluster by 2030. The total number of AI models per year continues to grow by 18% annually, while the number of models near the largest training run continues growing at its slower rate of 11% per year. These inputs lead to a prediction of 235 models above 1026 FLOP by 2030. In 2030 and beyond, investment slows down due to constraints in the buildout of power and chip manufacturing.
The other two scenarios represent plausible extremes in the number of models above a compute threshold. The “conservative” scenario assumes that AI progress falls short in the next two years. Hardware clusters that are already under construction get completed, but investment plateaus afterwards, reaching $30B for one hardware cluster by 2030.4 In addition, only one or two AI developers sustain this level of investment, leading to just 3 models near the frontier each year.5 This conservative scenario predicts 61 models to be above 1026 FLOP by 2030.
The aggressive scenario instead assumes that AI development is both lucrative and widely distributed in the next few years. It predicts 528 models above 1026 FLOP models by 2030. In this scenario, investment booms on the back of accelerating AI progress, but still becomes constrained by power supply and available capital, reaching about $1 trillion for the largest hardware cluster by 2030. Investment is also more distributed across models, with over 50 models near the frontier in 2030, and over 300 notable models in total.
The following three sections provide more detail on how inputs are defined for each scenario.
Investment in the largest training run
We measure the investment in the largest training run each year as the hardware acquisition cost: the up-front capital cost of GPUs, other server hardware, switches and cables in the computing cluster. In the projective model, increasing this investment shifts all of the model counts to higher training compute thresholds. The trajectory of investment for each AI development scenario is shown in Figure 4 and explained in Table 2.

Figure 4: Trajectories for investment in the largest training run under the three scenarios of AI development. The forecast by Epoch staff shows the average subjective forecast of 13 Epoch AI staff from March 2025.
| Scenario | 2030 value | Why this might happen |
|---|---|---|
| Median | $200B | The historical trend is about 3x/year.6 Revenue is growing at a similar pace recently, so we expect the trend can and will continue until 2030.7 After 2030, the growth in investment slows to 20%/year as scaling becomes constrained by the supply of power and chips (see the Sense check section for analysis). |
| Conservative | $30B | Clusters that are already under construction (on the order of $10B) are put to use, but larger training runs aren’t conducted, for example due to disappointing AI progress.8 Investment plateaus thereafter. |
| Aggressive | $1T | Investors are convinced that widespread AI automation is imminent, anticipating trillions in revenue from AI within a decade. Infrastructure is built faster than expected due to frontier AI labs bypassing red tape.9 This enables a $1 trillion cluster by 2030. Investment then slows to 30%/year due to power constraints.10 |
Table 2: Summary and rationale for the investment input in each AI development scenario.
Total number of models per year
The “total number of models per year” input represents the number of notable AI models published in each year, across all training compute scales. Our projections for this input are based on the number of notable models with known training compute estimates. Increasing this number reflects a larger AI ecosystem, and increases the number of models at every training compute threshold. The trajectory of counts for each AI development scenario is shown in Figure 5 and explained in Table 3.
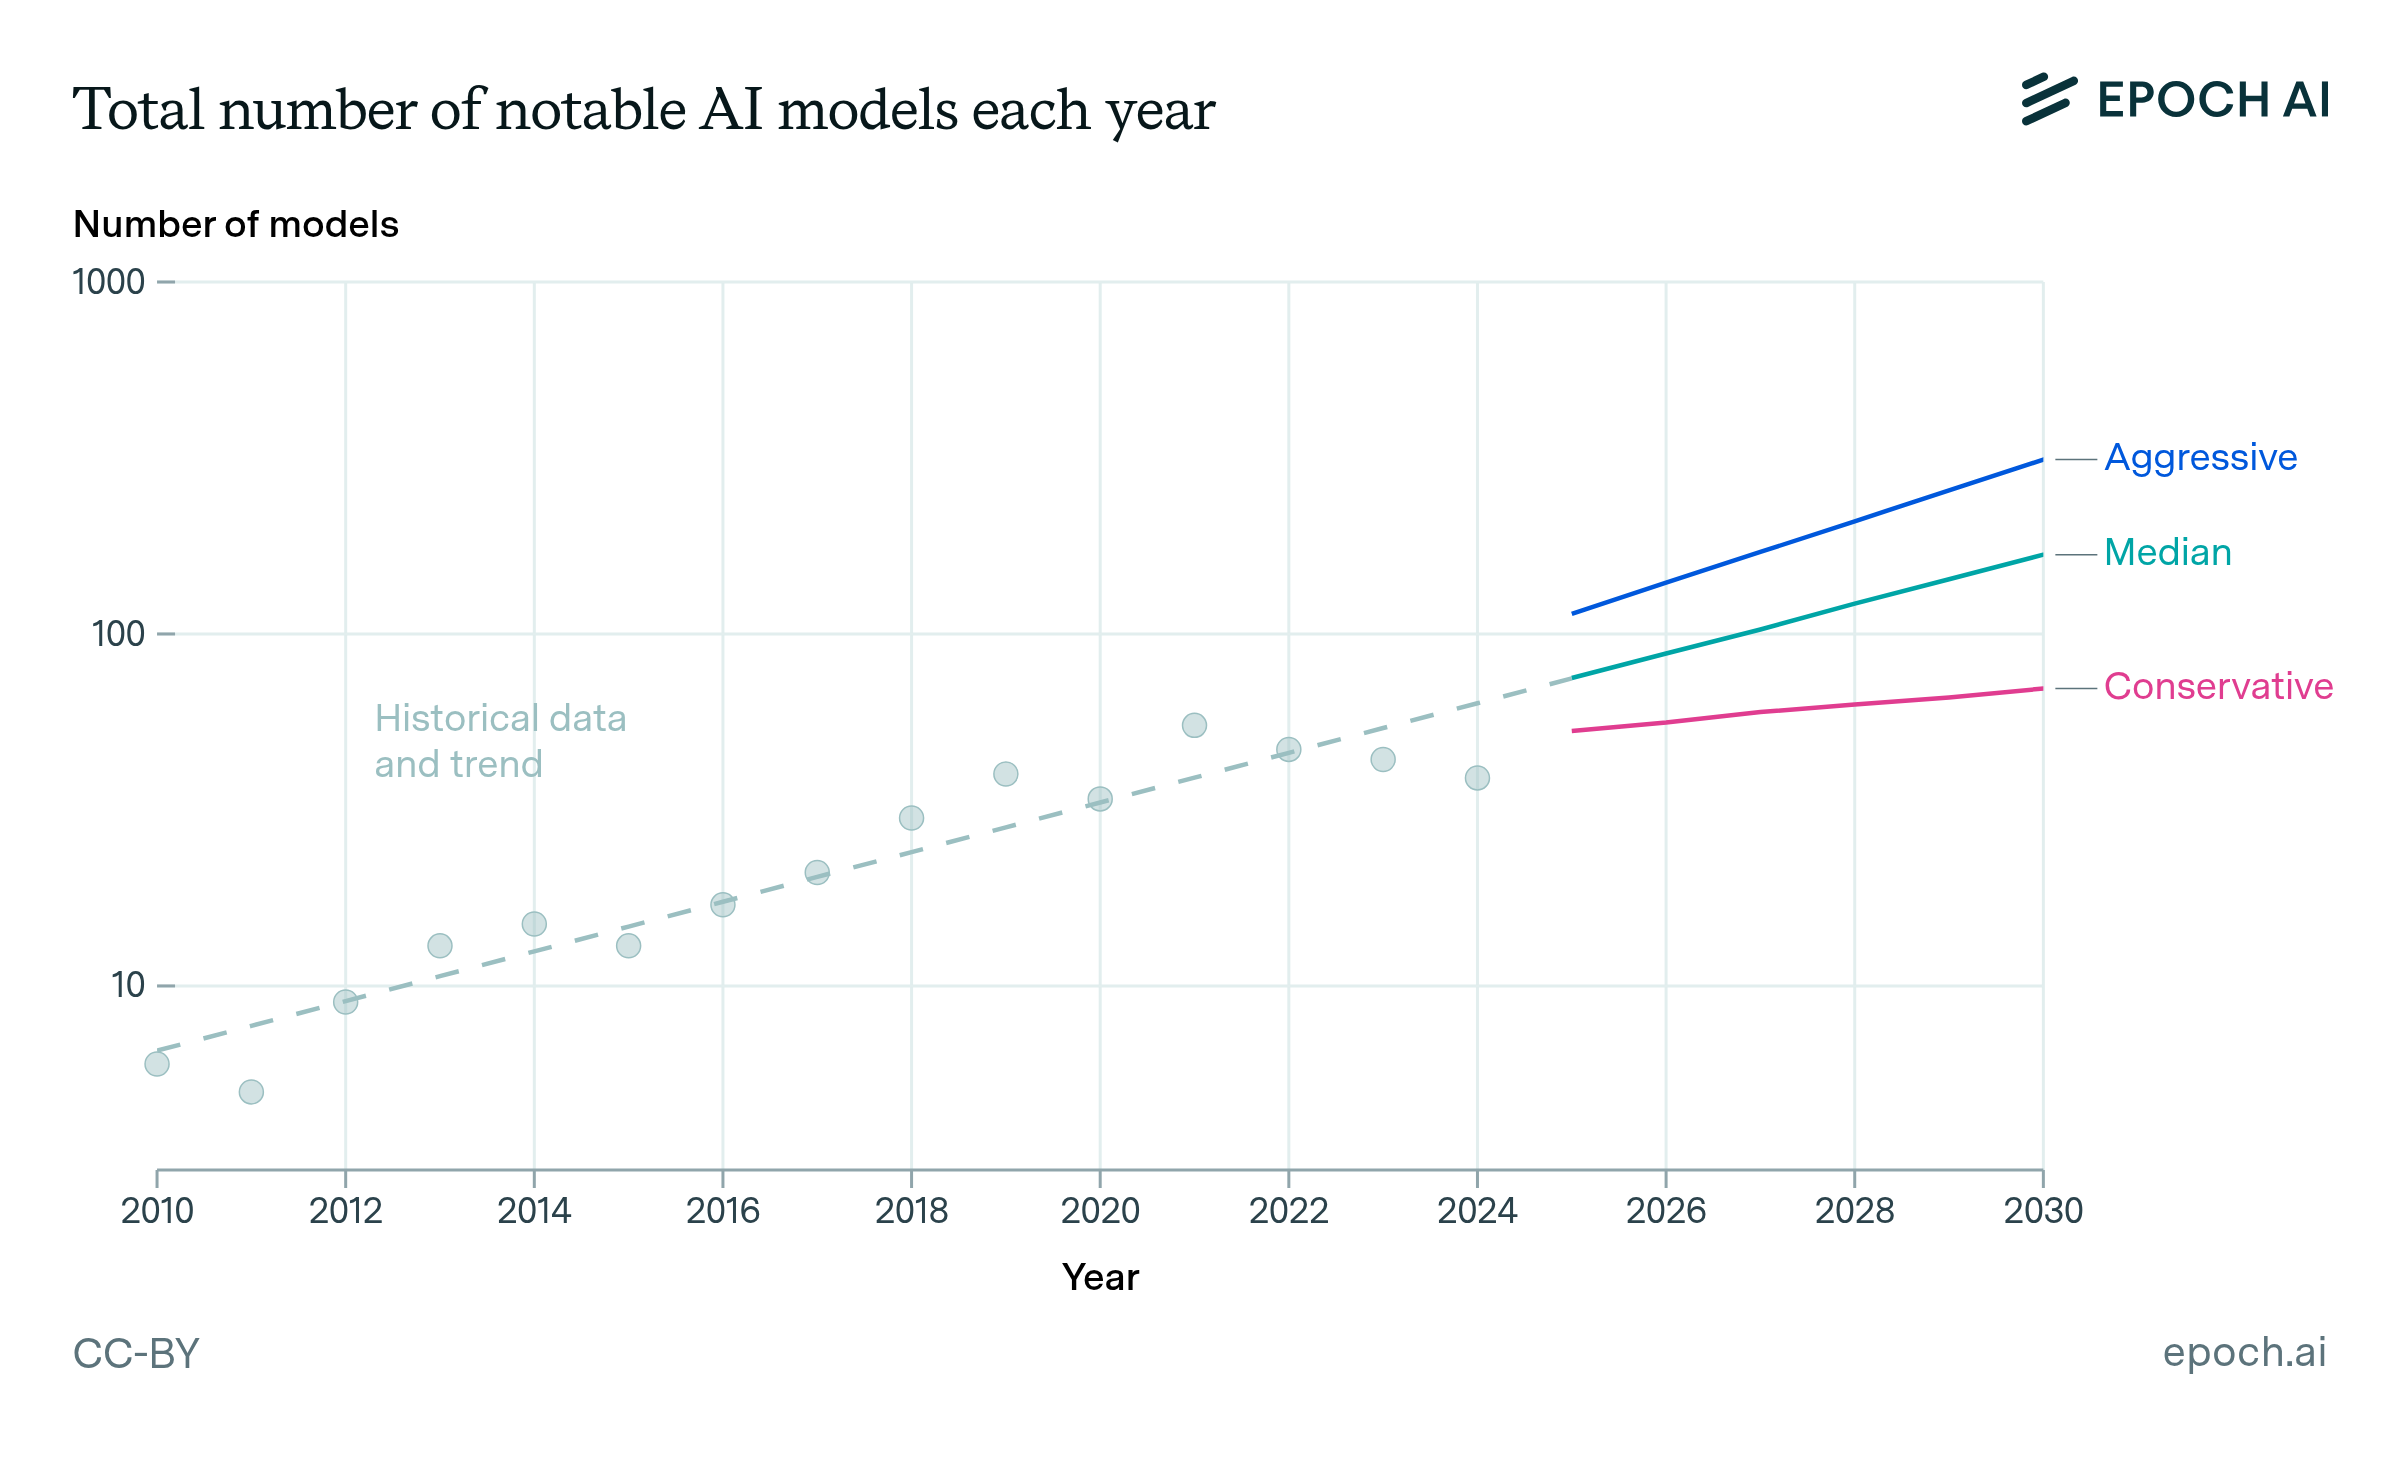
Figure 5: Trajectories for the total number of notable AI models per year under the three scenarios of AI development.
| Scenario | 2030 value | Why this might happen |
|---|---|---|
| Median | 162 models | This extrapolates 18% annual growth in the number of notable AI models that have training compute estimates, since 2010. |
| Conservative | 68 models | This instead extrapolates a linear trend that adds 3–4 models to the new count each year. This trend fits the historical data slightly better than an exponential from 2010–2024.11 |
| Aggressive | 310 models | Historically, the number has decreased slightly since 2021. We assume that this decrease is entirely due to reporting lag,12 and therefore extrapolate 25% annual growth from 2010–2021. |
Table 3: Summary and rationale for total number of models per year in each AI development scenario.
Number of models near the largest training run
The “number of models near the largest training run” input represents the number of notable AI models with >10% of the training compute of the largest training run. Increasing this count reflects a lower concentration of compute near the frontier, and moves models from lower thresholds to higher thresholds. The trajectory of counts for each AI development scenario is shown in Figure 6 and explained in Table 4.

Figure 6: Trajectories for the number of notable AI models near the largest training run under the three scenarios of AI development.
| Scenario | 2030 value | Why this might happen |
|---|---|---|
| Median | 11 models | This extrapolates 11% annual growth in the historical count since 2010. The total number of notable models has grown faster at 20%/year, so in relative terms, compute is slightly less concentrated in the largest training runs over time. |
| Conservative | 3 models | The historical trend is weak, so the historical median of 3 models is a reasonable prediction in any given year. This leads to a higher concentration of compute near the largest training run.13 |
| Aggressive | 56 models | This count grows at a constant 18% fraction of the “aggressive” total model count value.14 This is more aligned with the rapid increase in count seen from 2019 to 2024. The high number of models near the frontier makes compute less and less concentrated in the largest training runs over time, leading to a diffuse AI ecosystem. |
Table 4: Summary and rationale for number of models near the largest training run in each AI development scenario.
Distribution of compute over AI models
To predict how training compute will be allocated across future AI models, we use the historical distribution of compute relative to the largest training run. This compute distribution shows a fairly consistent pattern from 2010 to present: AI development features a heavy-tailed distribution, with a small number of models at the compute frontier and many models trained with smaller amounts.
However, there is reason to expect the number of models near the frontier to change over time due to factors like competition, access to compute, or strategic decisions by AI developers. To account for this, we allow the number of models near the largest training run to vary as one of our key scenario inputs, informed by recent trends. This requires modifying the historical distribution to reflect future changes while preserving its overall shape.
The distribution we start with is the normalized histogram of values from 2010-2024 (Figure 7), where values are expressed as fractions of the largest training run. We chose this full historical period for simplicity and because we found no clear trend in the distribution’s shape year-over-year. However, the shape does vary significantly between years: using distributions from particularly different years (2010 vs 2017) can change predicted model counts by up to 2x.

Figure 7: The default distribution of AI training runs across different compute scales that we use for prediction. The distribution is a histogram of residuals from a log-linear regression model, fitted to the training compute of notable AI models from 2010 to 2024. These residuals are scaled and shifted such that the largest training run is equal to 1.
We then reshape this distribution to output the specified number of models near the largest training run, while preserving the total model count (Figure 8). This reallocates models between compute scales without changing what the frontier itself is.

Figure 8: Overview of how we truncate the empirical distribution of compute runs over different training runs, to model a certain density at the right end of the distribution. This density is determined by another key input to the model: the number of models near the largest training run.
Hardware price-performance
Another key input in our model is hardware price-performance, shown in Figure 9. This input represents the FLOP/s per dollar achieved for the hardware used in the largest training run. It is combined with the investment input to determine the total FLOP/s achieved by the largest training run in each year.
Our projection uses the NVIDIA H100 GPU as a starting point, and combines separate trends in hardware efficiency and hardware price. Although the NVIDIA H100 was first available in September 2022, we place it in July 2023 to account for a delay in AI models being trained using this hardware and then published.15 The peak performance that could be achieved with the H100 at this time has an 80% confidence interval of 990e12 FLOP/s (corresponding to 16-bit precision) to 1,979e12 FLOP/s (8-bit precision). We assume a utilisation rate of 20–60% based on the range of values in our historical data.
We extrapolate hardware performance at about 1.4x/year based on the historical trend in the performance of leading ML hardware. A confidence interval of 1.3–1.6x/year accounts for uncertainty in this trend, as well as potential gains in performance from a potential drop to 8-bit and even 4-bit precision. To calculate price-performance we divide performance by the hardware purchase price, starting at about $24–48k for the H100, which includes server and networking costs per chip. This price grows at 1.0–1.2x/year based on the historical trend in ML hardware prices over time, as reported in this data hub (filtering Cerebras CS-2 and CS-3 as outliers). The resulting projection of price-performance grows at 1.3x/year in the median case. This is close to an estimate of 1.4x/year from previous work (which was reported as a doubling time of 2.1 years).

Figure 9: Projection of realised hardware efficiency per chip, which is used to project the number of AI models above compute thresholds. The realised hardware efficiency corresponds to the best chip available for AI training, factoring in the utilisation rate achieved during training. We are uncertain about utilisation and numerical precision, so our starting point could represent 16-bit at 50% or 8-bit at 25%. The 80% CI is bootstrapped from 1000 iterations.
Training run duration
The sixth and final key input in our projective model is training run duration, shown in Figure 10. This input describes how long the largest training run lasts. It is combined with the investment and hardware price-performance inputs to determine the compute for the largest training run each year.
Our projection uses 100 days as a starting point based on recent data points like Grok-3 and GPT-4. The 10th-percentile projection assumes that frontier training runs stay at this duration, due to competitive pressure to release better models frequently. The 90th-percentile projection assumes initial growth of 31% per year based on the 90th percentile of the historical trend, before plateauing to about 9 months after 2030. This plateau of 9 months is an estimated upper bound assuming that AI developers optimise the timing of training runs for performance per dollar. The median trajectory is calculated assuming a log-normal distribution with these percentiles, initially growing at about 13% per year.

Figure 10: Projection of frontier training run duration, which is used to project the number of AI models above compute thresholds. The 80% CI is bootstrapped from 1000 iterations.
Sensitivity analysis
We performed a sensitivity analysis of our model to assess its robustness and identify inputs that deserved more careful analysis. We measured sensitivity by varying one input between two extremes (either the “conservative” and “aggressive” scenario values, or 10th and 90th percentiles), while holding other inputs constant. We then calculated the relative change in the predicted number of models above 1026 FLOP. The relative changes are shown in Figure 11, indicating how sensitive the results are to each input.
Initially, our predictions are highly sensitive to the number of models near the largest training run, yet this input becomes relatively unimportant by 2030. This is because the sensitivity analysis only pertains to the number of models above 1026 FLOP. After 2028, all three scenarios predict that the frontier of training compute will be well past this level, so most of the models above 1026 FLOP won’t be near the frontier.
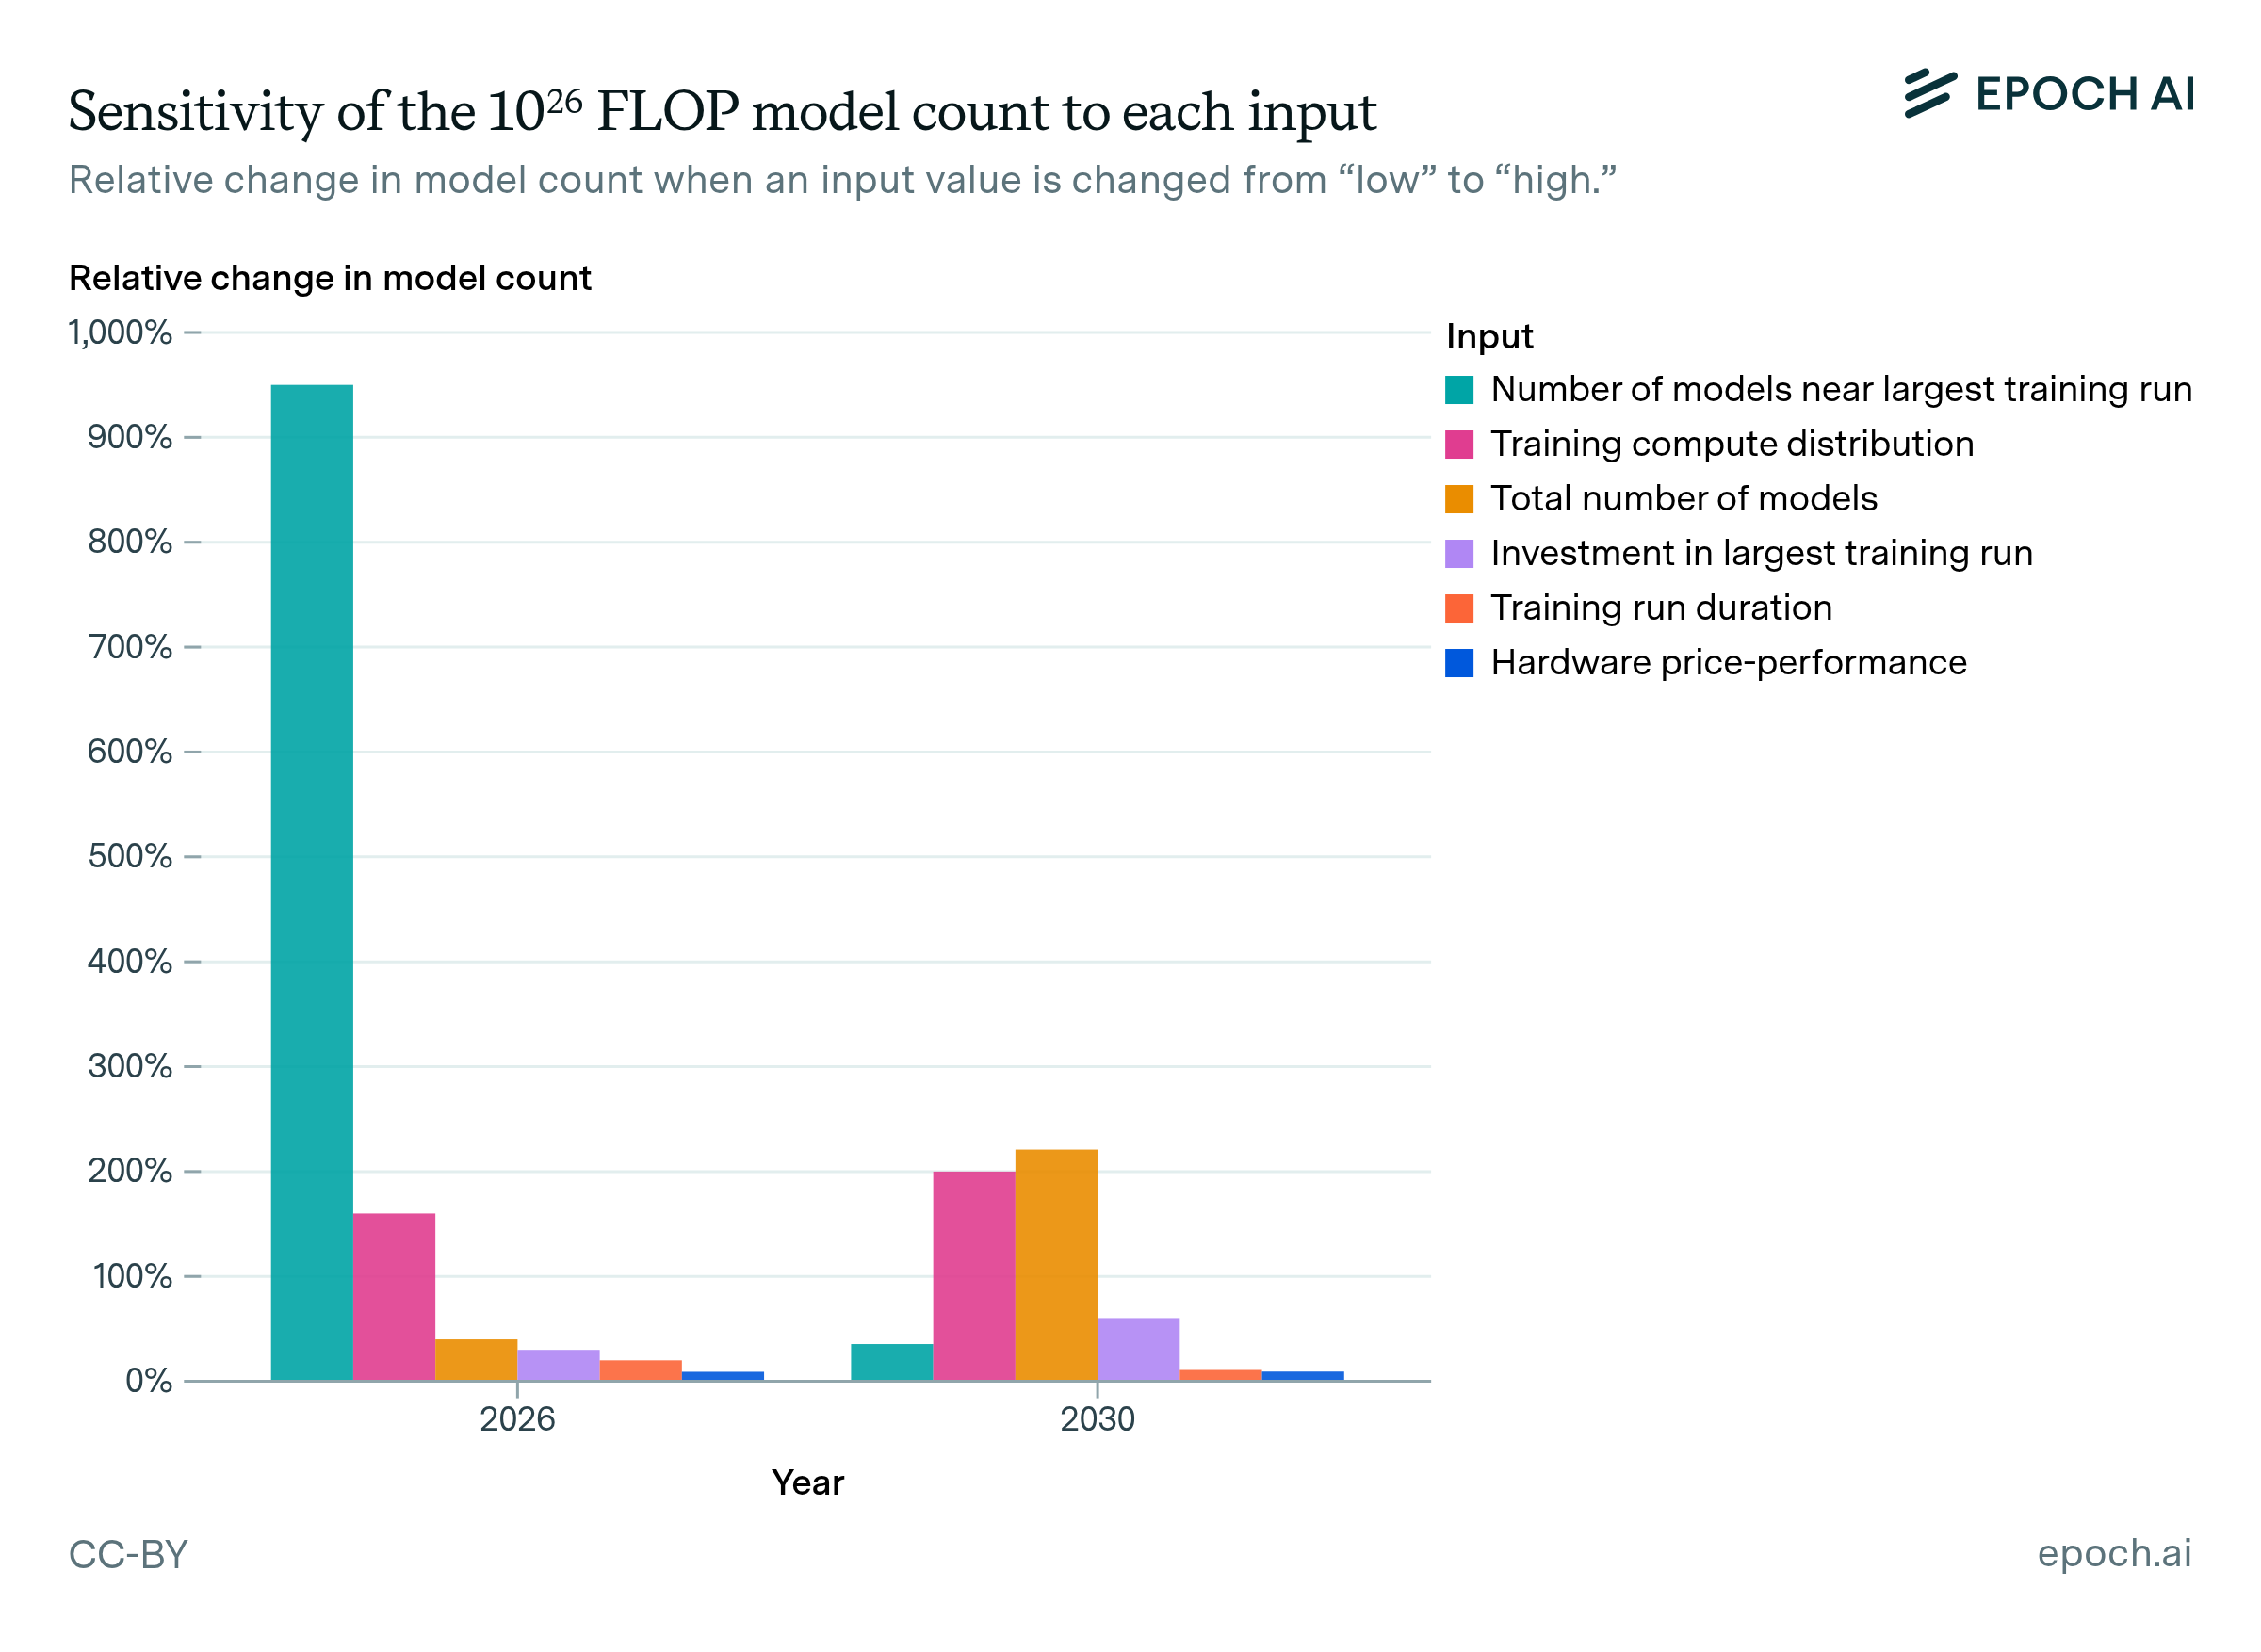
Figure 11: Sensitivity of the projected model counts to each input. We changed one input at a time from its lowest to highest value, as defined in previous sections. For “Training compute distribution”, we compared the distribution of FLOP in 2017 to the one in 2010, because these distributions had very different shapes. We then measured the relative change that resulted in the projected number of models above 1026 FLOP. The higher an input’s percentage change, the more the output is sensitive to it.
Our projections are more consistently sensitive to the distribution of compute across models, and the total number of AI models. The former determines how models are spread across compute thresholds, while the latter determines how many models are sampled from the distribution. The uncertainty in total model count increasingly impacts the number of models above 1026 FLOP over time, as this level of compute shifts from being the frontier in 2025 to being average in 2030. The investment input has a significant but lower impact on the results. We chose to vary investment in the scenarios even though it is less sensitive than the compute distribution, because investment is easier to define and interpret as a single value.
Finally, the sensitivity analysis shows that hardware efficiency and training time are unimportant to our predictions, even relative to investment. This is because our uncertainty in hardware efficiency and training time spans a factor of 3–10x, while our uncertainty in investment is much wider, spanning a factor of about 300x in 2030.
Limitations
Having explained the inputs and mechanics of our projective model, we now discuss some of its limitations.
Notable models vs. all models: We extrapolate from the number of notable AI models with training compute estimates. Broadly, notable models either set a new state-of-the-art, have a large influence in the history of AI, or have a large impact in the world. By definition, models near the frontier of training compute tend to be notable, and are well-covered by the dataset. However, models significantly below the frontier are less likely to be notable – for example, there are at least 324 models likely to be above 1023 FLOP now, but only 84 of those are notable and have specific training compute estimates. This suggests that 2-3 orders of magnitude below the compute frontier, our projection for notable models could be 4x or more smaller than the total number of models. This makes little difference to our qualitative findings, but is important to consider when examining results below the frontier of compute in a given year.
Historical distribution of compute: We model the distribution of compute across training runs based on historical data since 2010. We allow for adjustments in compute concentration at the frontier based on recent trends. This allows for simulation of different scenarios for the compute distribution, but is relatively coarse-grained. Although these assumptions held up fairly well in back-testing, they could become less valid over time, as the dynamics of AI development and deployment evolve. Future work might try to link economic models of AI development and inference to changes in this distribution.
Interaction between investment and other inputs: There are other potential interactions between investment, hardware price-performance, and training time. For example, if investment in AI is high, more effort might go into improving the hardware, and/or training times might get shorter if the improvements in hardware accelerate, making older hardware less appealing to work with by comparison. We do not explicitly model these interactions.
AI models developed each year: The number of notable AI models has increased overall since 2010. However, the number of notable models with known training compute has decreased slightly since 2021. We believe this is mostly a data coverage issue. For a small-scale model to achieve notability criteria, it might need to wait to accrue citations, or many users. Meanwhile, the largest models are generally immediately eligible due to their large training cost and (often) state of the art performance. Frontier AI developers have also tended to publish fewer training details in recent years, making it more difficult to estimate training compute. On the other hand, the decrease in model count could reflect a real trend to some extent. We incorporate this uncertainty into the scenarios.
Algorithmic progress: Algorithmic progress may alter trends in training compute and the number of models developed. However, there is little existing evidence by which to judge its effect on investment, and hence it is not explicitly modelled as an input.16 Estimates of historical algorithmic progress have wide confidence intervals, and projections of this progress are even more uncertain.
Broader changes in AI development: We have arguably covered the full range of economically plausible investment in AI training, but we have by necessity assumed that this is used in a familiar training compute paradigm. We do not attempt to model how extreme changes in algorithms or hardware could affect this allocation, nor the downstream effects they could have. For example, at the time of writing it is an open question how inference compute scaling will affect training compute scaling. However, the trend extrapolation approach we have used relies on trends that have been quite stable across significant shifts in AI development in the past 15 years. Backtesting shows that this approach is fairly effective even on a 5-year horizon (see Appendix C). We therefore expect it to provide a useful starting point for predictions through 2030.
Training data availability: the total effective stock of public data to train large language models is limited. However, this stock appears unlikely to limit AI scaling through 2030, and it’s likely that innovations—such as better techniques to train on AI-generated data—will make the existing stock of data less of a bottleneck. Constraints in power and chip manufacturing are likely to be more binding, and these constraints likely permit training compute to continue scaling at historical rates, which is reflected by our median scenario.
Results
We summarise results from the projective model in Figure 12 and 13. These results show the number of models at a given compute threshold accelerating over time, though the growth is slower than exponential. For example, the number of notable AI models above 1026 FLOP is projected to increase from 10 models by 2026, to 80 models by 2028, and over 200 models by 2030. At a higher threshold of 1027 FLOP, models emerge one year later but accelerate to reach over 100 models by 2030.
Figure 12: Median projection for future notable AI model releases with different levels of compute, by year. Shaded regions indicate 80% confidence intervals, which reflect uncertainty in model inputs that do not vary between scenarios: hardware price-performance, training run duration, and the distribution of compute over AI models. Note: these projections are likely to be smaller than total model counts as a compute threshold falls further behind the frontier, since lower-compute models are less likely to meet Epoch AI’s notability criteria or be publicly documented.
Figure 13 shows how different scenarios quickly affect how many >1026 FLOP models are developed, with between 10 and 80 such models by 2027. These differences get more pronounced over time, such that by 2030, there could be between 60 and 500 models with more than 1026 FLOP.

Figure 13: Reproduction of Figure 2, comparing the median extrapolation to two alternative scenarios. The “conservative” and “aggressive” scenarios represent plausible extremes in the model counts. The model counts accelerate across all scenarios, reaching tens to hundreds of models by 2030. Shaded regions indicate 80% confidence intervals, which reflect uncertainty in model inputs that do not vary between scenarios: hardware price-performance, training run duration, and the distribution of compute over AI models. Note: these projections are likely to be smaller than total model counts as a compute threshold falls further behind the frontier, since lower-compute models are less likely to meet Epoch AI’s notability criteria or be publicly documented.
The differences between scenarios are larger for higher compute thresholds, such as 1028 FLOP (see Figure 14). Here, it makes a large difference at what absolute level the scenarios predict slowdown around 2030. In the “conservative” scenario, no models above 1028 FLOP are developed until 2029, whereas in the other scenarios they appear in 2027 (“aggressive”) or 2028 (“median”). This emphasises how the key uncertainties can make a major difference to the trajectory of AI.

Figure 14: Comparison of the cumulative model counts at a 1026 and 1028 FLOP threshold, under the three scenarios. These results illustrate how higher training compute thresholds screen for much fewer models initially, but the model count still grows rapidly. Error bars indicate 80% confidence intervals, which reflect uncertainty in model inputs that do not vary between scenarios: hardware price-performance, training run duration, and the distribution of compute over AI models. Note: these projections are likely to be smaller than total model counts as a compute threshold falls further behind the frontier, since lower-compute models are less likely to meet Epoch AI’s notability criteria or be publicly documented.
Overall, our projections of AI model counts through to 2030 look plausible under the expected power constraints. Note that our estimates of total power capacity for AI are intended as a rough sense check for our model count projections, and should not be interpreted as a forecast in and of itself. More research is needed on the feasibility of scaling up power supply to meet the projected demand.
Conclusion
Our projections suggest a rapid expansion of AI development over the next few years, with about 200 models exceeding 1026 FLOP by 2030 in our median scenario, and alternative scenarios ranging from 60 to 500 models. These findings have important implications for what the AI ecosystem will look like. A fixed threshold of compute, while initially covering a small number of frontier models, would encompass hundreds of models within a few years. To implement regulation based on this fixed threshold would require either a scaling of regulatory capacity, or dynamic thresholds that evolve with technological progress.
There are important limitations to these projections. The number of AI models depends on the definition of an AI model. The appropriate definition is the subject of ongoing debate, and our definition may differ from regulatory definitions. Algorithmic improvements will continue to enhance the capabilities that can be achieved at fixed compute levels, meaning static thresholds will likely govern increasingly capable models over time. However, the pace of algorithmic progress is not well-determined, and existing estimates range between 1.8x/year and 5.3x/year. Additionally, our model does not account for events like global conflicts or natural disasters that could dramatically alter the trajectory of AI development. Perhaps more relevantly, we do not account for regulation itself impacting the number of AI models above a threshold.
These insights point to three priorities for future work. First, policymakers may want to assess the trade-offs involved in fixed vs. dynamic training compute thresholds. Second, it is useful to forecast the number of AI developers releasing AI models of interest, as this provides context on how competitive AI development will become. Finally, improving on our model of AI development, and integrating the economics of AI in particular, would make our predictions more reliable. Addressing these areas will help anticipate future trends in the AI ecosystem as capabilities continue to rapidly advance.
Acknowledgements
We thank the following people for their feedback and contributions:
- Edu Roldán and Matej Vrzala for implementing the interactive tool and the figures
- Robert Sandler for designing the figures, and the user interface of the interactive tool
- Mayank Adlakha from the UK Department for Science, Innovation and Technology, for his support and input throughout the project
- Epoch AI staff for their forecasts and feedback, which helped calibrate the scenarios and validate the model’s assumptions
- Alexander Erben and Romeo Dean for their feedback on a draft of the report
Appendix A: Sense-check on the total resources needed for AI development
As a sense check, we estimated the total power demand, hardware investment, and chip demand for training all of the notable AI models that we predict to exist. These quantities are important to check because our scenarios only specify investment into the largest individual training run. Resources are in fact distributed across many AI models, making the total resources significantly larger. For example, in the median scenario, total training compute across all AI models is projected to be about 5x larger than the largest individual training run.
We performed this check on preliminary versions of the scenarios, and concluded that the total power requirements in 2030 were too high in both the “median” and “aggressive” scenario. This led us to reduce the investment in the largest training run in 2030 from roughly $300 billion to $200 billion in the median scenario and from $2 trillion to $1 trillion in the aggressive scenario. After this change, we believe it’s feasible to meet the total resource demand implied by our scenarios, though the aggressive scenario still relies on aggressive assumptions. Power appears to be the strongest constraint to scaling through 2030, so we focus on that here.

Figure A1: Total power capacity needed for all AI models predicted by our projective model. Sources: SemiAnalysis for the 2024 AI power capacity estimate; You et al. (forthcoming) for the 2030 AI power demand estimate; EIA for the 2024 global power capacity estimate, assuming 5% growth from the reported 2023 value.
Our estimates of total resources are based on adding up the projected FLOP for all models in each future year, and calculating how many state-of-the-art chips would be needed to perform that many FLOP across the entire year. We assume all chips are state-of-the-art because this is likely to be true of training runs near the frontier, which dominate the calculation. To calculate the total investment and power required, we then multiply the total chip count by the estimated cost per chip and power per chip, respectively. The estimate of power demand implicitly assumes that all training hardware runs year-round, but individual training runs can be allocated to this hardware at different times, depending on the compute requirements.
For context, the total power capacity used for AI data centers globally in 2024 was estimated at 11 GW by SemiAnalysis, based on industry data on AI data centers. We expect this capacity to reach on the order of 100 GW by 2030. This is based on a report by You et al. (forthcoming), which analyzes projections of total data center power demand using various methods and sources. They find that estimates centered around 100 GW globally by 2030, with around 50 GW in the US. Further support for this ballpark number comes from a RAND report, which presents several forecasts of global demand by 2030 that range from 45 GW to 327 GW.
Looking at the calculations in Figure A1, our median projection of AI model development implies a total power demand of 1 GW for AI training runs in 2026. This is much smaller than the estimated 11 GW of total capacity in 2024, so we expect 1 GW is achievable even with high demand for inference, research, and other applications. The “aggressive” projection implies about 5 GW, or about 50% of the estimated 2024 capacity. This still seems feasible if a large fraction of existing capacity is already used for training. A previous analysis provides support for this scenario, arguing that the AI training vs. inference allocation should not deviate far from 50-50.
By 2030, the total power demand implied by our projections increases to around 50 GW for the median scenario, and 700 GW for the aggressive scenario. For context, 50 GW is roughly the net Summer capacity of the state of Pennsylvania. Given that projections center around 100 GW globally for total AI power demand in 2030, having half of this allocated to training seems feasible. To reach 700 GW in the aggressive scenario would require a much faster and more distributed buildout than expected. The highest estimate of total power demand in this RAND report is also around 700 GW. So the aggressive scenario requires that (a) supply will match this high-demand scenario, and (b) almost all of this capacity is allocated to training, rather than research or inference. We believe this is plausible but unlikely.
Overall, our projections of AI model counts through to 2030 look plausible under the expected power constraints. Note that our estimates of total power capacity for AI are intended as a rough sense check for our model count projections, and should not be interpreted as a forecast in and of itself. More research is needed on the feasibility of scaling up power supply to meet the projected demand.
In addition to total power capacity, we estimated the total investment (Figure A2) and total chip demand implied by our projections of notable AI model development (Figure A3). In the aggressive scenario, total investment reaches up to $13 trillion in total hardware acquisition cost by 2030, which is almost half of United States GDP today and over 10% of global GDP. We believe this total hardware investment is plausible in a scenario where AI automates a large fraction of the global economy by 2030, but again unlikely.

Figure A2: Total hardware cost to train all of the AI models predicted to exist in each year, in each scenario of AI development. We show both the acquisition cost, and the amortised cost assuming that the hardware depreciates in value by 36% per year. The best estimate would fall in between these two costs, as some hardware clusters would train multiple AI models.

Figure A3: Total number of top-performing chips required to train all of the AI models predicted to exist in each year, in each scenario of AI development. The number of top-performing chips is calculated by dividing total training FLOP by the number of seconds per year, then dividing that by the best achievable hardware performance at the time. This accounts for performance improvements over time.
Appendix B: Reliability of the predictions
The projective model is designed to accurately model the scenarios we believe are most likely, but is less reliable past a five-year horizon (2030). As well as the inherent decrease in accuracy that comes with extrapolating further into the future, there is stronger evidence underpinning our projections in the shorter term. In particular, existing evidence supports the idea that AI scaling trends can continue through to 2030.
To evaluate the projective model’s calibration and generalisation, we backtested the model on historical data. When backtesting, we simply extrapolate the average trend in training compute, rather than rederiving it from hardware investment and the distribution of training compute. This extrapolation is based only on historical data up to some cutoff point, e.g. 2022. We then evaluate how well the extrapolation predicts model counts after that cutoff point, e.g. in 2024. We compare the predicted vs. actual number of new models each year, since that is what the extrapolation directly predicts.
As Figure B1 (left) shows, the 2-year extrapolation is off by a count of 5 on average, across four top compute thresholds. This is evidence that our model predicts the near term fairly well. Predictions are worse on a 5-year horizon (Figure B1, right), being off by 8.5 models on average. The worse accuracy on a longer horizon is unsurprising, especially given that 2019 predates large language models like GPT-3. Nonetheless, this predictive performance provides some assurance that our predictions through 2030 are in the right ballpark, even if AI development shifts significantly.

Figure B1: Results of backtesting the projective model on historical data. We split the historical data into “training” and “test” sets at a data cutoff of 2022 or 2019 (where e.g. data from 2019 is part of the training set), then fit the model to the training set, and evaluate its predictions in 2024.
-
The only other detailed analysis we are aware of was published just over one month ago.

-
Notability criteria are covered in more detail within the dataset documentation.
-
For example, these guidelines for the EU AI Act considers an AI model to be “distinct” if the modifications to an existing model use more than one-third of the original training compute.
-
Even in this conservative scenario, we expect a plateau rather than a downturn because the 15-year trend in training compute scaling, plus infrastructure plans, provide strong evidence for continued growth.
-
We define a model as “near the frontier” if its training compute is >10% of the largest training run so far.
-
Rather than fitting a trend to costs directly, this trend is derived from trends in training compute, hardware price-performance, and training run duration. We derive the trend this way so that the median scenario simply extrapolates training compute according to the historical trend.
-
We extrapolate from approximately $3 billion at the start of 2025, which roughly matches the cost of leading AI supercomputers at the time. For example, “Colossus Memphis Phase 1”, which trained the Grok-3 model, cost an estimated $4 billion.
-
For example, Bloomberg reports a cluster of 400,000 Nvidia chips under construction in 2025, to be completed by mid-2026. Assuming that the latest Nvidia GB200 chips are used, at $3M per 72-chip server, this would cost about 4e5 x 3e6 / 72 ~= $17B.
-
Precedent: the US Executive Order 14141, which makes federal lands available for frontier AI infrastructure, and calls to expedite the processing of permits to build this infrastructure.
-
We arrived at $1 trillion based on a sense-check against the total power required to train all AI models in 2030. The value was previously about $2 trillion, but this implied a total power requirement that would exceed the power capacity needed for all AI training and inference by 2030, even based on an upper-end estimate by RAND. The value of $1 trillion leads to a total power requirement that is just within this bound.
-
This selection is based on the lowest Bayesian information criterion, which was 71 for exponential vs. 59 for linear. However, other evidence supports exponential growth, which is why our median trajectory is exponential. Firstly, extending the time period to 2000–2024 switches the preferred model back to exponential (with a BIC of 112 vs. 124). Second, the number of AI publications has grown exponentially.
-
Evidence for this lag comes from a year-old snapshot of our database, which shows a decrease in notable model count that starts from an even earlier year. There’s also prior reasons to expect a lag. One reason is the citation count criteria requires enough time for a publication to reach 1000 citations, which can take years. Information about a model may also come to light long after publication.
-
The combination of low investment and high concentration of investment in the largest training run isn’t necessarily likely, but is a plausible combination that would lead to the lowest model counts.
-
The main reason we used a fraction of 18% is to make the “aggressive” predictions consistent with another Epoch AI staff forecast from July 2024, which had an average 90th percentile forecast of 25 models above 1026 FLOP by 2026.
-
We used a delay of 10 months, which is the average historical delay in our dataset across the NVIDIA P100, V100, A100 and H100, each of which were used to train between 15 and 313 AI models.
-
If AI capabilities will plateau at some level of training compute, and if algorithmic progress can be treated as “increasing effective training compute”, then faster algorithmic progress would lead to reaching this plateau sooner. Presumably, this would slow subsequent investment. Conversely, if there is no plateau in sight, faster algorithmic progress might accelerate investment, as the value of the next generation of models is higher. This has some support from the recent history of AI, where algorithmic progress and hardware investment seem to have scaled together. These outcomes somewhat coincide with the aggressive and conservative scenarios we have modelled, but without an explicit linkage to algorithmic progress.
About the authors


Related work