How much does it cost to train frontier AI models?
The cost of training frontier AI models has grown by a factor of 2 to 3x per year for the past eight years, suggesting that the largest models will cost over a billion dollars by 2027.

Resources
Summary of findings
The costs of training frontier AI models have grown dramatically in recent years, but there is limited public data on the magnitude and growth of these expenses. In our new paper, we develop a detailed cost model to address this gap, estimating training costs for up to 45 frontier models using three different approaches that account for hardware and energy expenditures, cloud rental costs, and R&D staff expenses, respectively. This work builds upon the cost estimates featured in the 2024 AI Index.
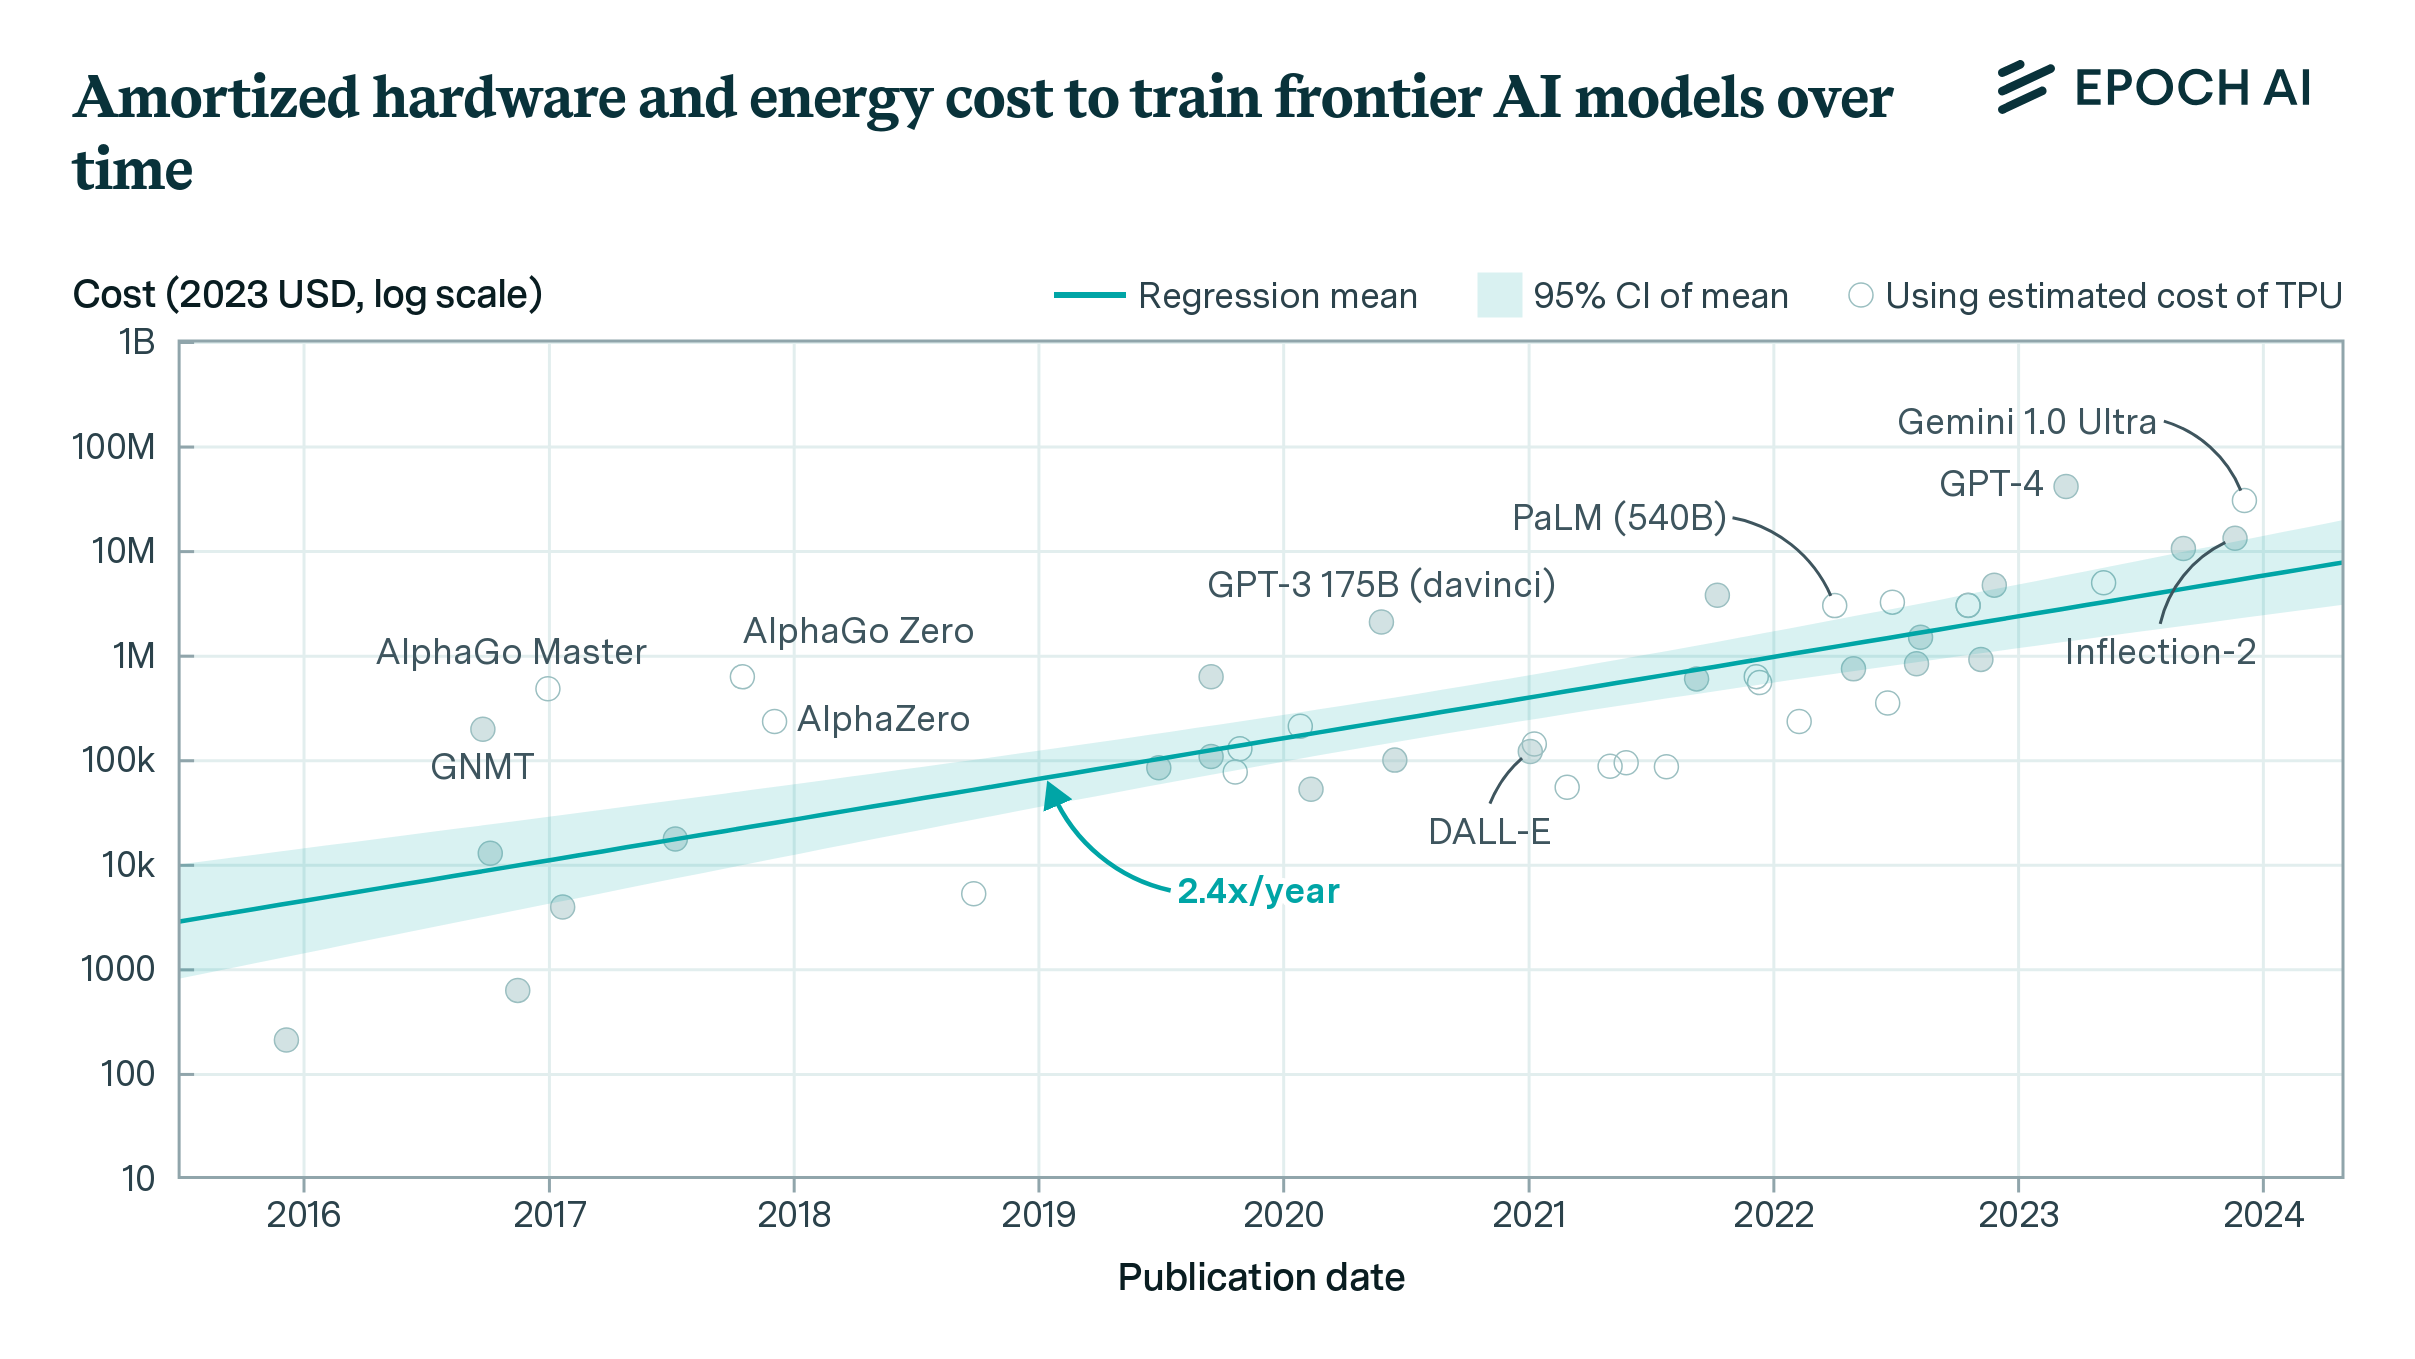
Our analysis reveals that the amortized hardware and energy cost for the final training run of frontier models has grown rapidly, at a rate of 2.4x per year since 2016 (95% CI: 2.0x to 3.1x). We also estimated a cost breakdown to develop key frontier models such as GPT-4 and Gemini Ultra, including R&D staff costs and compute for experiments. We found that most of the development cost is for the hardware at 47–67%, but R&D staff costs are substantial at 29–49%, with the remaining 2–6% going to energy consumption.
If the trend of growing training costs continues, the largest training runs will cost more than a billion dollars by 2027, suggesting that frontier AI model training will be too expensive for all but the most well-funded organizations.
Key Results
Our primary approach calculates training costs based on hardware depreciation and energy consumption over the duration of model training. Hardware costs include AI accelerator chips (GPUs or TPUs), servers, and interconnection hardware. We use either disclosures from the developer or credible third-party reporting to identify or estimate the hardware type and quantity and training run duration for a given model. We also estimate the energy consumption of the hardware during the final training run of each model.
Using this method, we estimated the training costs for 45 frontier models (models that were in the top 10 in terms of training compute when they were released) and found that the overall growth rate is 2.4x per year.
Figure 1. Amortized hardware cost plus energy cost for the final training run of frontier models. The selected models are among the top 10 most compute-intensive for their time. Amortized hardware costs are the product of training chip-hours and a depreciated hardware cost, with 23% overhead added for cluster-level networking. Open circles indicate costs which used an estimated production cost of Google TPU hardware. These costs are generally more uncertain than the others, which used actual price data rather than estimates.
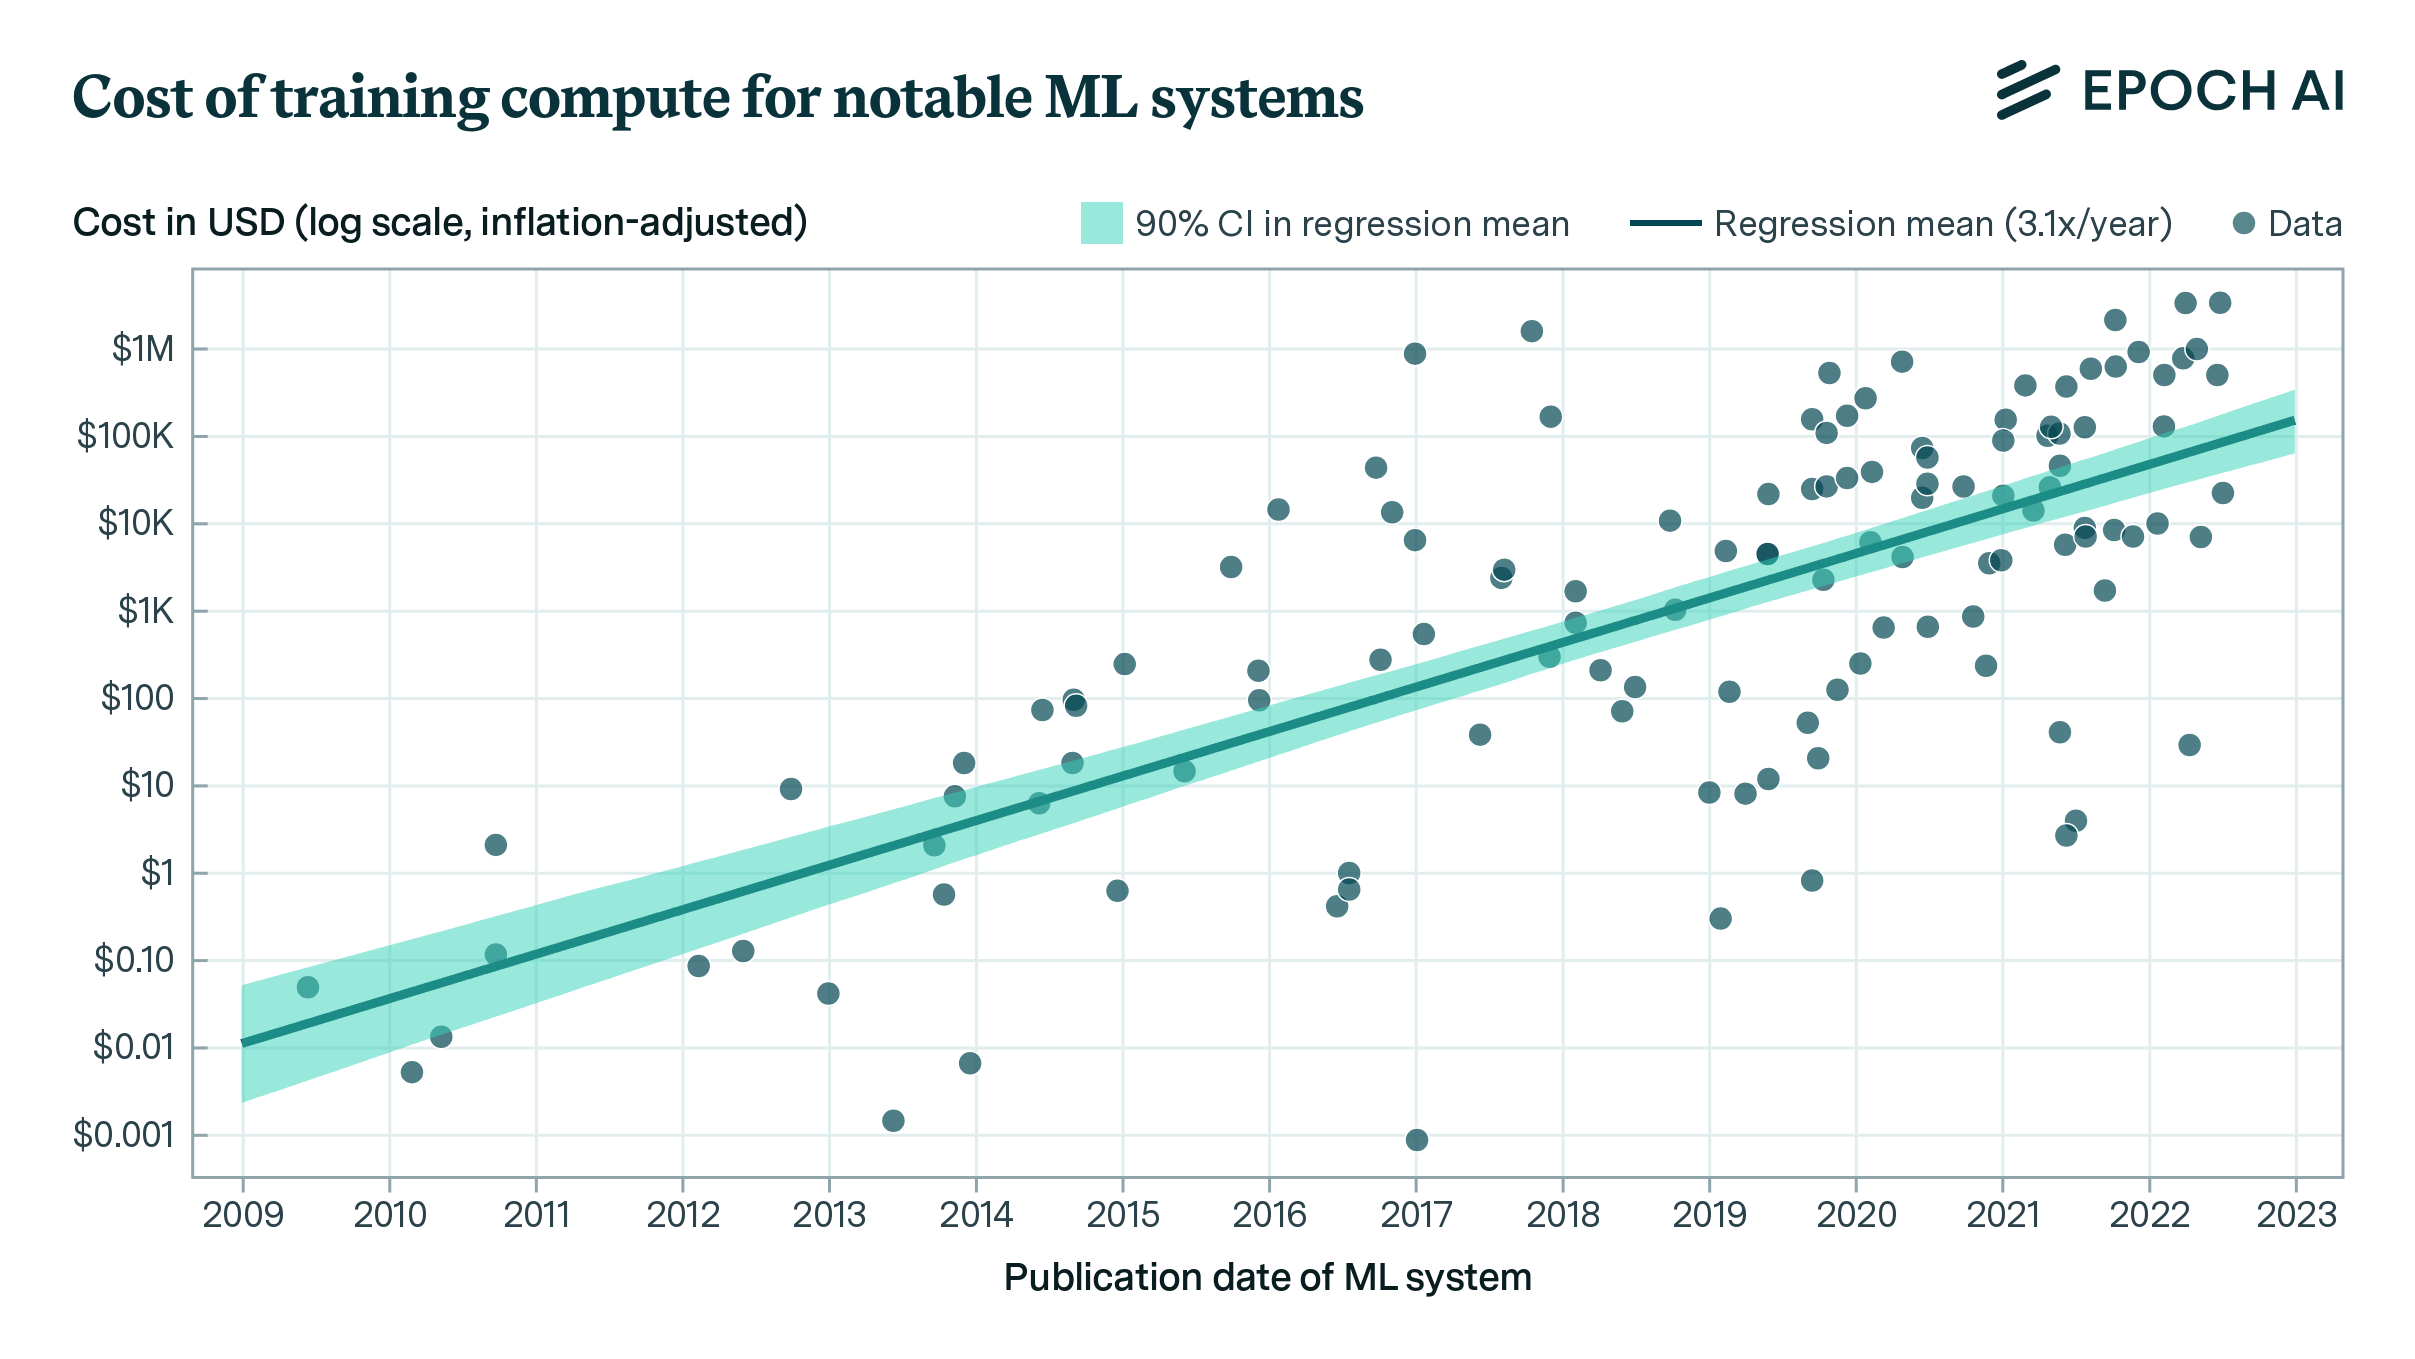
As an alternative approach, we also calculate the cost to train these models in the cloud using rented hardware. This method is very simple to calculate because cloud providers charge a flat rate per chip-hour, and energy and interconnection costs are factored into the prices. However, it overestimates the cost of many frontier models, which are often trained on hardware owned by the developer rather than on rented cloud hardware.
Using this method, we find a very similar growth rate of 2.6x per year, but the resulting cost estimates are around twice as high on average as estimates from the amortized hardware and energy method. Note that these cost estimates were previously featured in the 2024 AI Index.
Figure 2. Estimated cloud compute costs for the final training run of frontier models. The selected models are among the top 10 most compute-intensive for their time. The costs are the product of the number of training chip-hours and a historical cloud rental price.
Finally, we also investigated development costs in-depth for a few selected models. This approach includes amortized compute costs for both the final training run and supporting experiments, as well as the compensation of R&D staff. We applied this approach to GPT-3, OPT-175B (notable as a GPT-3 replication attempt by a team at Meta AI), GPT-4, and Gemini Ultra.
So, do AI labs spend more on compute than on staff? Our cost breakdown suggests this is the case, but staff costs are very significant. The combined cost of AI accelerator chips, other server components and interconnect hardware makes up 47–67% of the total, whereas R&D staff costs are 29–49% (including equity). Energy consumption makes up the remaining 2–6% of the cost.
While energy is a small fraction of the total cost, the electrical power capacity required for these models is significant, with Gemini Ultra requiring an estimated 35 megawatts. A naive extrapolation of the historical growth in power requirements suggests that AI supercomputers will require gigawatt-scale power supply by 2029.
Figure 3. Breakdown of model development costs for selected models. Hardware costs are amortized to the total number of chip-hours spent on experiments and training. R&D staff costs cover the duration of development, from initial experiments to publication.
Implications
The rapid increase in AI training costs poses significant challenges. Only a few large organizations can keep up with these expenses, potentially limiting innovation and concentrating influence over frontier AI development. Unless investors are persuaded that these ballooning costs are justified by the economic returns to AI, developers will find it challenging to raise sufficient capital to purchase the amount of hardware needed to continue along this trend. Therefore, investment is a key potential bottleneck in the continued scaling of AI models, alongside other limiting factors such as power capacity. As training costs soar, AI developers must address these financial and infrastructural challenges to sustain future innovations.
For a deeper dive into the methodology and detailed analysis, you can access the full paper on arXiv and the accompanying code and data on GitHub.
Webinar
On June 5th, we held a webinar on this study and its implications for AI research, development, and policymaking. Below is a recording of the webinar.
Updates
We removed finetuned models from the data which should not have been included. This applies to Figures 1 and 2. This slightly changed the trendlines and shaded CIs, but the growth rate numbers haven’t changed to one decimal place. We also Switched to a 90% CI for everything (instead of sometimes using 95% CI). This slightly changed the shaded CIs in Figures 1 and 2. Finally, we fixed the random seed for generating the results in Figure 3. This slightly changed the cost proportions in that figure.


