

Training frontier models requires a large and growing amount of power for GPUs, servers, cooling and other equipment. This is driven by an increase in GPU count; power draw per GPU is also growing, but at only a few percent per year.
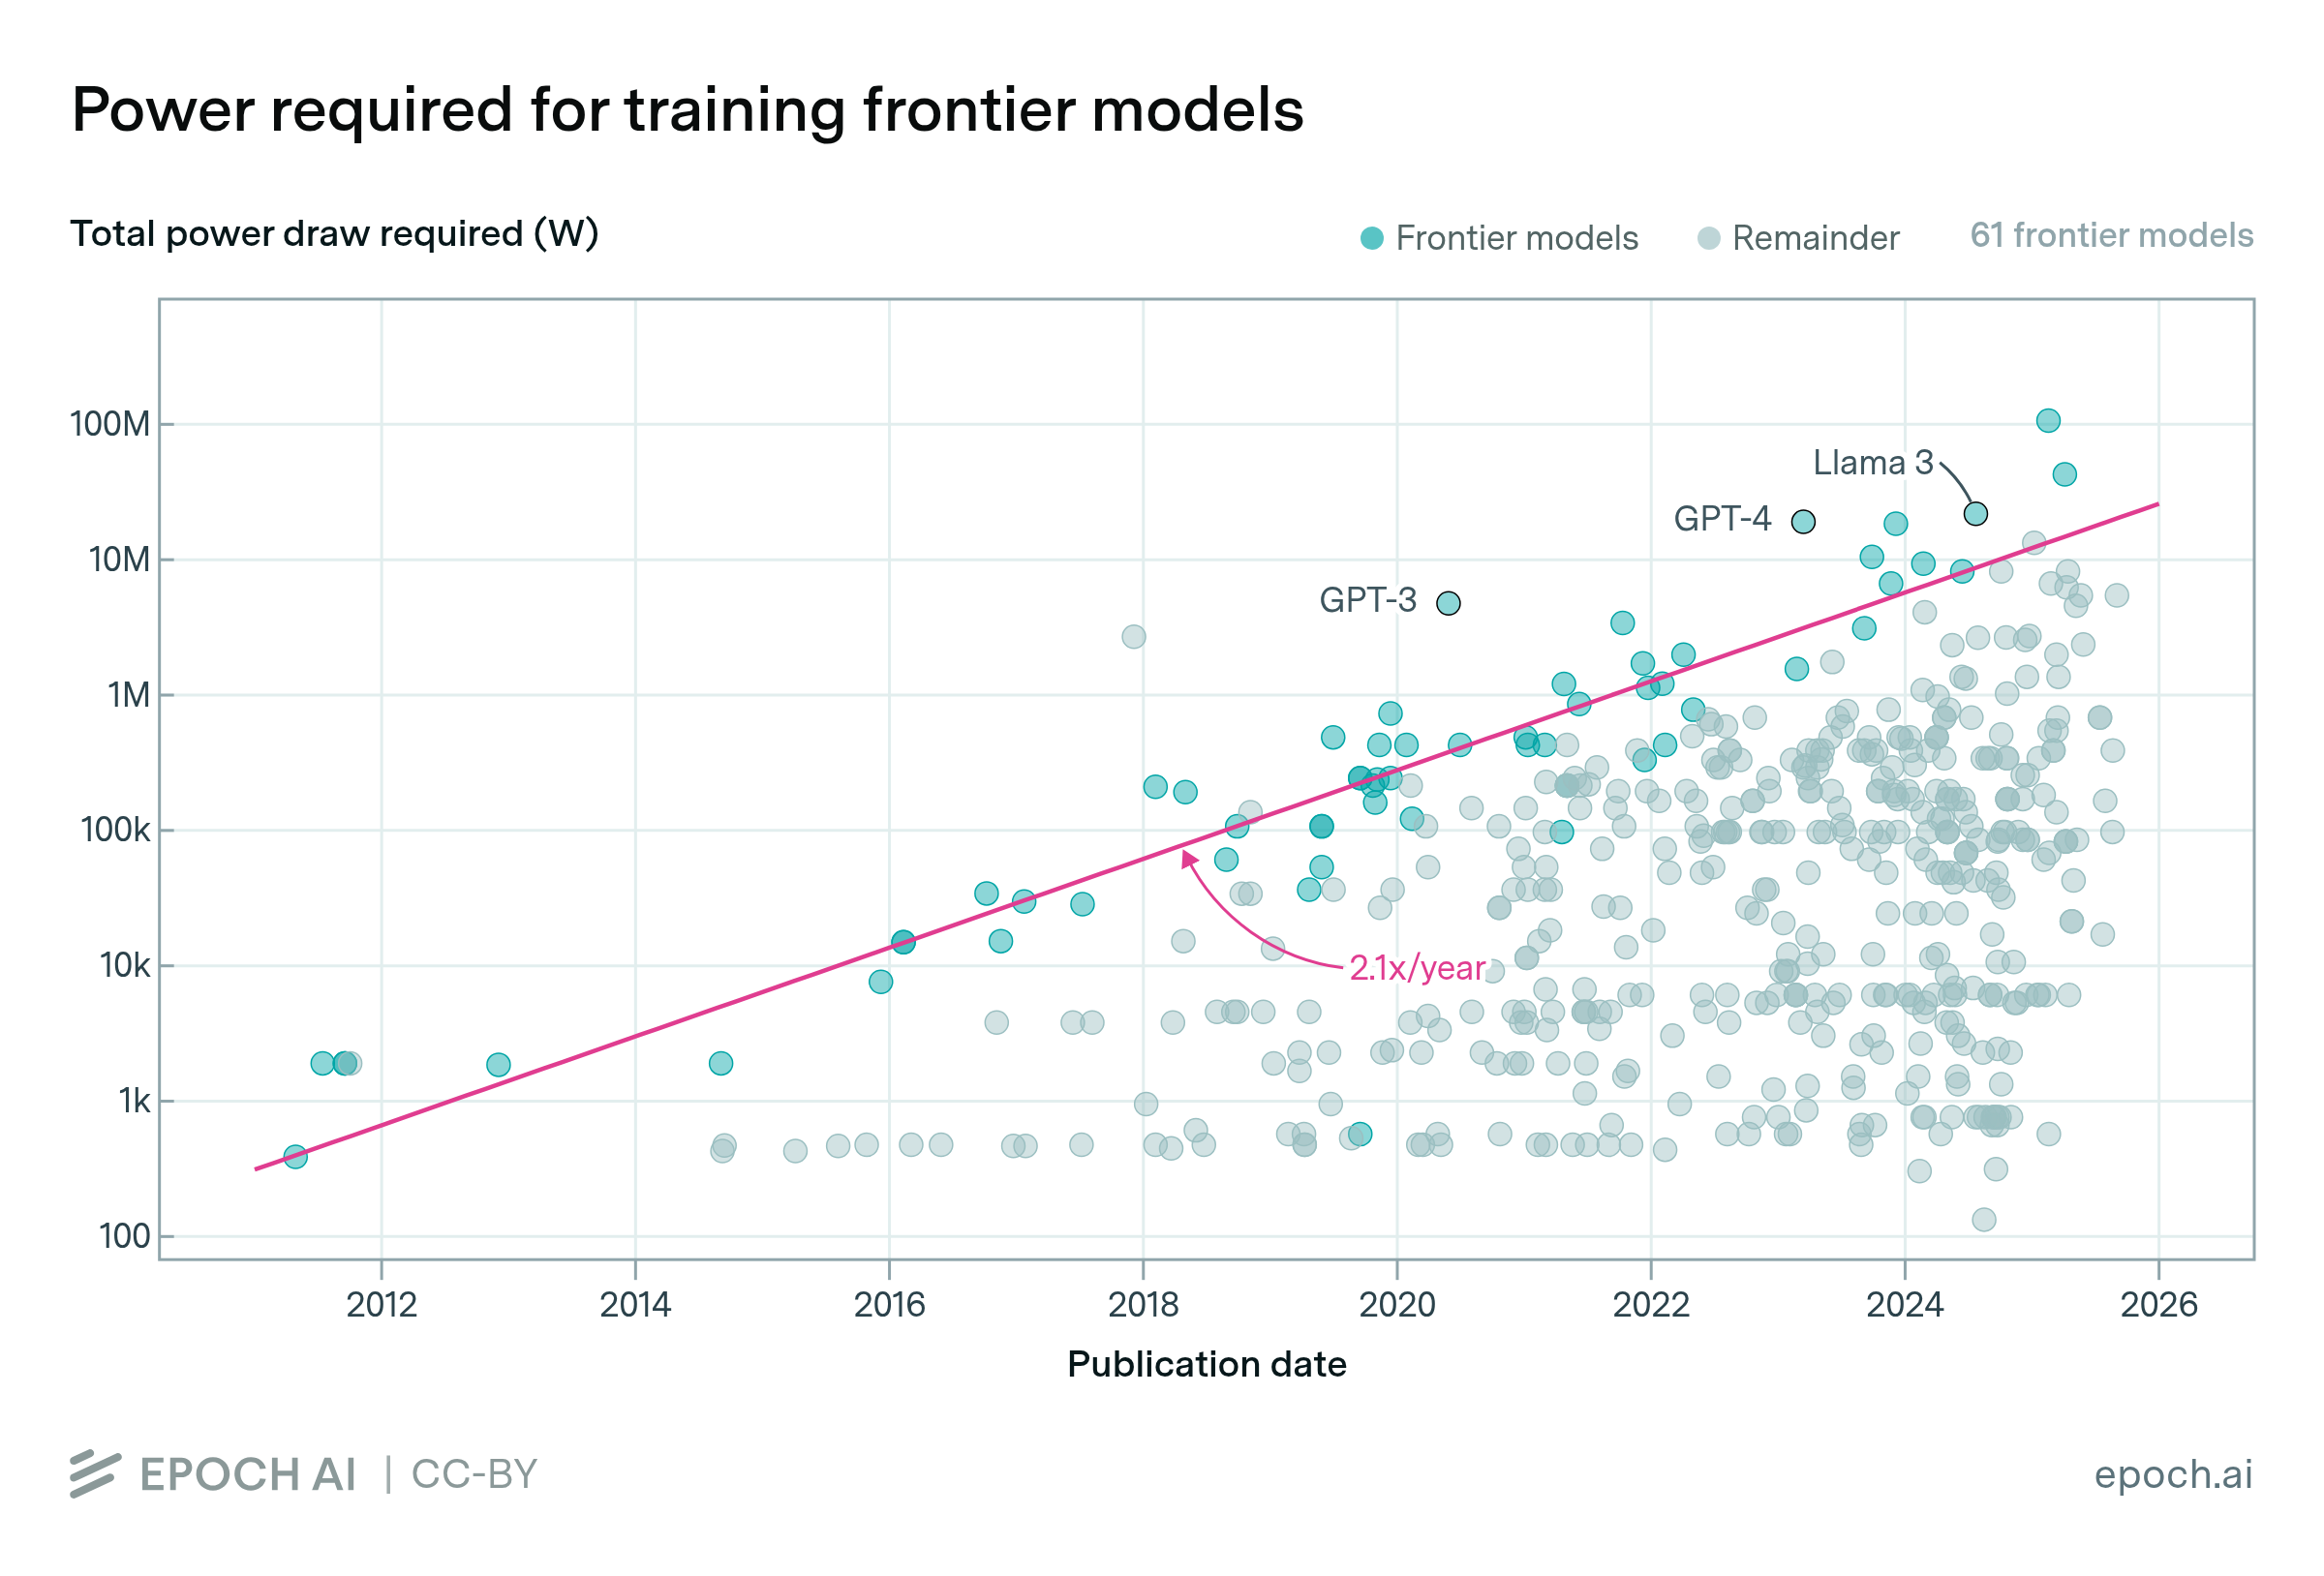
Training compute has grown even faster — around 4x/year. However, hardware efficiency (a 12x improvement in the last ten years), the adoption of lower precision formats (an 8x improvement) and longer training runs (a 4x increase) account for a roughly 2x/year decrease in power requirements relative to training compute.
Our methodology for calculating or estimating a model’s power draw during training can be found here.
Epoch's work is free to use, distribute, and reproduce provided the source and authors are credited under the Creative Commons BY license.
Learn more about this graph
We make use of two datasets: Epoch’s AI Models dataset, which collects information on over 1000 notable AI models, as well as our Machine Learning Hardware dataset, which records information on 161 AI accelerators.
After filtering our AI models data to a subset with values for each of `Publication date`, `Training power draw (W)`, we are left with 211 AI models. Our methodology for estimating training power draw can be found here.
Analysis
Assumptions and limitations
Explore this data
Our comprehensive database of over 3500 models tracks key factors driving machine learning progress.