Biology AI models are scaling 2-4x per year after rapid growth from 2019-2021

The training compute of top AI models trained on biological data grew rapidly in 2019-2021, but has scaled at a more sustainable pace since then (2-4x per year). Training compute for these models increased by 1,000x-10,000x between 2018 and 2021, but has only increased 10x-100x since 2021.

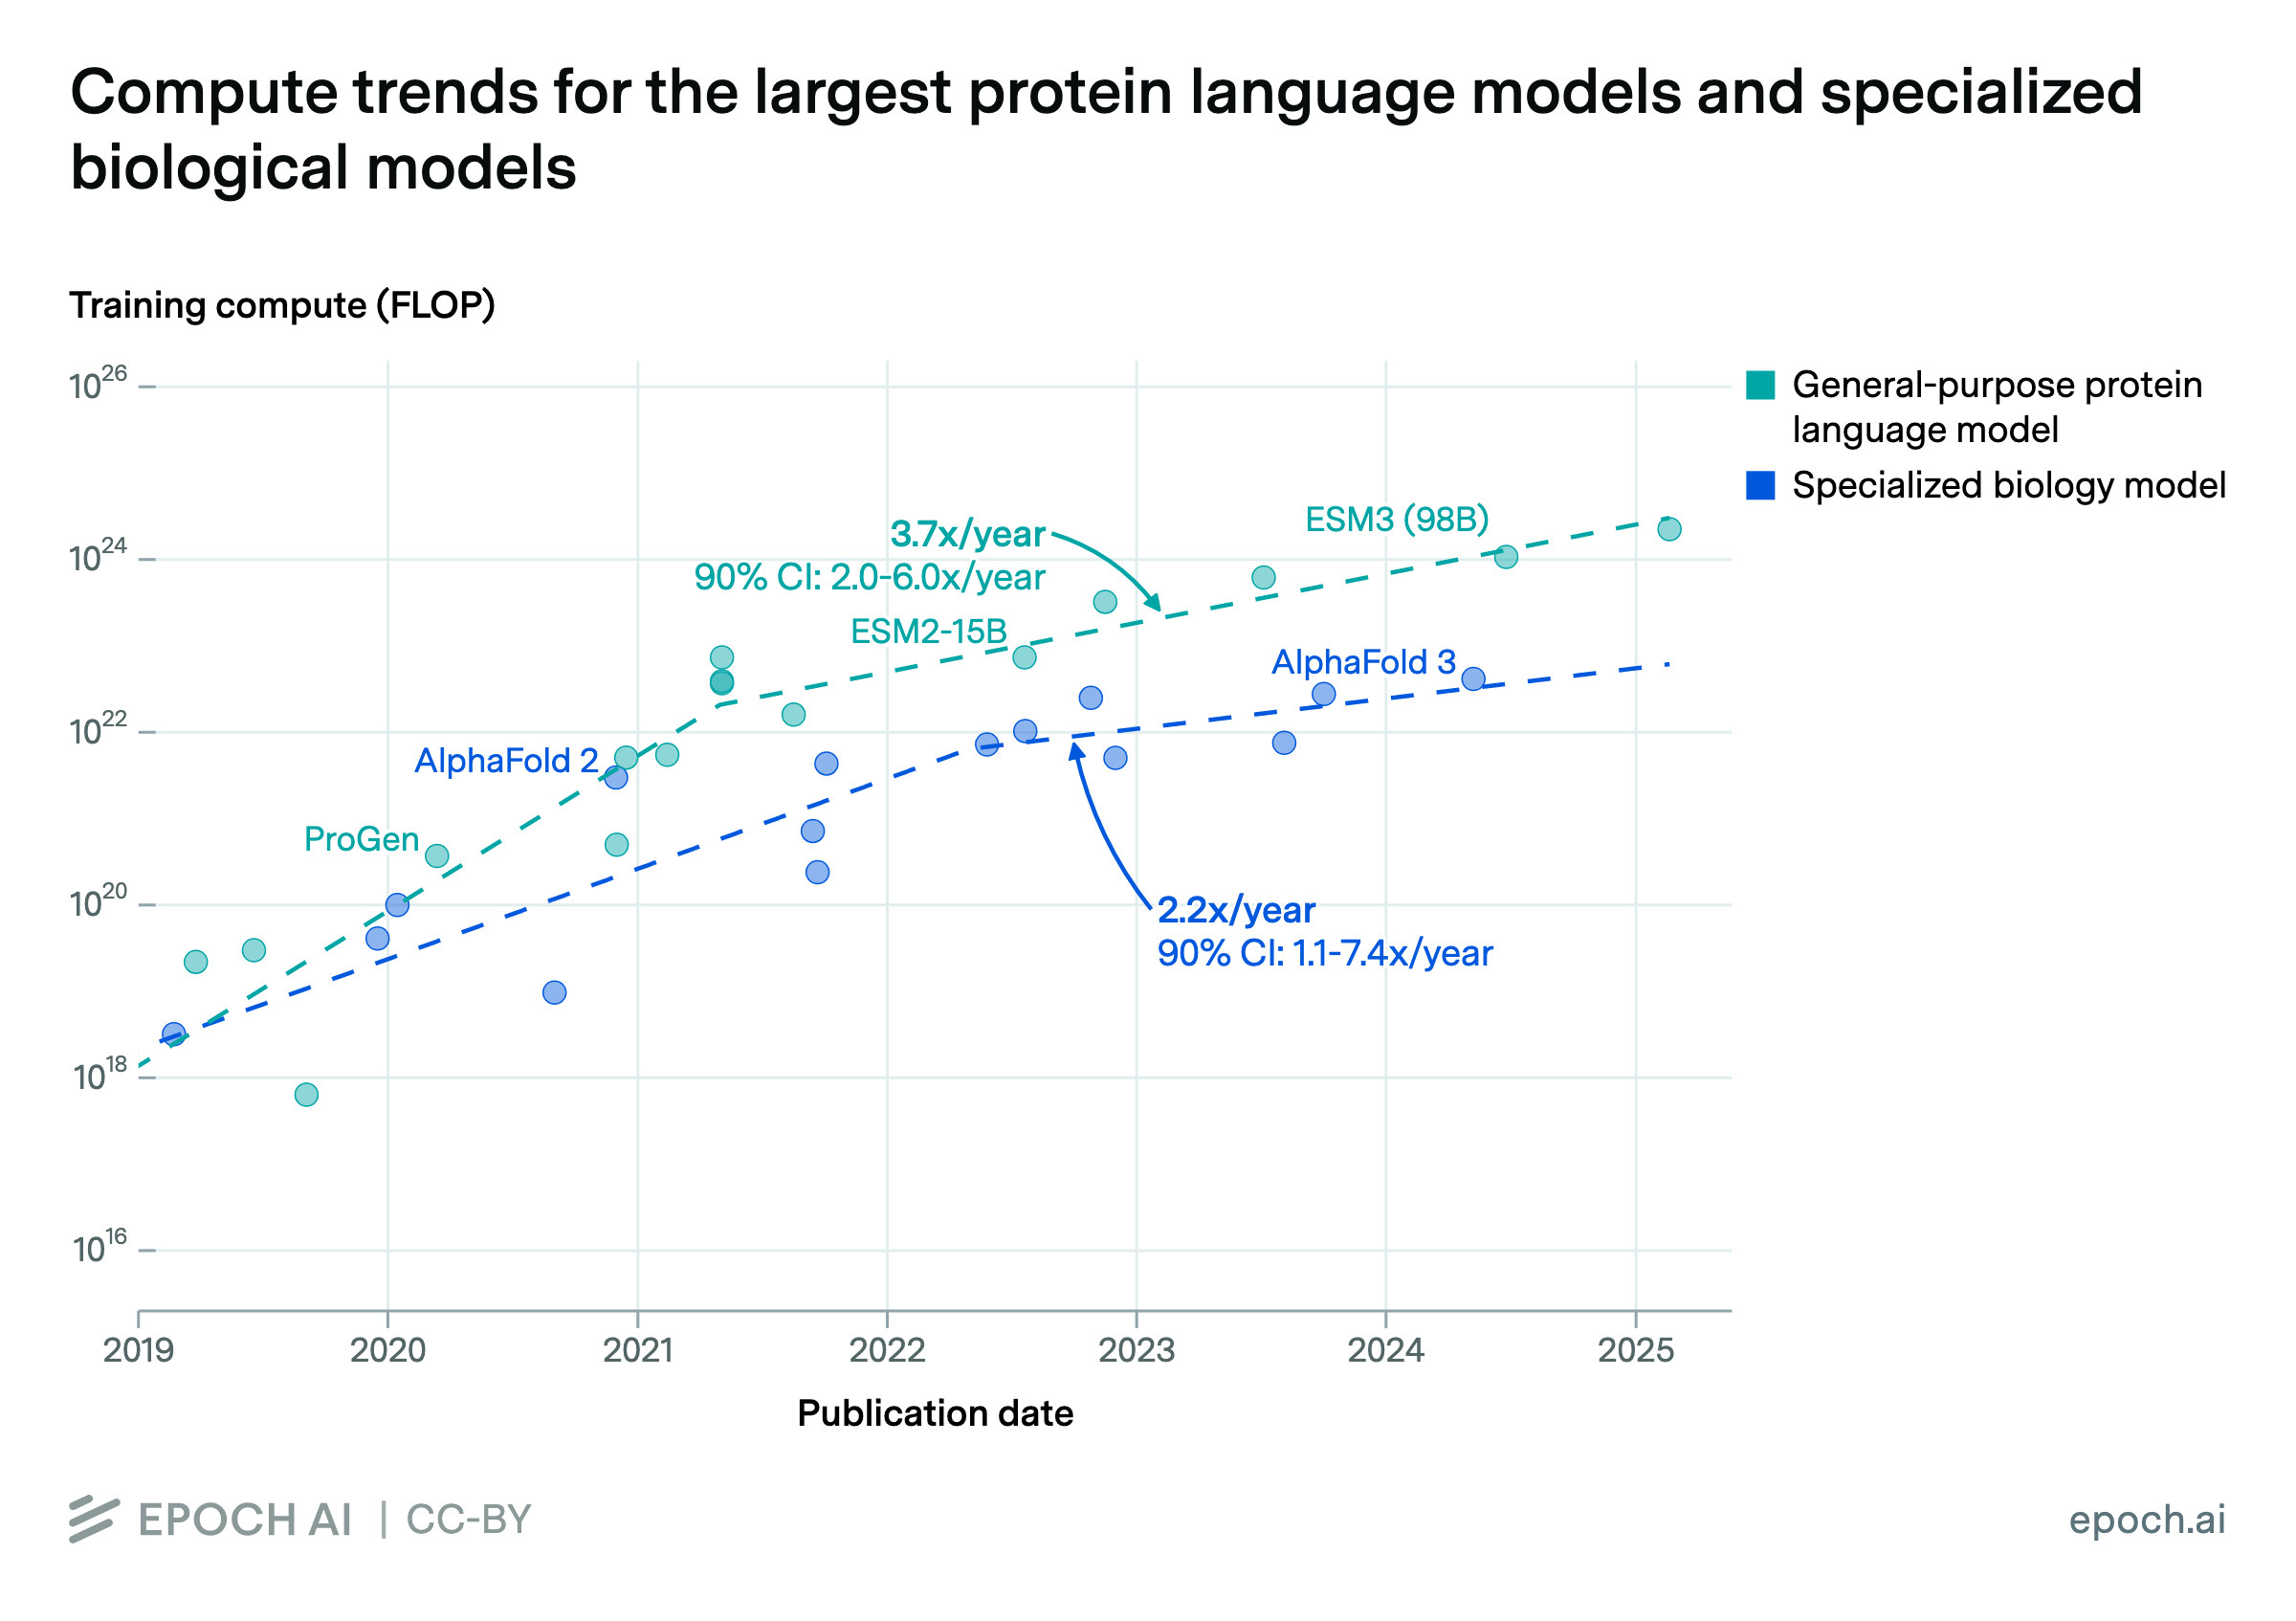
We consider two categories of biology AI models. General-purpose protein language models (PLMs) like Evo 2 learn to predict biological sequences, and can generate embeddings that are useful across many tasks. Specialized models like AlphaFold are optimized for specific predictions such as protein structure or mutation effects. PLMs are trained using about 10x more compute than specialized models, but still lag about 100x behind today’s frontier language models, which now are trained with over 1e26 FLOP.

Published

February 21, 2025

Last updated

February 21, 2025

Epoch’s work is free to use, distribute, and reproduce provided the source and authors are credited under the Creative Commons BY license.

Learn more

Overview

Our Biology AI Models dataset distinguishes between two categories: protein language models and specialized protein models. Protein language models (e.g., ProGen and ESM) are generative models trained on biological sequences, while specialized models (e.g., AlphaFold) predict specific protein properties such as structure and fitness. These categories differ in their architectures, data modalities, and computational requirements—with top protein language models using approximately 10x more training compute than their specialized counterparts. Given these fundamental differences, we separated these model types to avoid conflating potentially distinct scaling trends.

Both sets of models were each narrowed down to the rolling top 4 by training compute, to focus on the frontier of scaling for each model type. The trendlines in the figure are the best overall fit after searching over breakpoints in a two-segment, log-linear regression model, as well as log-linear models with no breakpoints.

Data

Our data comes from Epoch AI’s Biology AI Models dataset, a subset of our AI Models dataset focused on models trained on biological data. For each model, the dataset has a corresponding publication date, training compute quantity, and intended purpose, among other fields.

There are 361 models in the dataset, of which 163 have compute estimates. Of those, 66 are labeled ‘Protein or nucleotide language models” and 97 are other types of models (which we group together into “specialized models”). After separating protein language models and specialized models, we filtered to the rolling top-4 models by training compute in each category. After this filtering, we were left with 18 foundation models and 17 specialized models.

We have made a focused effort to increase coverage of biology AI models, but coverage is still low for these models, particularly prior to 2020. We performed a systematic literature review for models published since 2020, while pre-2020 model inclusion was limited to those with established significance in the field. This lack of coverage might bias our estimates of compute scaling rates. However, since models trained on large amounts of compute tend to receive attention due to their good performance and cost, we think it is unlikely that we missed models significantly above the trendline. For this reason we believe the overall slowdown pattern is not caused by missing data.

Analysis

Our analysis is concerned with the frontier of scaling in each category. While we typically define frontier models as those in the top 10 by training compute at their time of publication, here we use the top 4 to balance the goal of capturing only frontier models with a need for reliable statistical analysis. Due to the relatively small population of biological models, the rolling top 1 model would provide a very small dataset (11 models per category), and the rolling top 10 included models far away from the frontier. The slopes and particular dates of the breakpoint of our fitted trends are sensitive to choice of top N; results are presented in the table below.

Choice of top-N Protein language models Specialized models
Breakpoint date Recent slope Breakpoint date Recent slope
1 May 2021 (Oct 2020 – Dec 2022) 4.0x (2.0 – 7.5) Dec 2020 (Apr 2020 – Oct 2022) 2.3x (1.3 – 4.4)
4 May 2021 (Dec 2020 – Oct 2022) 3.7x (2.0 – 6.0) May 2022 (Jan 2020 – Nov 2022) 2.2x (1.1 – 7.4)
10 Sept 2021 (Apr 2020 – Aug 2023) 2.7x (0.7 – 8.3) Dec 2022 (Mar 2019 – Oct 2023) 4.3x (0.3 – 22)

To determine the best fit lines, we ran a log-linear regression on each category of models. We evaluated segmented regression models which allowed either zero or one breakpoints. We did not test models with a discontinuity at the breakpoint, since we have too few datapoints to accurately measure the presence and size of a potential discontinuity. For each model type, we tested all possible breakpoints at a monthly resolution, for line segments that span at least 5 data points. The minimum number of data points per segment is somewhat arbitrary, but does not have a significant impact on the median breakpoint date.

Minimum observations per segment Breakpoint date
Protein language models Specialized models
3 May 2021 (Jun 2019 – Feb 2024) May 2022 (Mar 2018 – Nov 2023)
5 May 2021 (Dec 2020 – Oct 2022) May 2022 (Jan 2020 – Nov 2022)
8 May 2021 (Feb 2021 – Aug 2022) May 2022 (Feb 2020 – Aug 2022)

After testing breakpoints, we selected the breakpoint which minimized the Bayesian information criterion (BIC). To estimate confidence intervals in the results, we perform a bootstrap analysis, resampling from our original dataset with replacement and repeating the process described above for 1000 iterations. After evaluating each regression model type, we chose the model type which minimized BIC. The model with a single breakpoint obtained lower BICs than a simple exponential trend with no breaks. In particular, for protein language models the difference in BIC was -2.09 nats (90% confidence interval: -37.04 to 4.18), and for specialized models it was -6.67 nats (90% confidence interval: -39.0 to 4.05).

Code for our analysis is available at Github.