This post was written in collaboration between the AI Futures Project, the AI Digest, and Epoch AI. It analyzes the results of the 2025 AI Digest survey. You can take the 2026 AI forecasting survey here.
Every other AI paper I read seems to start with some version of “AI progress has been fast”. And sure, that’s obviously true — a year ago there was no GPT-5, no DeepSeek-R1, and not even Claude 3.7 Sonnet! But few people seem to say exactly how fast things have been, and whether people saw it coming. So when the AI Digest released a survey for people to forecast AI progress over the last year, I was excited.
The survey helps track something akin to an “AI 2027 worldview”, where automating AI R&D leads to a surge in AI capabilities and hence a range of risks to humanity, especially from handing power off to AI systems. You can see this in the question topics: about half of the survey is about forecasting performance on benchmarks related to AI R&D. The other half looks at real-world impacts — think AI-enabled cyberattacks, humans losing control of AI, and more “mundane” things like revenue and public perception. If this worldview is even partially right (and I think it clears that bar), these questions capture some of the most consequential topics about the future of AI.
So how did forecasters do on these questions?
Demographics: Junior, short-ish timelines, high risk of AI catastrophe
To answer this question, we first need to know who these forecasters were. They were primarily recruited through the AI Digest’s outreach on X and their monthly newsletter. In total there were 421 of them, some with serious forecasting credentials. For example, there’s regular top forecaster Peter Wildeford (who came in 14th), as well as AI forecasting researcher Ajeya Cotra (who came in 3rd).
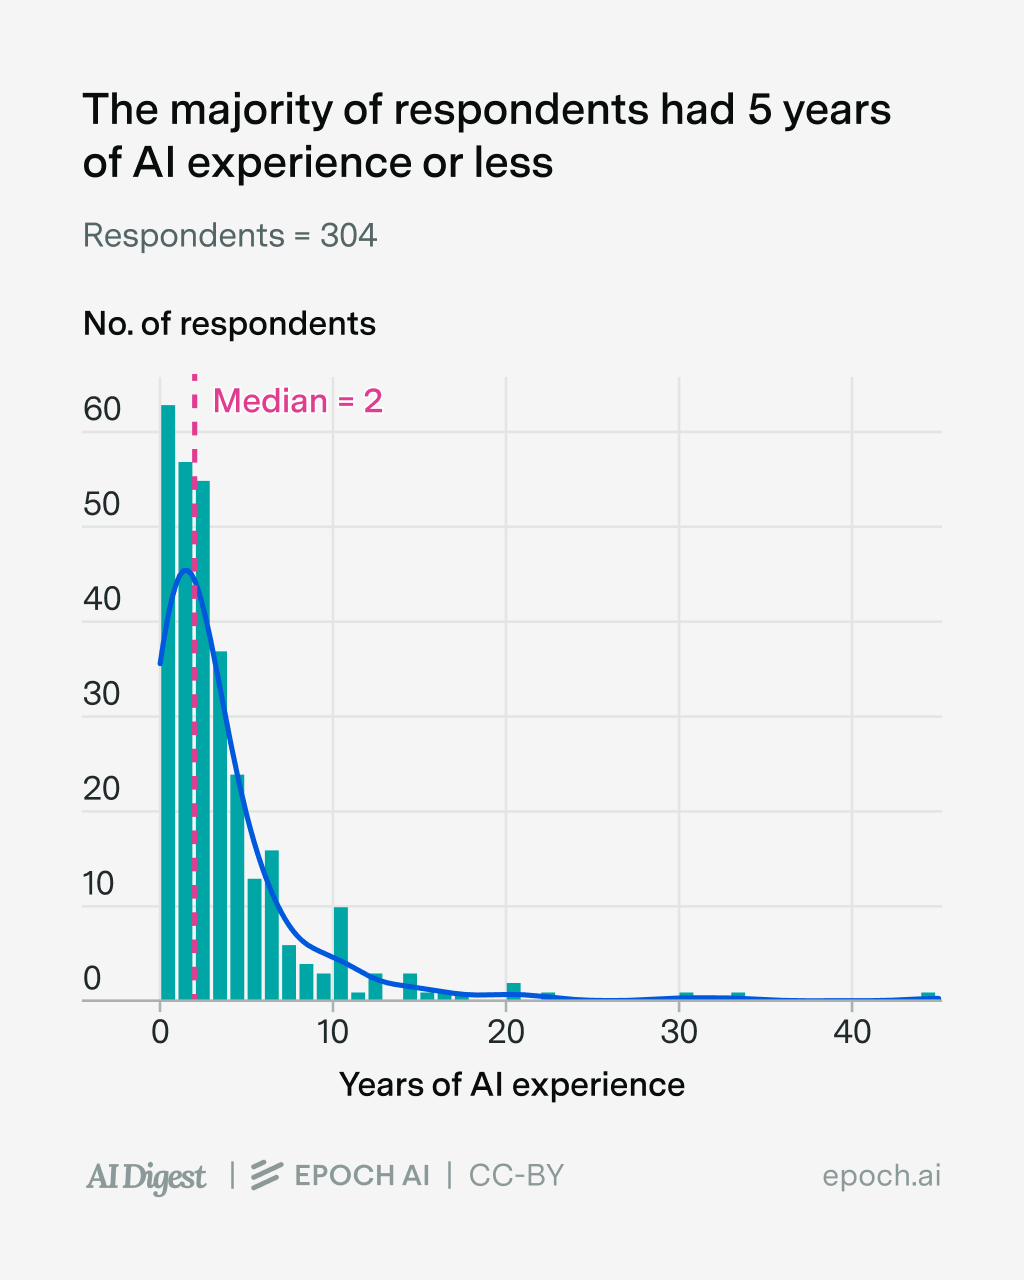
The first thing to know about the forecasters is that they were pretty junior. 73% claimed to have some professional or academic experience in AI, of which 80% claimed to have five years of experience or less.
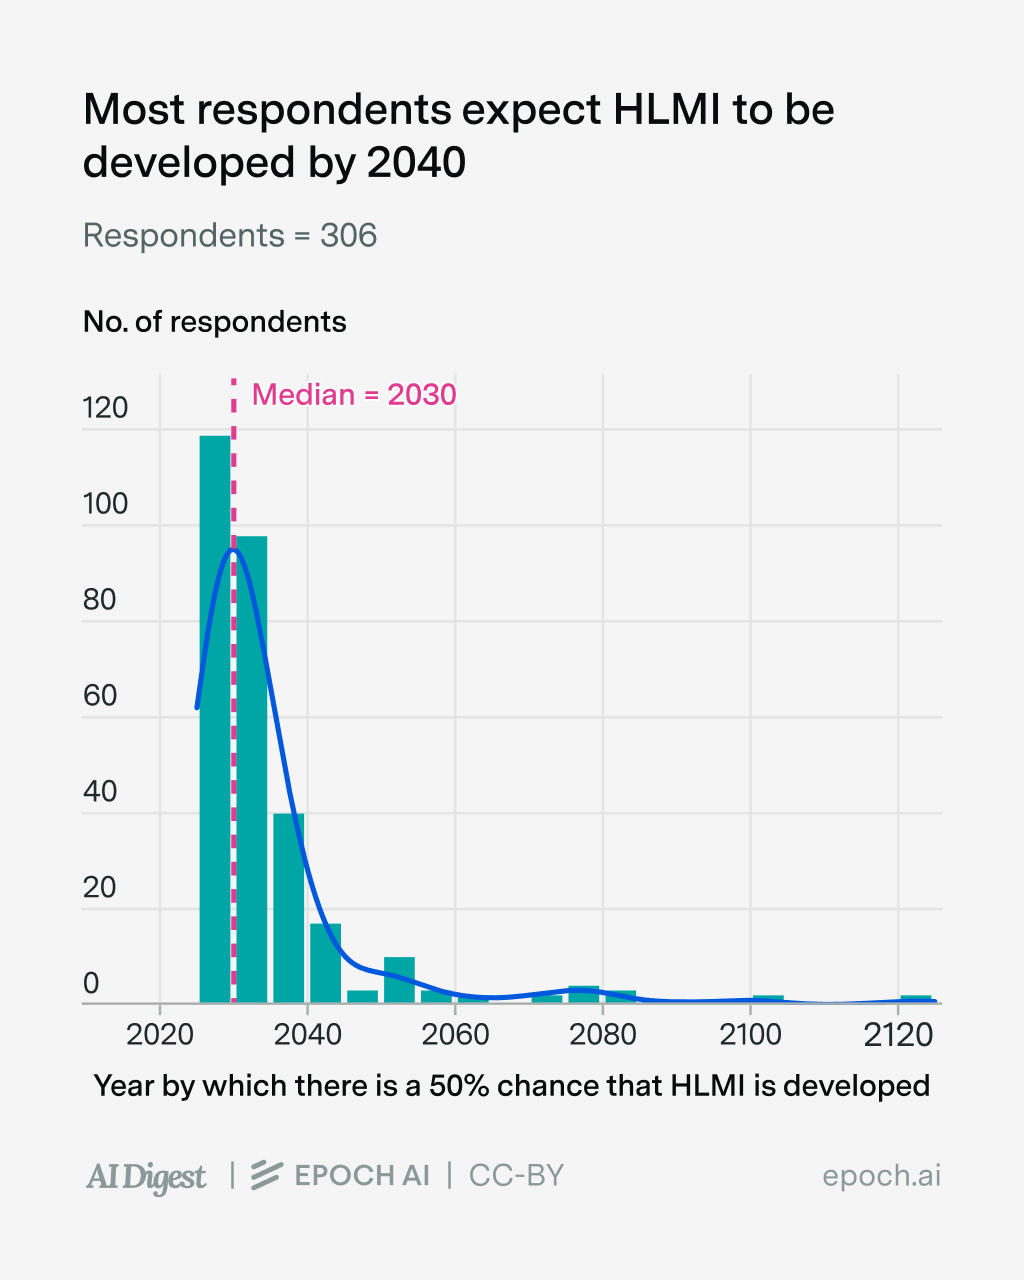
The next thing to know is that they had very short timelines to “High-Level Machine Intelligence (HLMI)” — that is, “unaided machines that can accomplish every task better and more cheaply than human workers”, seemingly including robotics. Half of them expected HLMI to be developed by 2030, and 90% of them expected it by 2040.
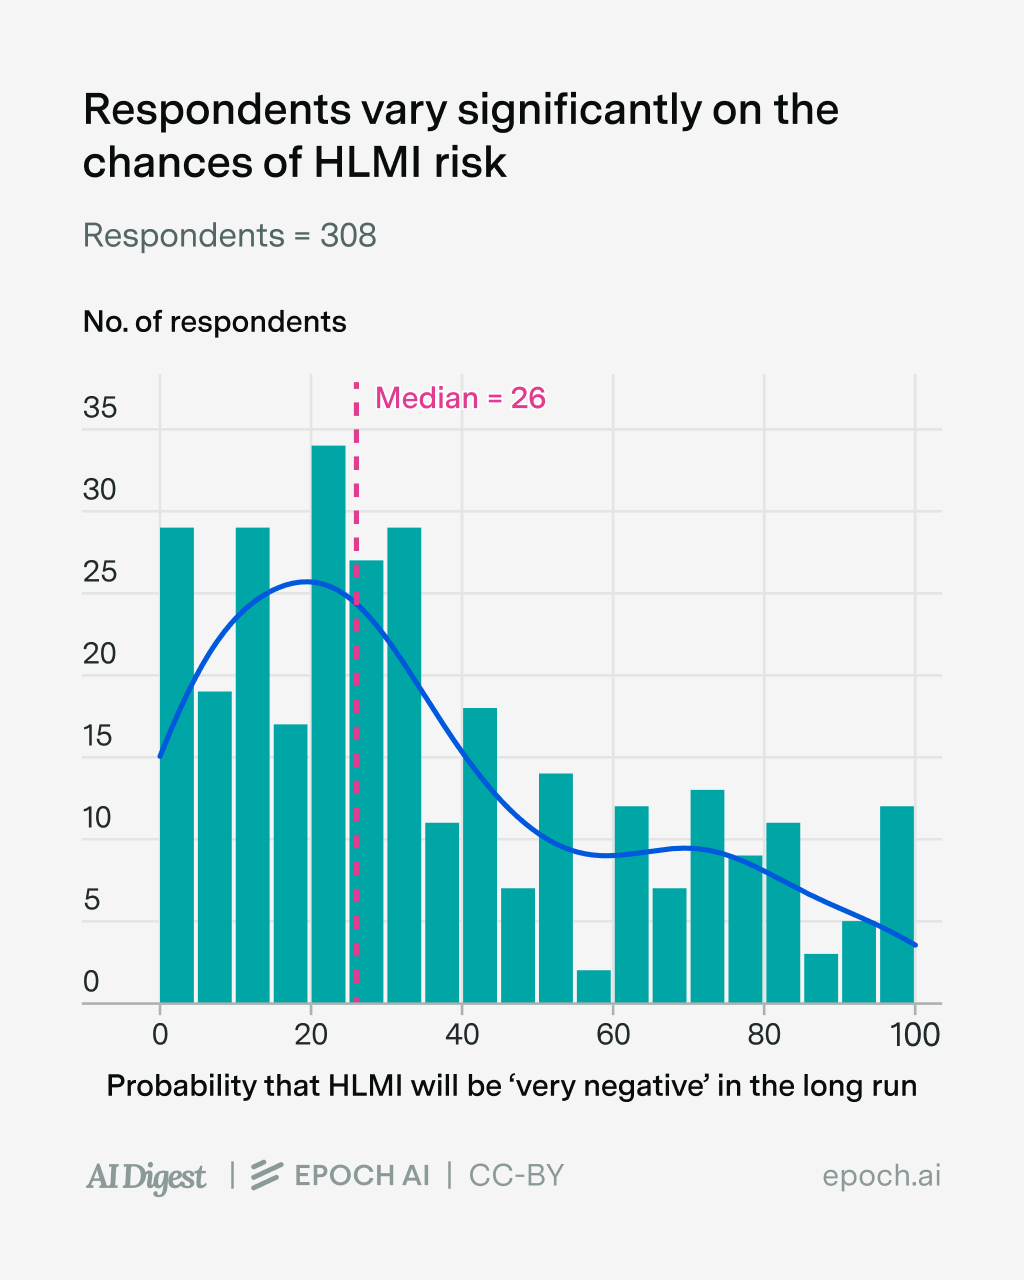
Thirdly, respondents were pretty “doom-y”: three-quarters of them gave over a 10% chance that HLMI would lead to “extremely bad” outcomes like human extinction.
So to oversimplify, we can think of these forecasters as “junior AI professionals who expect HLMI by 2040, and think it might lead to horrible consequences” — fairly common within the AI safety community. And it’s worth thinking about what this means: if they’re right about AI progress and its impacts over the next fifteen-ish years, it could make even the Industrial Revolution seem like a footnote in a history book.
The million-dollar question: were they right about AI progress over the last year?
Benchmarks related to AI R&D: The median forecast was on the money (for the most part)
The first half of the survey asked participants to forecast performance on five separate benchmarks, each of which is related to AI R&D. Here’s how they did:
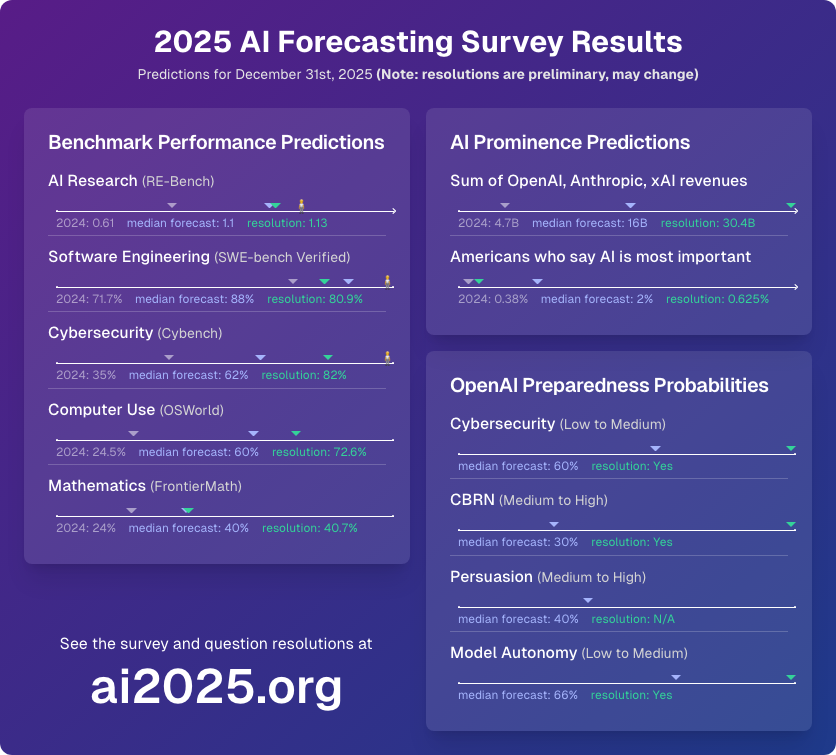
| Topic | Score at time of forecast | Median forecast | Resolution |
|---|---|---|---|
| RE-Bench Open-ended machine learning problems | 0.60 (0.61 after o3) | 1.1 | 1.13 |
| SWE-Bench Verified Resolving real-world GitHub issues in Python | 55.0% (71.7% after o3) | 88% | 80.9% |
| Cybench Professional cybersecurity competition tasks | 35% | 62% | 82% |
| OSWorld Simple computer-use tasks | 24.5% | 60% | 72.6% |
| FrontierMath Extremely challenging math problems with automatically verifiable answers | 2.0% (24% after o3) | 40% | 40.7% |
Note: You can see the reasoning for the resolutions in the original survey link. [Edit: The OSWorld performance was updated from 66.3% to 72.6% after this post was written.]
For the most part, the median forecast looks pretty good — they were basically right on RE-Bench and FrontierMath, and fairly close for OSWorld and SWE-Bench Verified. The one exception seems to be Cybench, where the median forecast underestimated progress by 20 percentage points.
So what went wrong with Cybench? Looking at the few dozen respondents that shared rationales for their forecasts, I’d guess that there are two main reasons at play. The first is not extrapolating existing benchmark trends, and gesturing to how they expect the benchmark to be quite hard (though it’s not very clear to me how this translates into quantitative forecasts). The second reason is overrating how reluctant labs would be to report improvements on Cybench — many respondents thought that high scores on a cybersecurity benchmark would indicate strong cyberattack abilities, putting labs under more scrutiny, so they’d have an incentive to not report on it.
Although the forecasters weren’t as far off, another interesting case is SWE-Bench Verified, where unlike Cybench, forecasters somewhat overestimated progress — the median forecast was 88% instead of the final 81%. So why did forecasters overshoot? Some of them argued that SWE-Bench’s coding tasks are especially amenable to reasoning models. Some argued that progress would be fast because many labs optimize their models specifically to do well on the benchmark — Anthropic often uses it as the first benchmark in new model announcements, and some people even have the job of hill-climbing it. Finally, some pointed out that the original state-of-the-art was 72%, and appealed to how benchmarks typically saturate quickly once scores start climbing the “steep part of the s-curve”. This led to forecasts close to the benchmark’s saturation point at 90%ish.
Broadly speaking, I think all of these arguments are right, so it’s slightly puzzling to me why SWE-Bench Verified scores didn’t end up closer to 90%. I doubt flawed benchmark questions capped scores to 80%, because separate analyses suggest the error rate is likely between 5 and 10%. Furthermore, at Epoch we’ve run many different models on the benchmark, and if we look at the fraction of problems that have ever been solved by any model, we get 87%. So maybe it’s just that models still fall short on some problems, or it might even just be random chance. In any case, I don’t think forecasters as a whole should update much from overshooting.
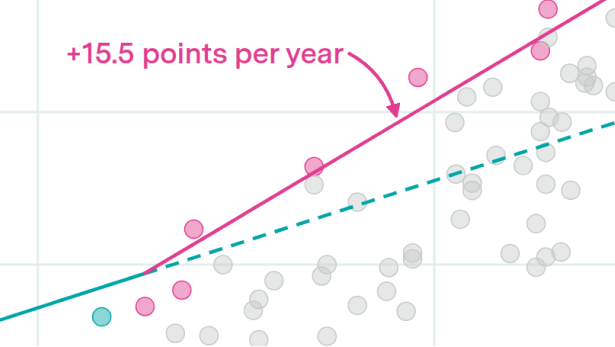
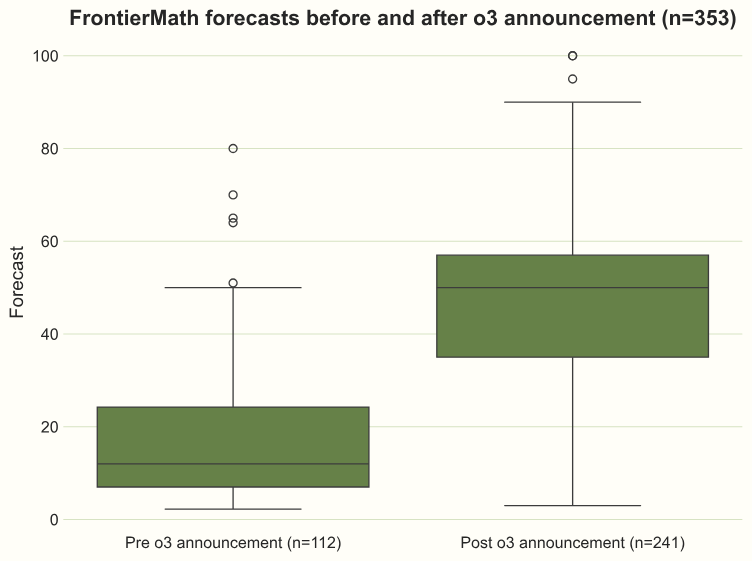
This doesn’t mean that individual forecasters shouldn’t update — not all the forecasters have the same beliefs after all! For example, people who expected HLMI to be developed before 2030 tended to have more aggressive benchmark forecasts than those who expected HLMI after 2030. Here’s an example of this on FrontierMath:
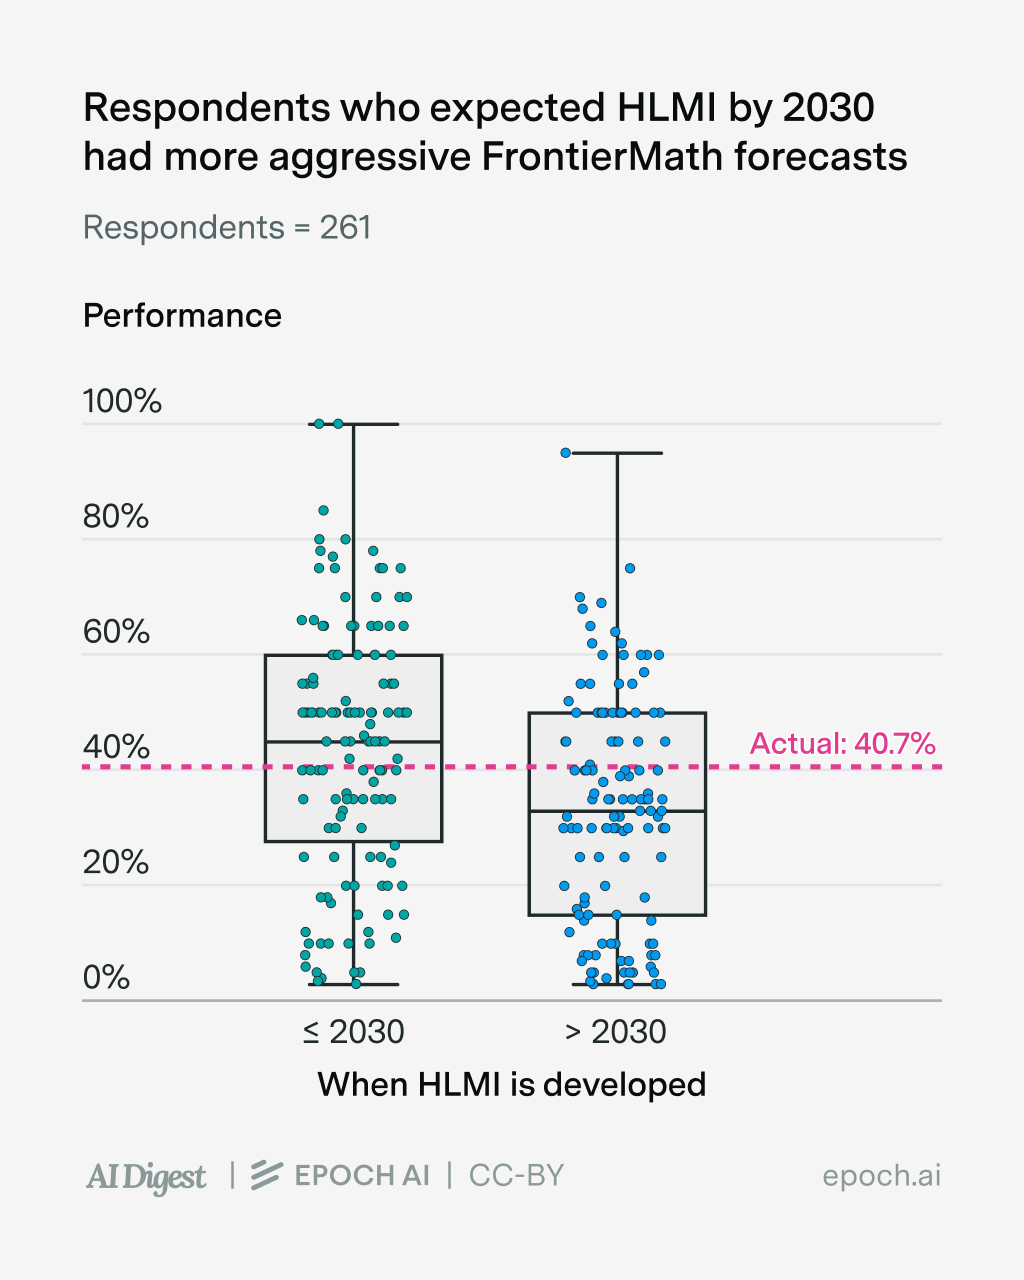
You might be thinking, “of course people with longer timelines expect slower benchmark improvements, isn’t that common sense?”. I actually don’t think so — you could have longer timelines not because you expect slower benchmark improvements, but because you think benchmarks are less meaningful a proxy of progress towards HLMI. For example, this is a crucial difference between the timelines of Eli Lifland (who co-authored AI 2027) and Mechanize co-founder Ege Erdil, who’s publicly argued for multi-decade AI timelines.
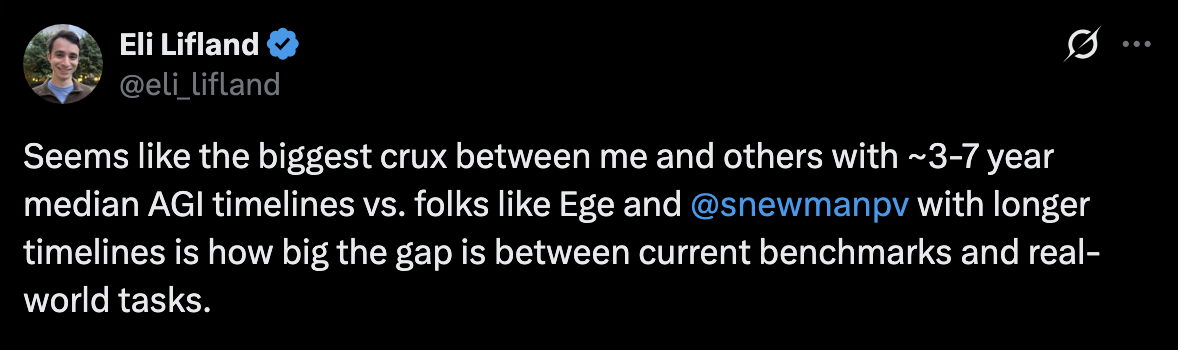
(Source) Note that at the time of writing the tweet, Eli had a median AGI timeline of around 2031, which still counts as having short timelines, even if he doesn’t fall into the “HLMI-by-2030” group of respondents.
Indeed, in the case of this survey, those with 2030-or-earlier timelines performed fairly similarly to those with post-2030 timelines (those with longer timelines did a tad better, but it’s not statistically significant).1
OpenAI preparedness scores: mixed results on risks
The second half of the survey increasingly turns towards broader societal impacts besides AI R&D, which as we just alluded to, may or may not follow from substantial benchmark improvements. The first part of this was to look at potential AI-enabled risks. The results were as follows:
| OpenAI’s preparedness scores: Risk area | Risk level at time of forecast | Median forecast (Probability of resolving “Yes”) | Resolution |
|---|---|---|---|
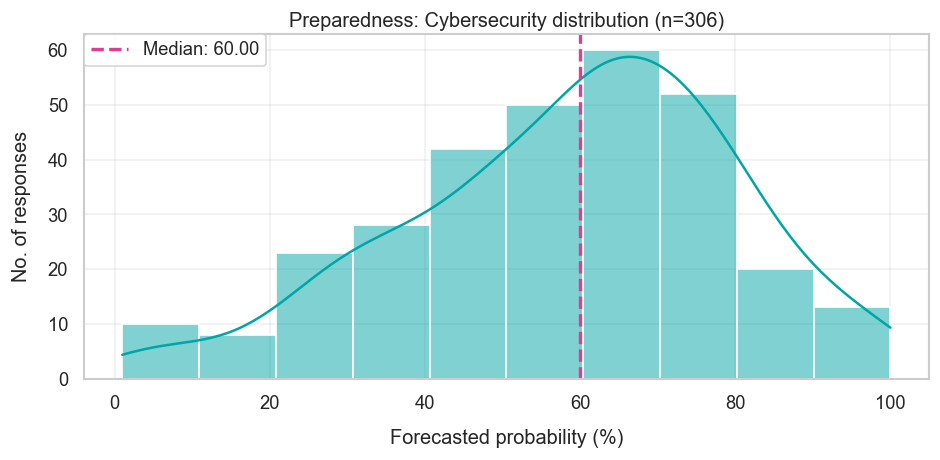
| Cybersecurity Will the risk level increase from low to medium? | Low | 60% | Yes |
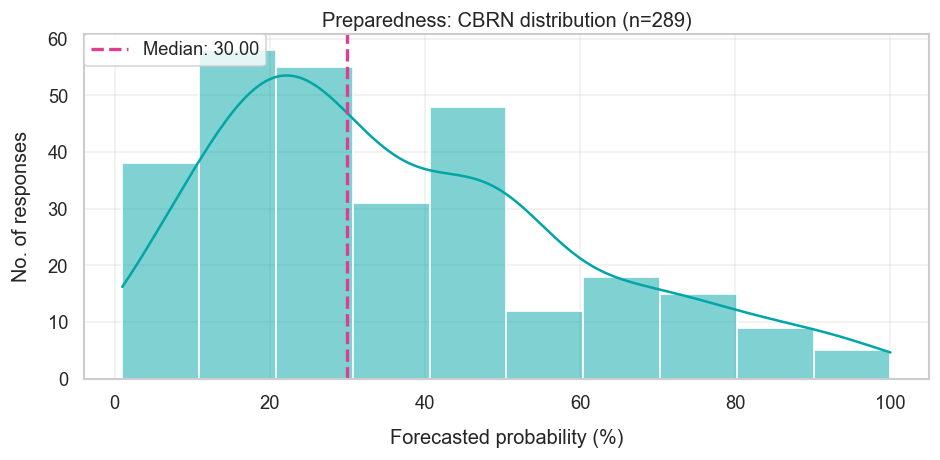
| Chemical, Biological, Radiological, and Nuclear risks Will the risk level increase from medium to high? | Medium | 30% | Yes |
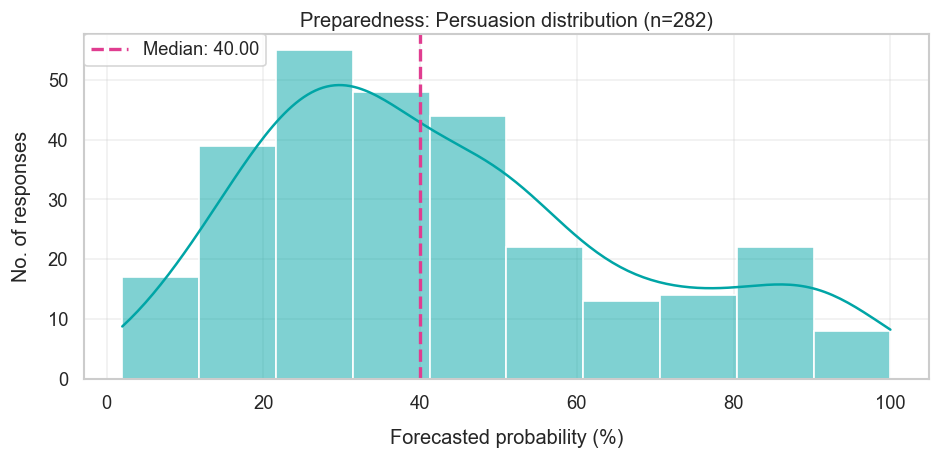
| Persuasion Will the risk level increase from medium to high? | Medium | 40% | N/A (Category removed) |
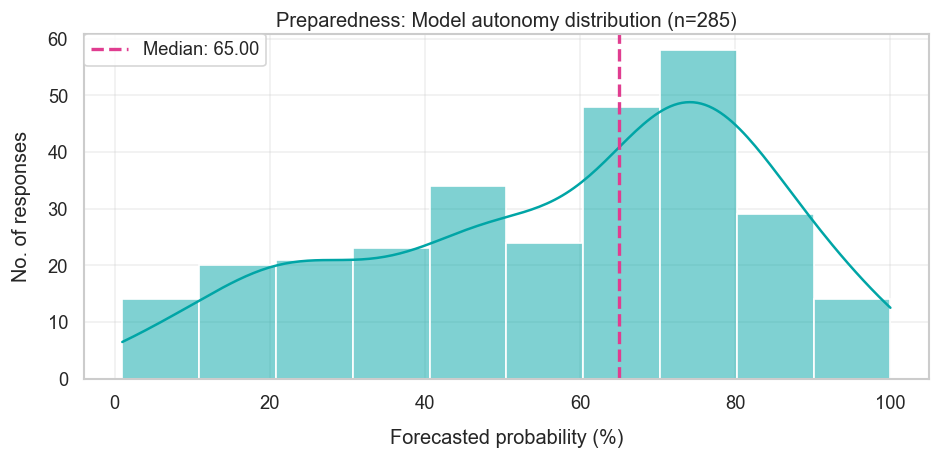
| Model autonomy Will the risk level increase from low to medium? | Low | 65% | Yes |
Note: You can see the reasoning for the resolutions in the original survey link.
The survey captured potential risks by looking at OpenAI’s 2023 preparedness framework, which describes how they “track, evaluate, forecast, and protect against catastrophic risks posed by increasingly powerful models.” This is split into four risk areas — besides Chemical, Biological, Radiological, and Nuclear (CBRN) risks, there’s also cybersecurity, persuading humans, and model autonomy (which allows models to do things like avoid being shut down by human operators and self-improve). Each risk area then has four risk levels — low, medium, high, and critical — and the survey asked how likely each of the four risk areas were to increase its risk level.
From the table above, it looks like the median forecaster correctly surmised that risk levels would increase in cybersecurity and model autonomy, from “low” to “medium” risk. This perhaps isn’t so surprising, because these are heavily related to coding and computer-use, which forecasters expected AIs to get much better at (as we saw in the last section).
But they underestimated CBRN risks, which went from “medium” to “high” — so what went wrong? One small part of this may be that, like with Cybench, respondents overrated OpenAI’s incentive to underreport increases in these risks. But this can’t be the full story — the same argument would apply to all other risk areas as well. The bigger reason seems to be that they specifically underestimated how much LLMs could provide uplift on biological capabilities. Consider the conditions needed to go from a “medium” to a “high” on CBRN risks:
“Model enables an expert to develop a novel threat vector OR model provides meaningfully improved assistance that enables anyone with basic training in a relevant field (e.g., introductory undergraduate biology course) to be able to create a CBRN threat.”
Many forecasters argued it’d be hard for models to develop “truly novel threat vectors”, which is right as far as I’m aware. But they also didn’t expect models to be able to provide meaningful “uplift” to non-experts in creating CBRN threats, which turned out wrong — GPT-5.2 seems to have met this bar. Interestingly, this seems in line with a study earlier this year, which finds superforecasters and biology experts drastically underestimating uplift.
Putting these results together suggests a mixed record forecasting OpenAI’s risk levels (the final risk area of “persuasion” was removed from OpenAI’s risk framework in April, so the question was resolved inconclusively).
AI’s prominence: underestimated revenue, and overestimated public perception
This brings us to the final part of the survey, which looks at the real-world impacts of AI, namely annualized revenue and public concern about AI.
| Question | Value at time of forecast | Median forecast | Resolution |
|---|---|---|---|
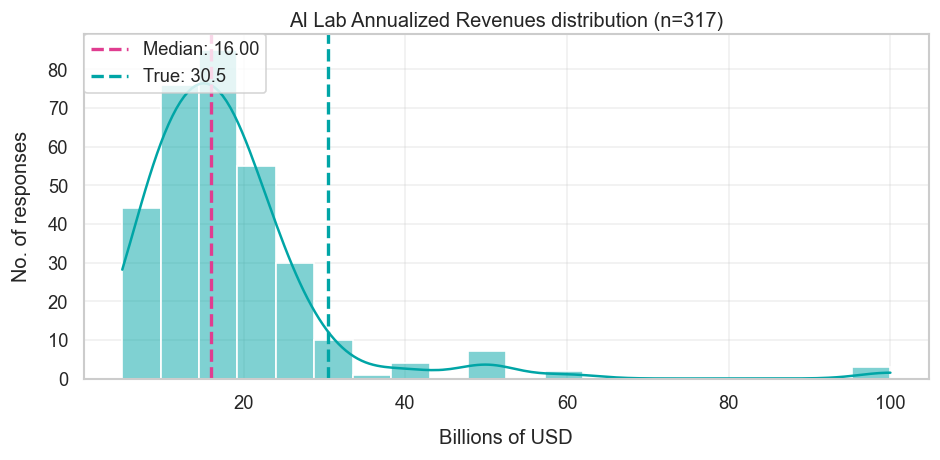
| Sum of OpenAI, Anthropic, xAI revenues | $4.7B Note: Aug rather than Dec 2024, see discussion below | $16B | $30.4B |
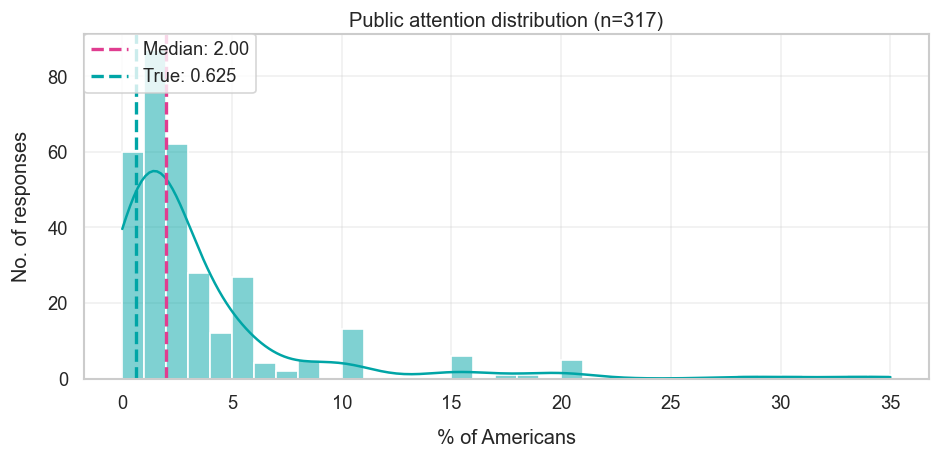
| What percentage of Americans will identify computers/technology advancement as the US’s most important problem by December 31st 2025? | 0.38% (Sep-Dec 2024) 0.45% (Mar-Dec 2024) | 2% | 0.625% |
Note: You can see the reasoning for the resolutions in the original survey link.
Like with the preparedness framework questions, there was a mixed bag: forecasters substantially underestimated revenue (by two-fold), and overestimated public concern about AI.
Frontier lab revenues
For me, the most striking result of the whole survey was that people heavily underestimated AI lab revenue. The median forecaster expected OpenAI, Anthropic, and xAI to have an annualized revenue of $16 billion by the end of last year, whereas it was almost double that — $30.4 billion, to be exact. The forecast was only a year out, so how did we end up with such a big difference?
One issue could be misinterpreting the question. Importantly, the survey asked for annualized revenue rather than total revenue in 2025, so if forecasters misunderstood the question they might’ve given way too low of an estimate.
But I doubt this really explains the difference. Eli Lifland provides one reason for this: the survey itself gave numbers for annualized revenue. So anyone reasoning “revenue will grow by N times” from those provided figures would arrive at the same forecast regardless of the terminology confusion.
Another reason is that we look at the forecasters’ reasoning on these questions. Out of the 33 provided rationales, nine of them explicitly referenced annualized revenue, whereas only two of them were clearly about full year revenue. The remaining 22 were pretty vague, like claiming to “extrapolate previous trends” without saying what exactly the trend is. So I’m not totally sure, but I think this weakly suggests that most respondents correctly looked at annualized revenue.
One final possibility is confusion about the baseline annualized revenue figure provided in the survey, i.e. $4.7 billion. This number relied on OpenAI revenue numbers from August rather than December 2024, so forecasters may have anchored on an already-outdated starting point. Instead, if they had access to a more updated baseline, their forecasts would’ve been less far off.
But I don’t think this is the full story either. Suppose the forecasters had an updated figure, which we can get with the benefit of hindsight: At the end of 2024, OpenAI’s annualized revenue was around $5.5 billion, and Anthropic’s was around $0.9 billion. This gives us a total of $6.4 billion in annualized revenue. So what would their forecasts have been? From reading the forecasters’ rationales, many respondents seemed to be extrapolating “2-3× per year” growth rates, which on the high end of things would’ve led to a forecast of $19.2 billion. That’s a lot closer to the $30.4 billion resolution, but still would’ve fallen short.
If I’m right, then the reason these forecasters were off was more about how OpenAI and Anthropic revenues grew like crazy. And I really mean crazy — the annualized revenue increased from around $6.4 billion to $30.4 billion, which is around 4.8× in a year!
Public attention on AI
The last question of the survey was about public concern about AI, specifically: “What percentage of Americans will identify computers/technology advancement as the US’s most important problem by December 31st 2025?”.
The median forecaster ended up overestimating somewhat. Depending on what time period you average over, the answer was around 0.625%, compared to around 0.4% or 0.45% by the end of last year. In contrast, the median forecast was around 2%. So there’s some degree of overestimating public concern going on here.
This overestimation seems more egregious for the handful of people who gave substantially higher forecasts, say north of 5%. Some of these respondents thought that public attention would really spike because of job market impacts and increasing concerns about AI safety, which hasn’t really panned out.
Maybe it’s a mistake for me to read too much into this — I suspect people didn’t put too much thought into the exact numbers, and instead just chose fairly round numbers like 1% or 2%, thinking that public attention would increase but remain small. But overall I’d say this looks a bit like what economists frequently accuse me of — being a “technologist” who overestimates the importance of their technology.
Takeaways from the survey
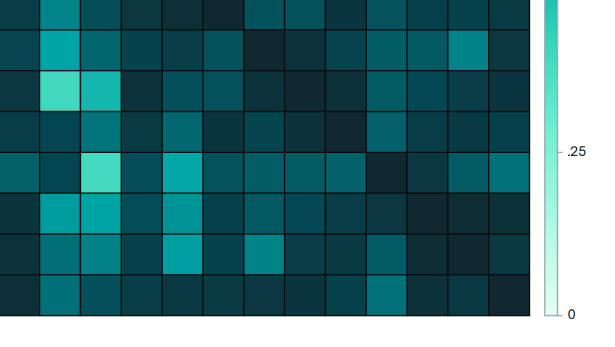
If I had to summarize the results in a single sentence, I’d say that the forecasters were mostly right about benchmark scores, but had mixed results with the risks in OpenAI’s preparedness framework and on real-world impacts. Most notably, they underestimated revenue and CBRN risks, and overestimated public concern about AI. We can see this in the following image:
For the most updated version of this, see the “Summary” tab of the original forecasting survey.
To me, these results really bring an important question back to center stage: “how much do benchmarks reflect broader societal impacts?”. Survey respondents did pretty well forecasting improvements on AI R&D benchmarks, but we should always be clear about what these benchmarks really tell us. For example, while RE-Bench is designed to track AI R&D, the tasks tend to be very “clean”, with nice feedback loops and few tasks occurring in parallel, which is quite unlike real-world AI research with millions of lines of code. It’s a useful benchmark, but doing well on it doesn’t imply, for example, that AI R&D is automatable.
It’s also a good time for researchers and forecasters to figure out how we can improve our forecasts of real-world impacts. One relatively obvious answer is to gather more data about these impacts — the forecasters in this survey probably did worse on real-world impacts in part because they had less high-quality data to extrapolate. So if we want to improve our future forecasts, we should probably gather data on a range of real-world indicators, especially as AI’s impacts continue expanding beyond the Silicon Valley sphere.
So what does this all mean for AI progress and its societal impacts? Dwarkesh writes, “Models keep getting more impressive at the rate the short timelines people predict, but more useful at the rate the long timelines people predict.” I think the results of this survey largely support this, though maybe the point about revenue is a counterpoint — the annualized revenue numbers seem to suggest they’re getting more useful faster than both the short and long timelines people predict!
Another way to look at it is this: the survey respondents were probably more bullish on rapid near-term AI progress than almost anyone else in the world, and yet they substantially underestimated AI revenue! So perhaps, despite all the hype, AI is an even bigger deal than we thought.
I’d like to thank Eli Lifland, Adam Binksmith, JS Denain, Lynette Bye, Josh You, Tao Lin, and Greg Burnham for their feedback and support on this post.
Appendix
In the main post I focused on the main high-level takeaways from the forecasting survey, for a general audience. In contrast, this appendix is for those of you who are also interested in the nitty-gritty details, like on the distribution of responses and how we should interpret the data.
Benchmarks relating to AI R&D
The survey focused on the following five benchmarks:
- RE-Bench: Seven open-ended machine learning problems like “fine-tune GPT-2”.
- SWE-Bench Verified: Resolving small real-world GitHub issues in Python.
- Cybench: Professional cybersecurity competition tasks like exploiting vulnerabilities in web apps.
- OSWorld: Simple computer-use tasks like duplicating powerpoint slides.
- FrontierMath: Extremely challenging math problems with automatically verifiable answers.
The first three of these seem pretty clearly related to AI R&D, involving tasks with lots of coding. OSWorld and FrontierMath are more debatable, but they do capture skills that are probably quite important for this, namely computer-use and deep technical reasoning. Performance on FrontierMath and OSWorld are overall also quite correlated with the first three benchmarks, perhaps because they capture the same latent “capability” factor across different models.
RE-Bench
Research Engineering Bench (RE-Bench) is a benchmark created by METR to measure automation of AI R&D. It consists of seven challenging open-ended machine learning problems, things like “optimizing a GPU kernel” and “finetuning GPT-2”. Each task has some starting code which achieves a certain baseline performance, and the goal is to improve performance as far as possible.
Trouble is, the most natural measures of performance look quite different across each of these problems. To make them more comparable in an apples-to-apples way, the METR researchers had to normalize these different metrics, where 0 is the starting performance of the reference code, and 1 corresponds to a human baseline set by human experts. Then they average across the tasks.
At the end of 2024, the highest AI score was 0.61, held by Claude 3.5 Sonnet. The median forecast was 1.1, which is very close to the final resolution of 1.13. That said, this final resolution is based on scores from Gemini 3 Pro — it’s plausible that Claude Opus 4.5 or GPT-5.2 would’ve done better had they been evaluated, making the forecast an underestimate. Note that this evaluation with Gemini only considers 5 of the 7 RE-Bench tasks.
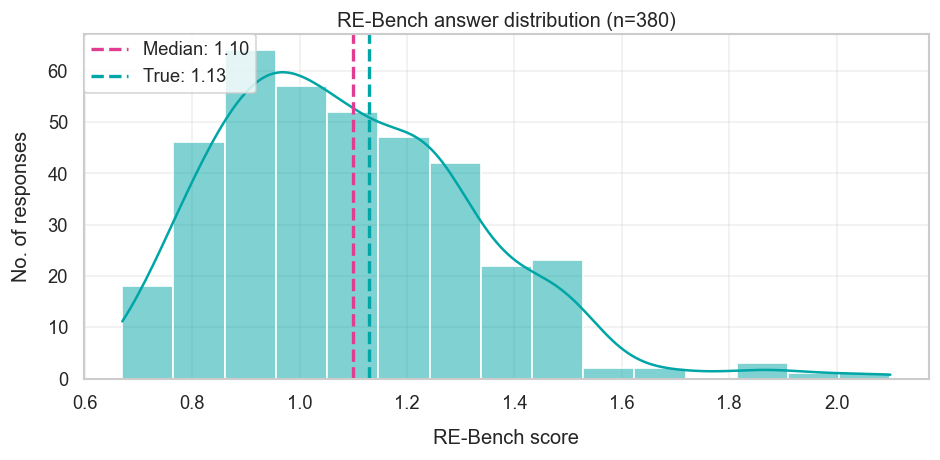
Looking at the available rationales reveals a couple of interesting takeaways. One observation is that some estimates seem to exceed what is theoretically possible. We can estimate the theoretical maximum score based on the “more info” section of the original survey. Each task has its own maximum, namely the following: 1.36, 2.53, 1.25, 1.81, 2.51, 1.8, and 1.48. If we then take the average of this we get 1.82, but some forecasted higher than this. This may be because they disagree with the maximum bound, but from reading the rationales, I suspect it’s because they weren’t considering this bound at all.
We can also look at the factors influencing how aggressive and conservative the forecasts were. Those with more aggressive forecasts (e.g. with a score of 1.2 or higher) tended to think that RE-Bench-esque tasks would be heavily optimized for, are amenable to reasoning model improvements, and have fast feedback loops. Those who forecasted below 0.9 seemed to not provide very substantive rationales (e.g. saying things like “this was a naive guess”). And those with forecasts in between these two ranges tended to anchor a bit more to previous rates of improvement — that said, it’s not always clear what data they were using to determine these rates, because different extrapolations seemed to yield different forecasts.
SWE-Bench Verified
The SWE-bench Verified benchmark consists of 500 software engineering problems drawn from real GitHub issues. These are Python-specific and verified by human annotators to remove errors.
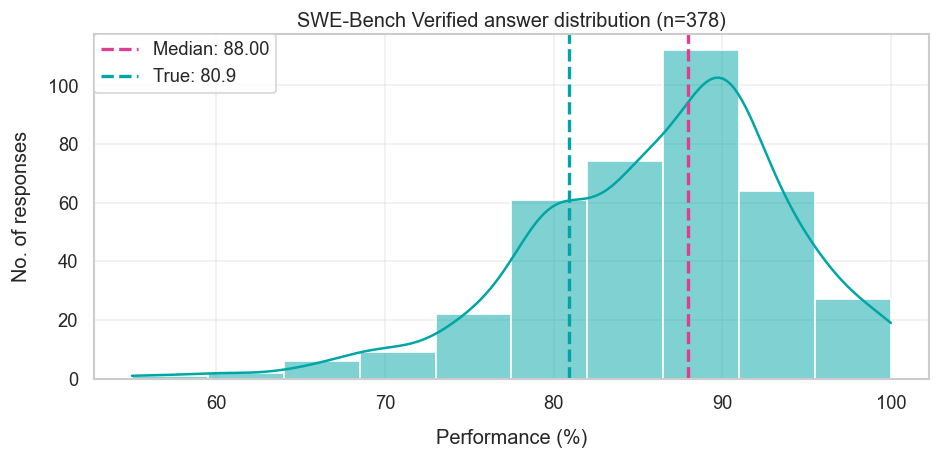
Since this was discussed in depth in the main post, I won’t elaborate much on this here. However I’ll add that some of the rationales for slower forecasts seemed to be reasoning from a lower baseline than o3’s 71% (instead they were a 55% baseline, from the Amazon Q Developer Agent). This is likely because the reference numbers provided in the survey were updated several weeks after the original release. This would tend to lower the observed forecasts, but it seems this wasn’t enough to prevent the overall forecast from overshooting the observed final performance of around 80%.
Cybench
Cybench is a benchmark with cybersecurity tasks. These were taken from professional-level “Capture the Flag” competitions, where competitors attempt to identify specific vulnerabilities in computer programs.
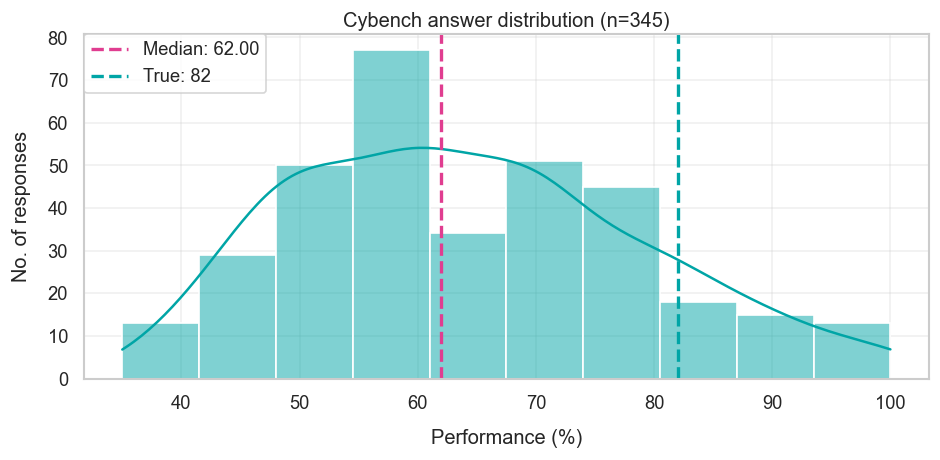
The scores are determined using the “unguided” evaluation setting. This is where the AI model is expected to perform the whole task end-to-end; without guidance on which subtasks to complete, which serve as intermediate checkpoints.
OSWorld
OSWorld is a notable benchmark consisting of 361 computer-use tasks. These tend to focus on simple realistic tasks in Linux-based environments, like adding page numbers to a document.
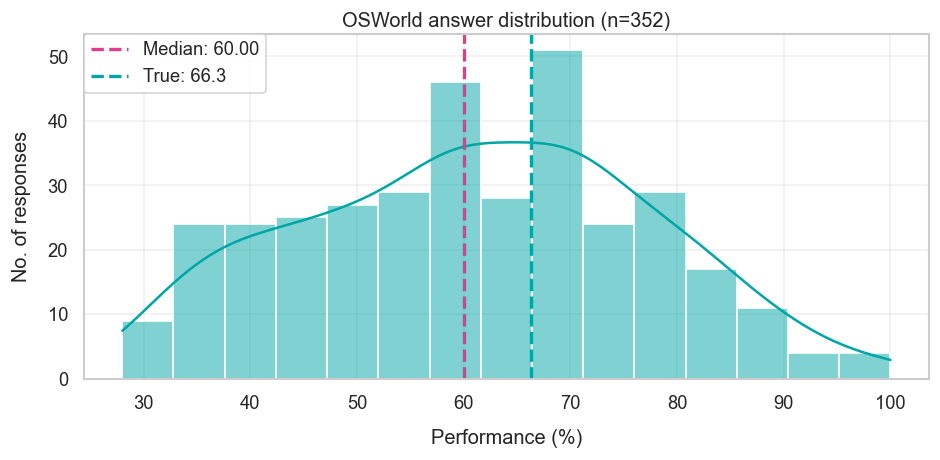
At the time of forecasting, the state-of-the-art performance was 24.5%, and the median forecast was 60%. This is fairly close to the actual performance of 66.3%, though it looks as though forecasters were quite uncertain about what performance would be achieved.
I think a lot of this boils down to different intuitions on how hard OSWorld tasks are. Those with aggressive forecasts tended to think that the benchmark tasks were like “engineering problems”, where bottlenecks to higher performance would probably be resolved just by spending more researcher time and effort. Those with conservative forecasts tended to think that OSWorld required multimodal skills, which language models tend to struggle with. I think the latter argument is overstated — much of OSWorld can be done without a graphical user interface, though this likely wasn’t widely known when the forecasts were being made.
One final issue is that these performance numbers are harder to interpret than they might initially seem. Greg Burnham succinctly describes one such issue: “Contrary to standard practice, OSWorld is updated continuously. A major update in July changed most tasks, and 10% of task instructions have been updated since then. Furthermore, 10% of tasks rely on live data from the web. This makes it hard to compare results over time.”
FrontierMath
FrontierMath is a benchmark with several hundred extremely challenging math problems. Each one contains automatically verifiable answers, like numbers or matrices or SymPy objects.
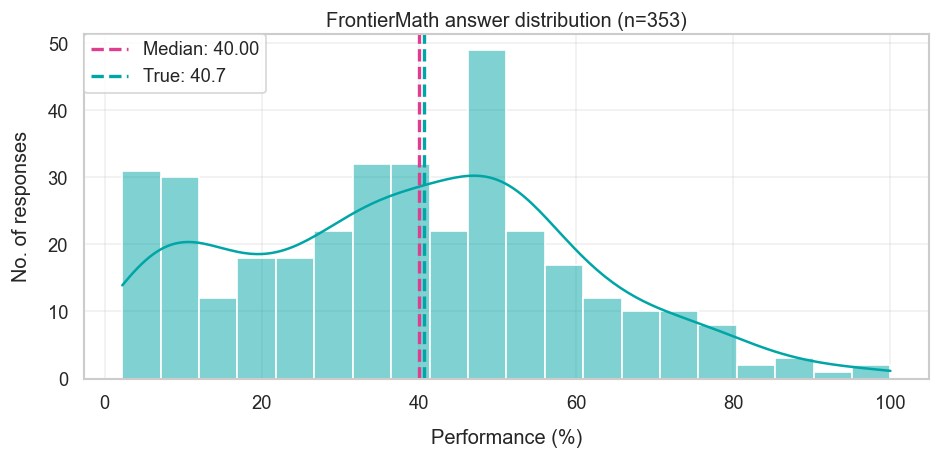
Here it seems like the median forecast was very good — 40%, compared to the true answer of 40.7%. More interesting to me is why this number wasn’t substantially higher.
For instance, in May I wrote about how I expected FrontierMath performance to clearly exceed 50% by the end of the year. In fact, I think a forecast like 75% wasn’t unreasonable — the benchmark problems are roughly such that 25% are at “undergrad level”, 50% are at “graduate level”, and the remaining 25% is “research level”. So if we expect the models to be able to do most of the “graduate level” problems, we might expect a score close to 75%. And there are other reasons too, like running simulations of benchmark progress given the limited data available at the time of forecasting. The only problem is that this turned out to be wrong.
In retrospect, I think I may have made two mistakes. The first is that these difficulty tiers don’t very cleanly delineate what problems AI systems are or aren’t able to successfully solve. This is especially because the benchmark problems can be “cheesed”, where the answer is guessed using an informal argument.
My second mistake was to update too much on o3’s release, which suddenly brought state-of-the-art performance from 2% to around 25% within a month of FrontierMath’s release. In fact, (slight) overupdating seems to have been a common issue: the median prior to o3’s release was around 30% below the resolution value, and the median after o3 was around 10% too high.
Source: AI 2025 Forecasts - May Update
One more small thing that makes this tricky is that the ~25% figure provided at the start of forecasts is based on OpenAI’s internal evaluations, whereas the final resolution was based on Epoch AI’s evaluations. The latter is often somewhat lower — for example, in the case of o3 the highest score from Epoch’s numbers is closer to 18.7%.
OpenAI’s preparedness scores, frontier lab revenue, public attention on AI
Since these were discussed quite thoroughly in the main article, I won’t add much more detail beyond sharing the main graphs.
OpenAI preparedness scores
Frontier lab revenue
Public attention on AI
Data on confidence intervals
In filling out the survey, participants were optionally allowed to add 80% credible intervals for their forecasts. We present some of the data on this in the table below:
| Question | Fraction of 80% credible intervals containing the true value |
|---|---|
| RE-Bench 380 respondents | 86.6% out of 149 valid intervals |
| SWE-Bench Verified 378 respondents | 87.0% out of 146 valid intervals |
| Cybench 345 respondents | 70.0% out of 130 valid intervals |
| OSWorld 352 respondents | 85.8% out of 127 valid intervals |
| FrontierMath 353 respondents | 76.5% out of 132 valid intervals |
| AI lab annualized revenue 317 respondents | 57.7% out of 111 valid intervals |
| Public attention 317 respondents | 73.0% out of 111 valid intervals |
-
Users with 2030-or-earlier timelines had a mean score of -0.014 on the AI R&D-related benchmarks, compared to +0.059 for those with post-2030 timelines. The medians for the same groups were +0.023 and +0.088 respectively. So the post-2030 group did slightly better, but this difference isn’t statistically significant based on a t-test (p = 0.39). You can also just see that these differences are small by looking at the leaderboard, where scores go from around -6 to 2.

About the authors
Related work