Introduction
We rely on benchmarks to measure AI capabilities, but even the best benchmarks are just narrow glimpses into what AI can do.
Consider a benchmark. If a model is really bad, it will score 0% on the benchmark. But the same is true for a model that’s extremely bad — the benchmark offers no signal to distinguish these two models, even though one is much better than the other.
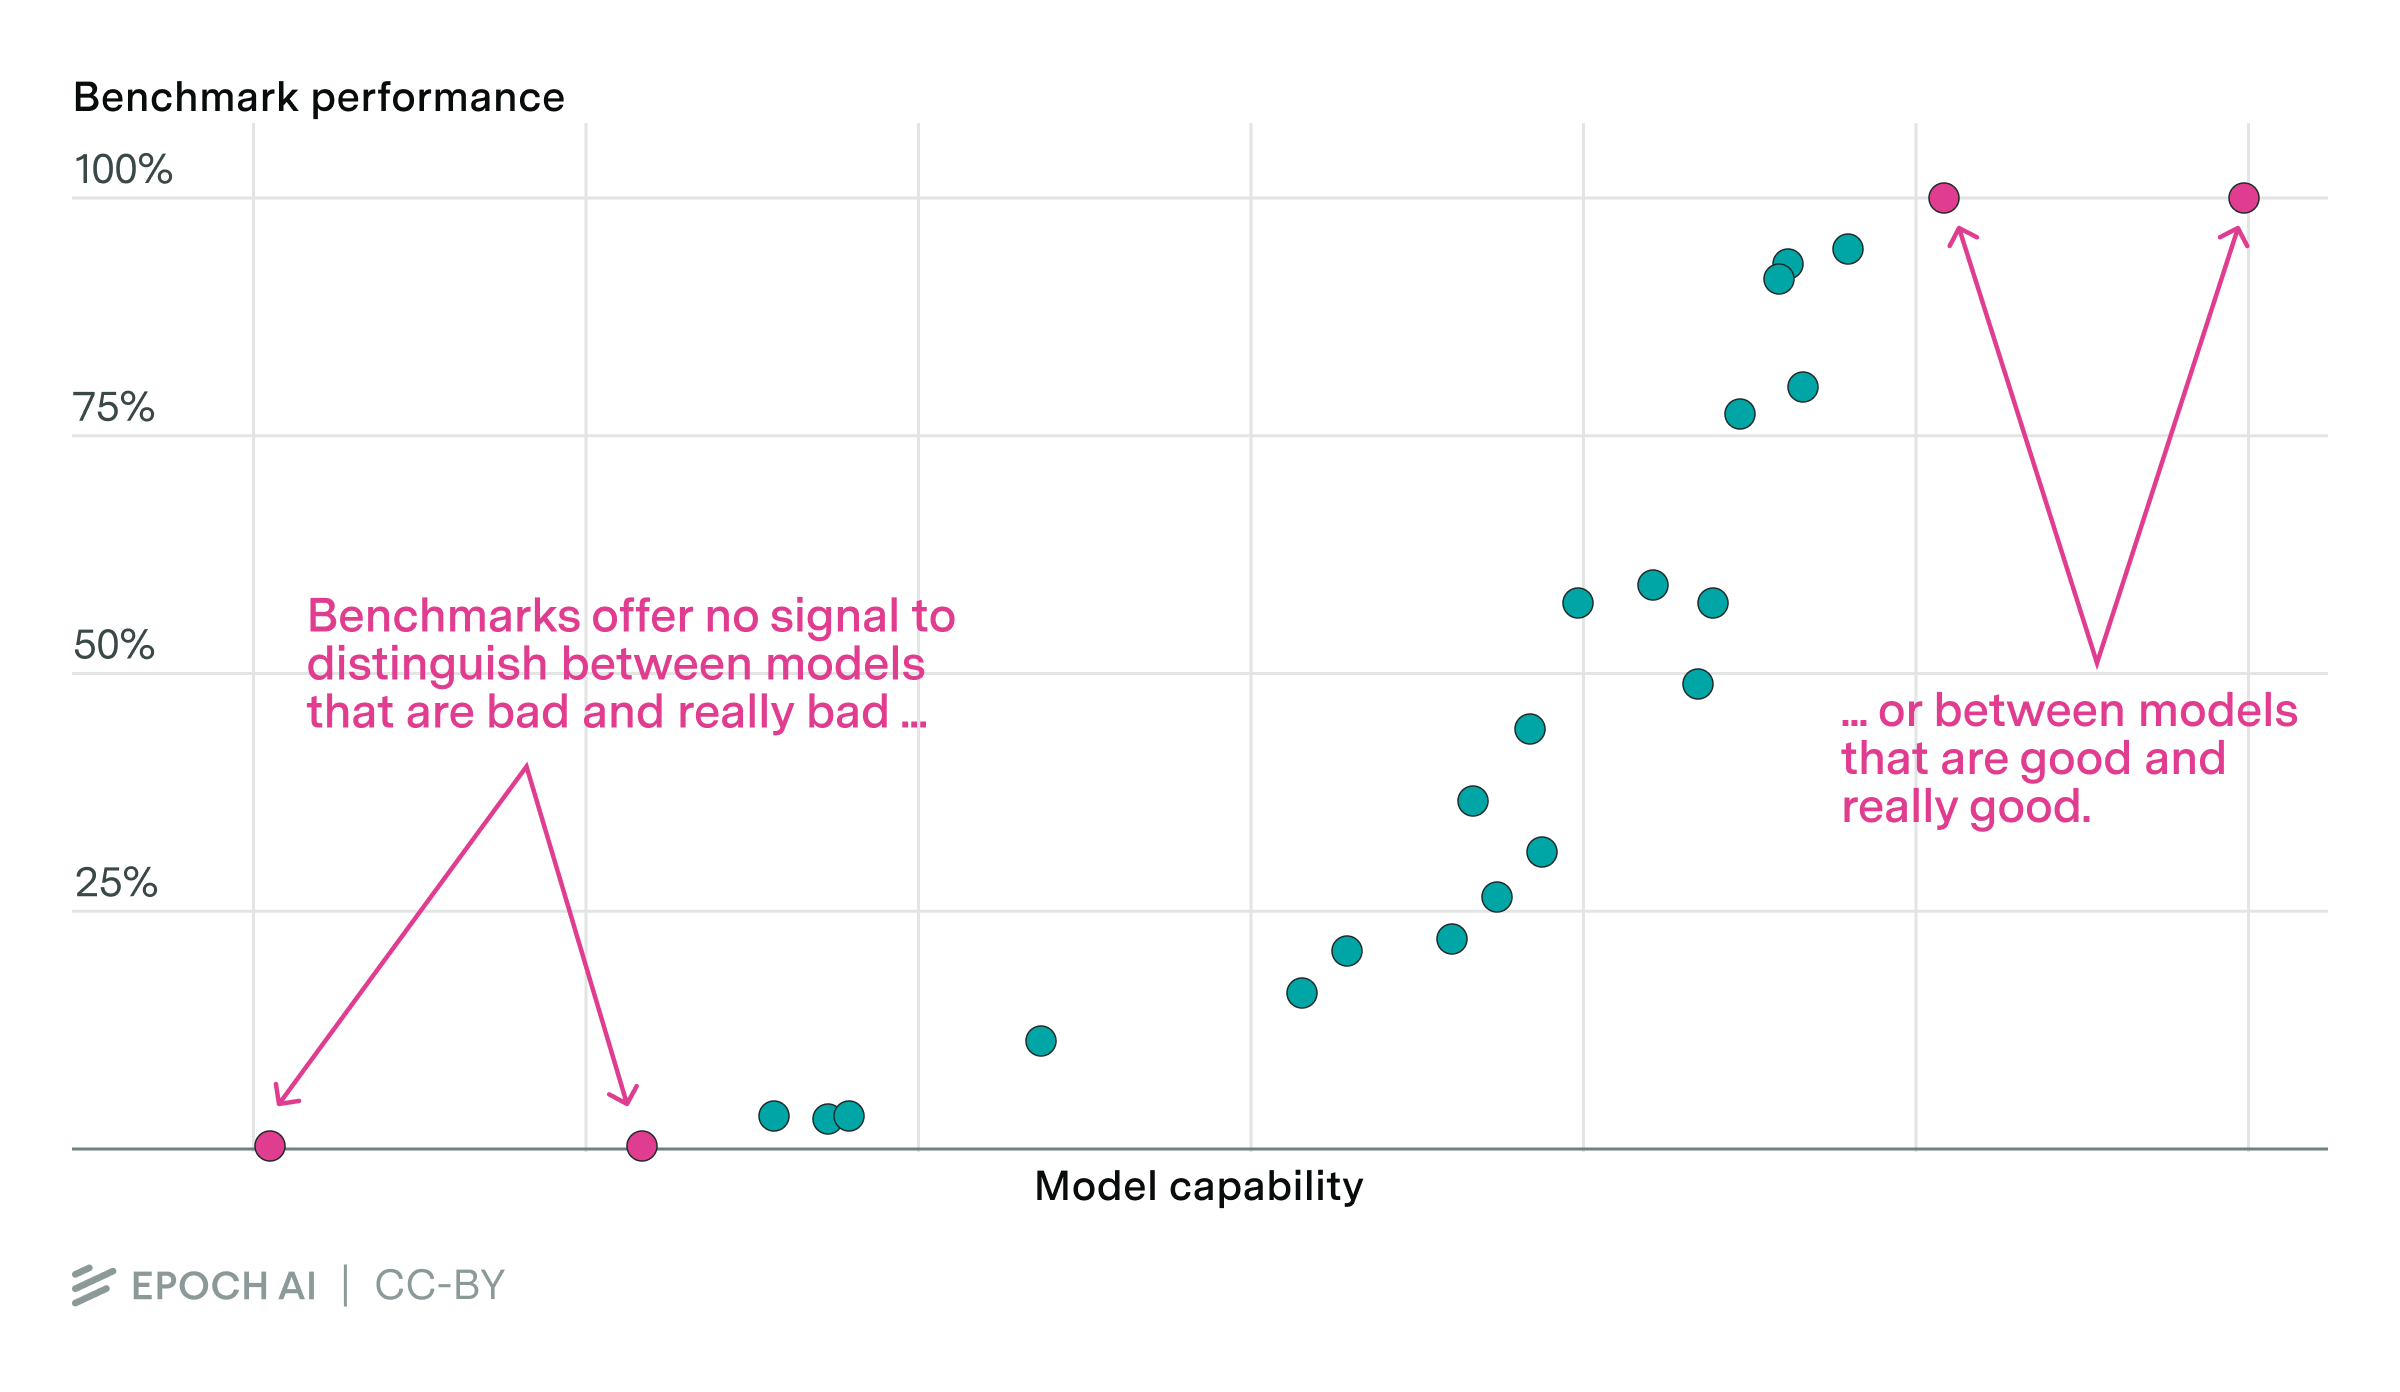
Similarly, a model that’s really good will score 100% — but so will a model that’s extremely good. We can’t tell these good models apart either.
We can only compare models when they’re in the middle — not too good and not too bad. And since models improve so quickly, their time in the middle is really short, so we can’t see long-run trends in whether AI progress is speeding up, slowing down, or hitting a wall.
A New Approach
So how do we solve this? We propose a new approach: using a statistical model, we “stitch together” multiple benchmarks with varying difficulties under a unifying framework. This is like a Rosetta Stone for AI benchmarks, which lets us translate across a wide range of benchmarks to compare models — even if they’re not evaluated on the same benchmarks.
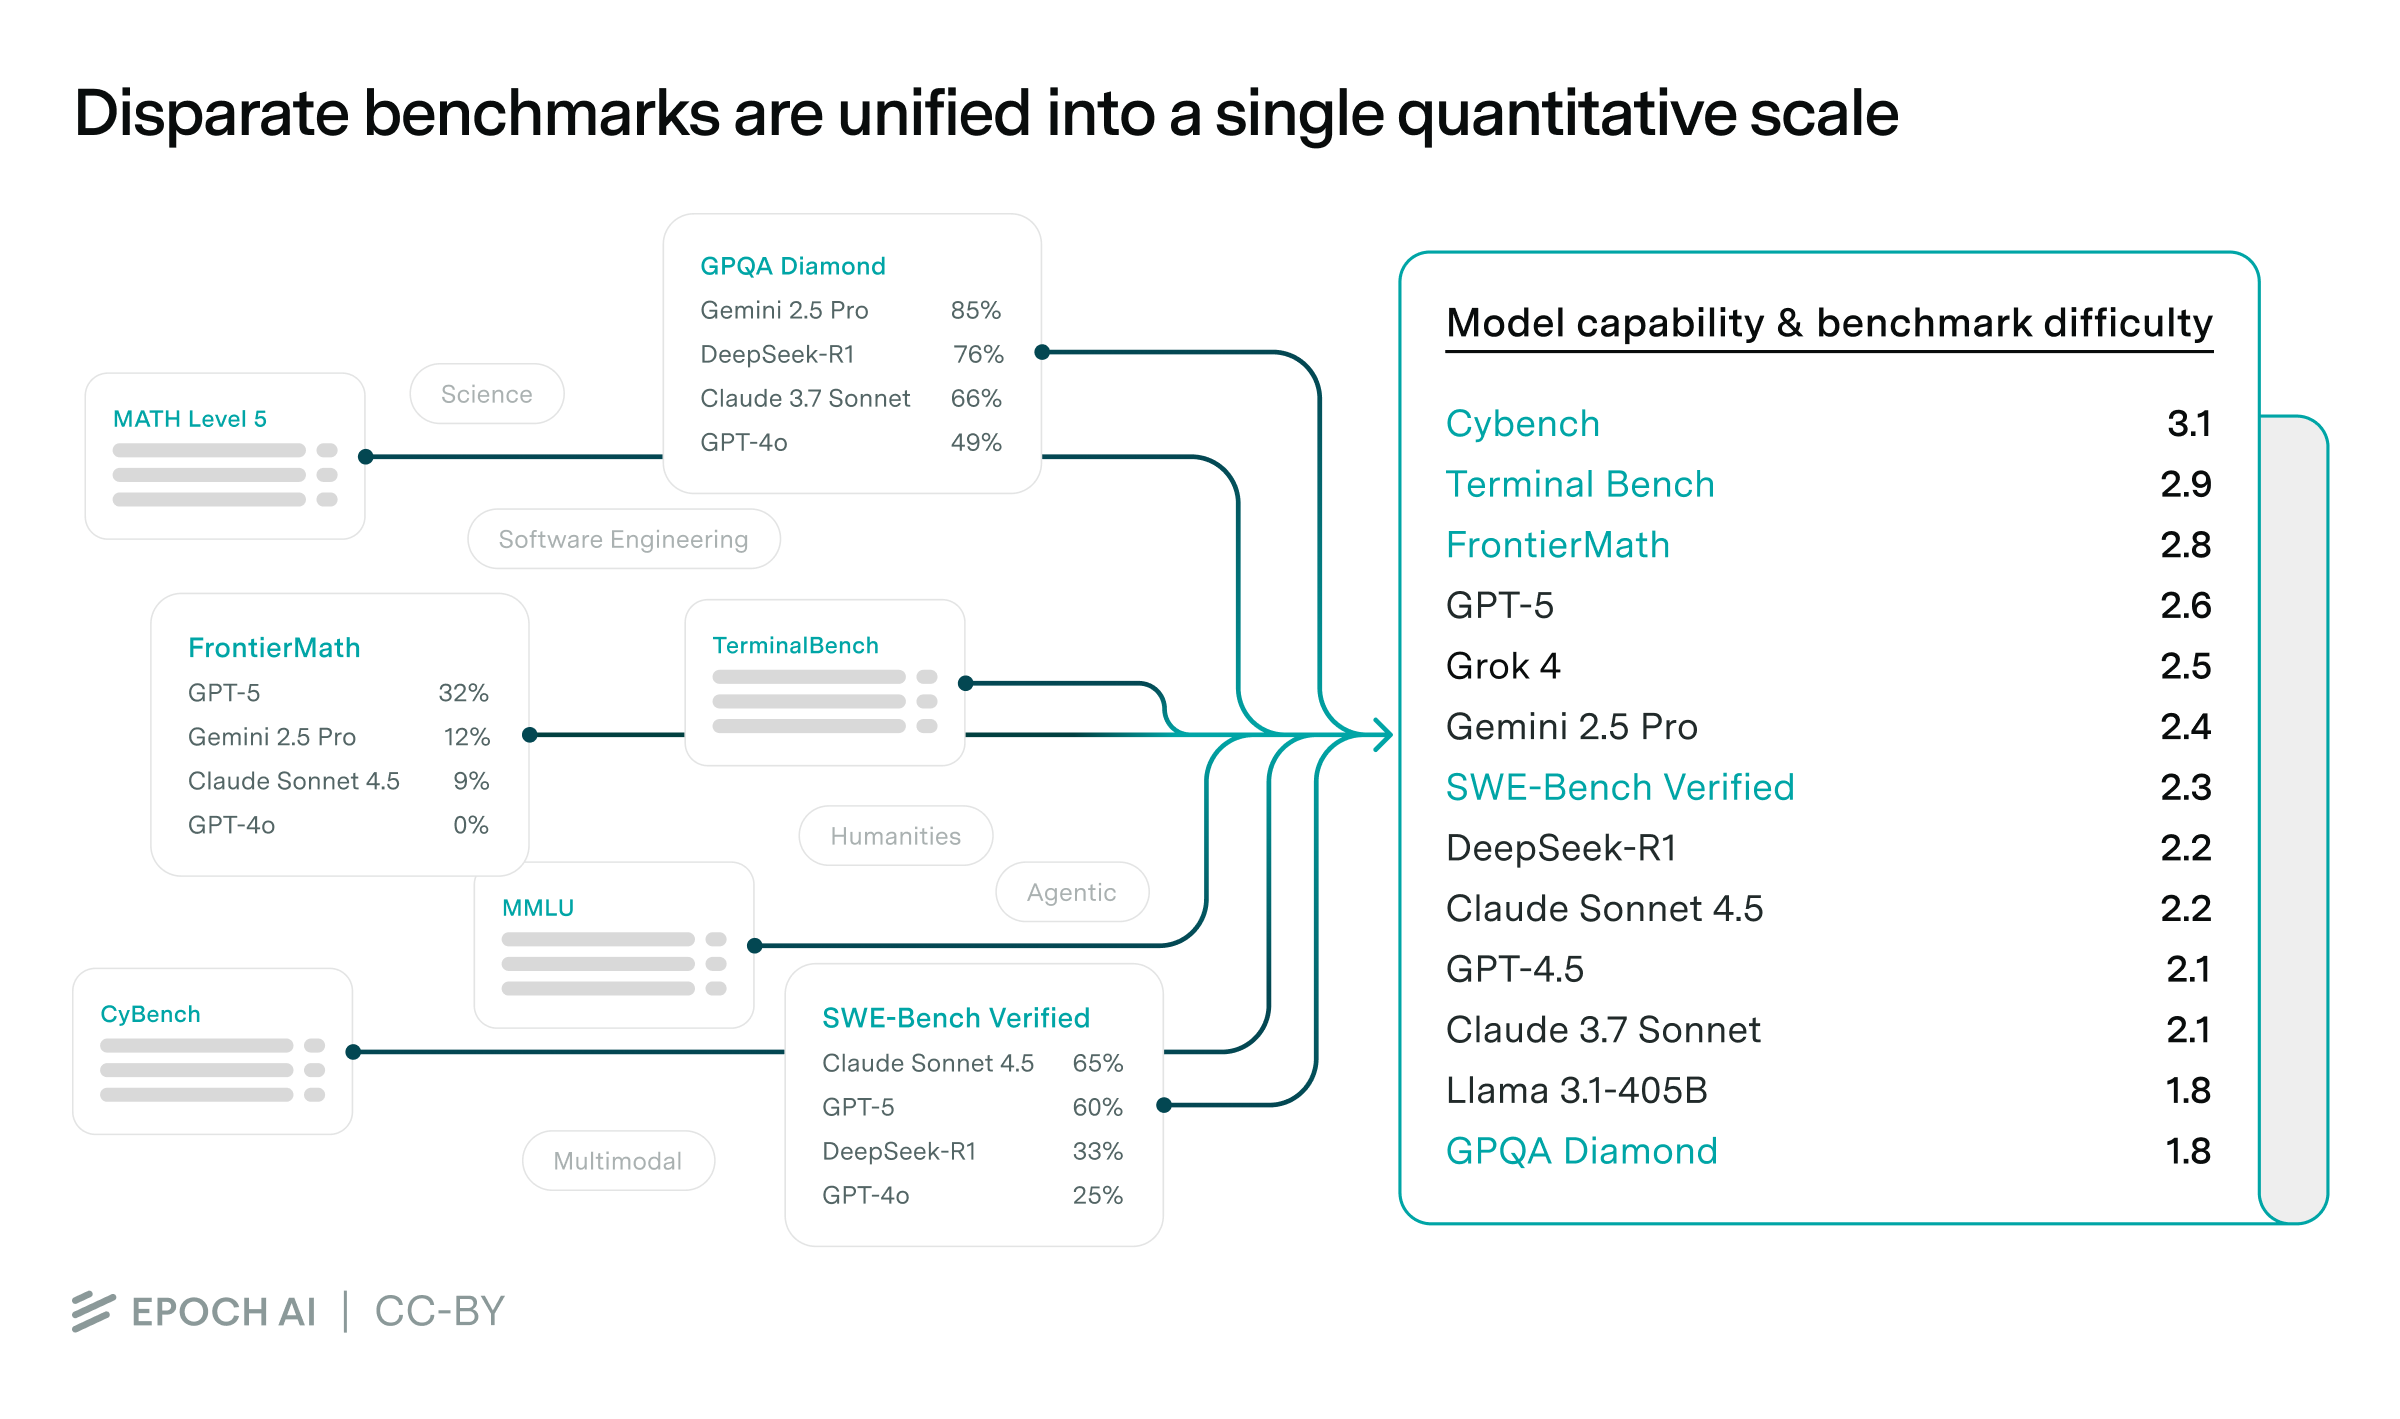
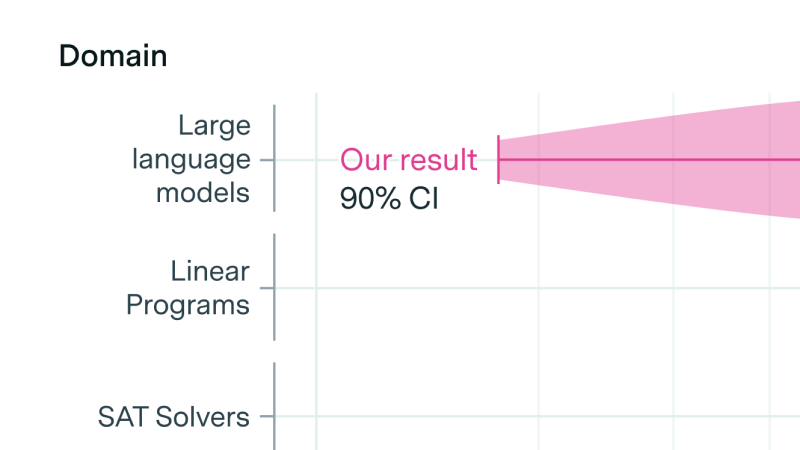
But how does this work? The core idea is to assume that each model has a single number representing its “capability”, akin to how chess players have an Elo score. Similarly, each benchmark has a single numerical “difficulty” score, akin to how chess puzzles also have Elo scores. Finally, each benchmark has a “slope” that corresponds to how quickly the benchmark saturates.
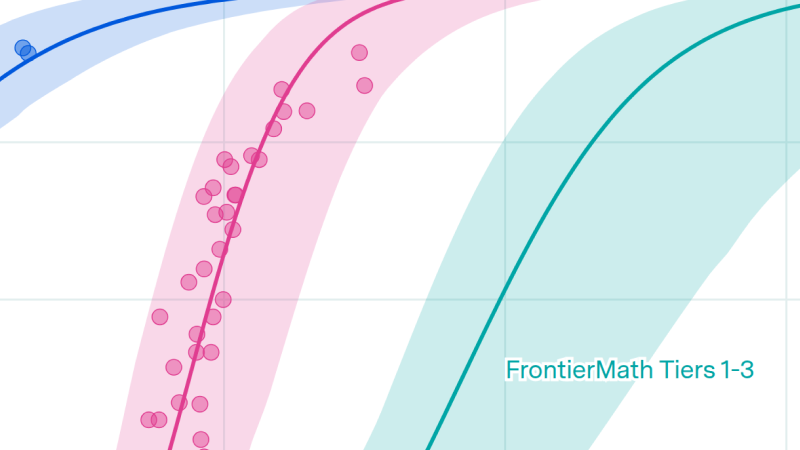
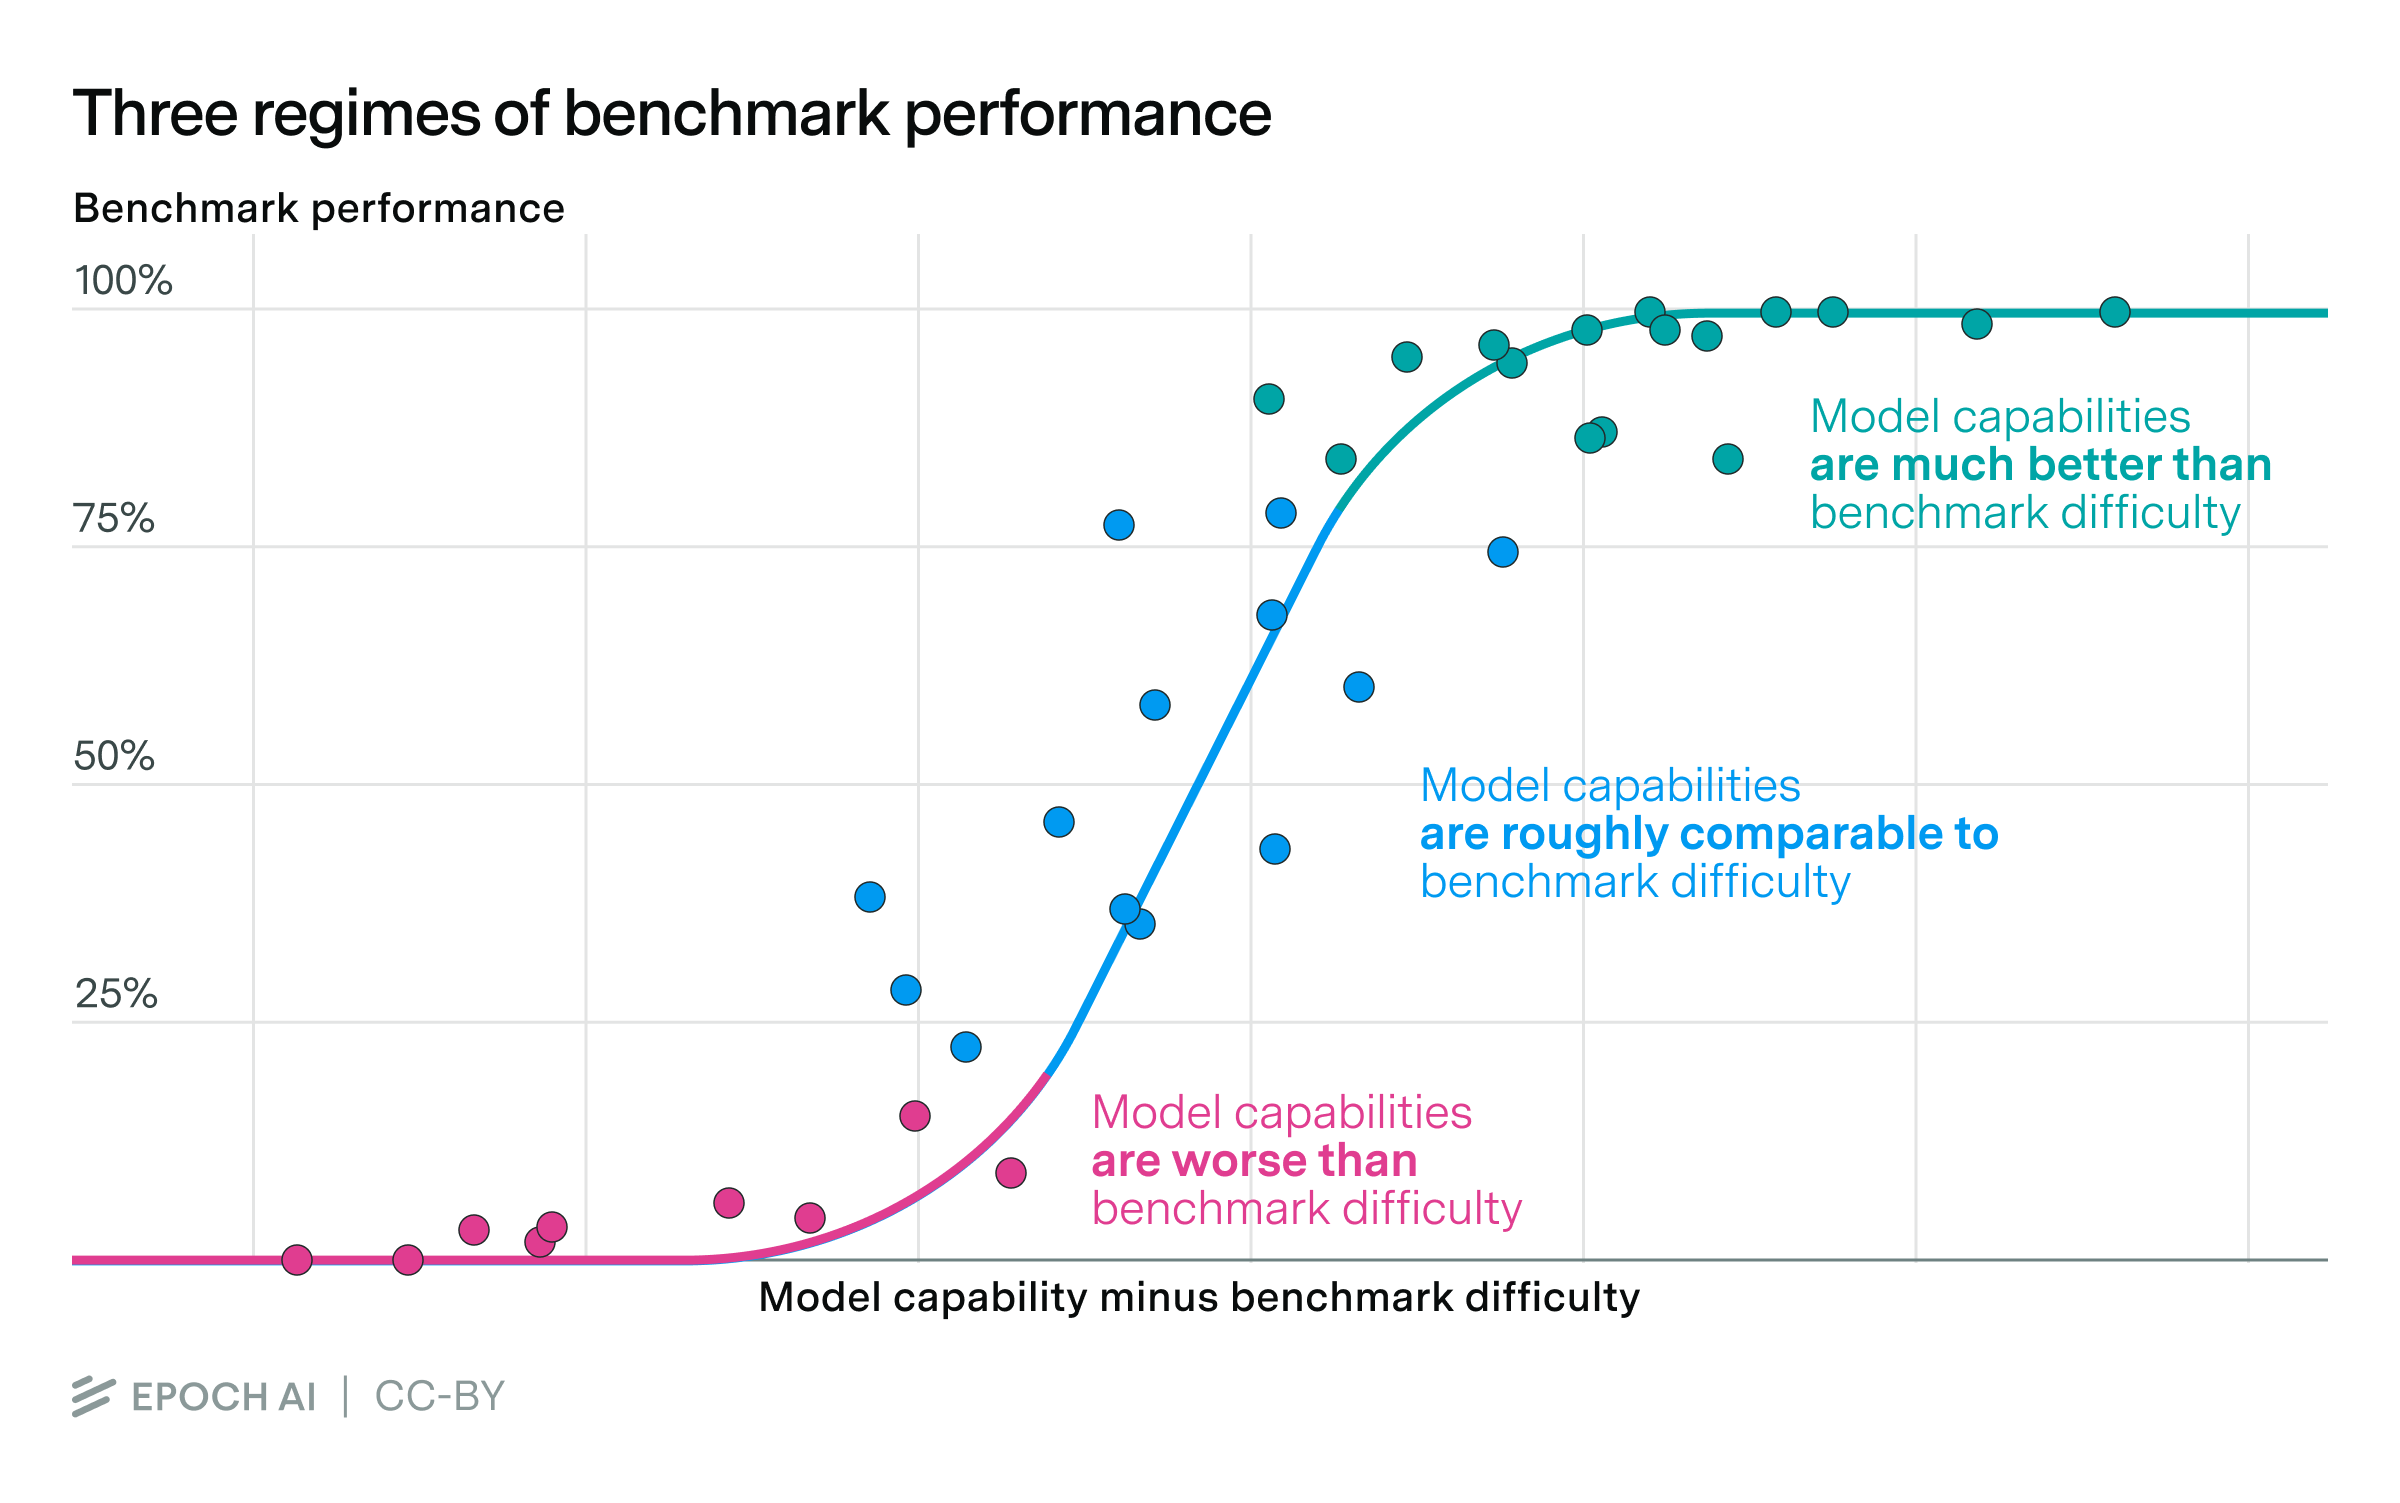
To estimate these latent parameters, we need a statistical framework that maps real-world benchmark scores to them. In the simplest framework, model capabilities grow linearly with benchmark performance indefinitely. But since benchmark performance is bounded between 0% and 100%, the map ends up looking like an S-curve, with three regimes:
- Model capability is much less than benchmark difficulty: Since the model is very bad relative to the benchmark, performance is no better than the random baseline, which is often (but not always) 0%.1
- Model capability roughly equals benchmark difficulty: This is the middle of the S-curve, where performance grows proportionally to capability, at a rate determined by the slope parameter.
- Model capability is much greater than benchmark difficulty: The model is now too capable for the benchmark, which is saturated at (or close to) 100%.
Finally, we gather data from our benchmarking hub to estimate these capabilities, difficulties, and slopes. In total, we stitch together around 40 benchmarks, estimating the capabilities of around 200 models.
What this framework tells us
This framework assumes that model capabilities can be captured by a single number, which is over-simplified. But even so, it does a lot.
For one, our method is incredibly cheap: unlike typical model leaderboards, we don’t need users to vote on model outputs, nor do we need to run new evaluations — we just have to combine existing data.
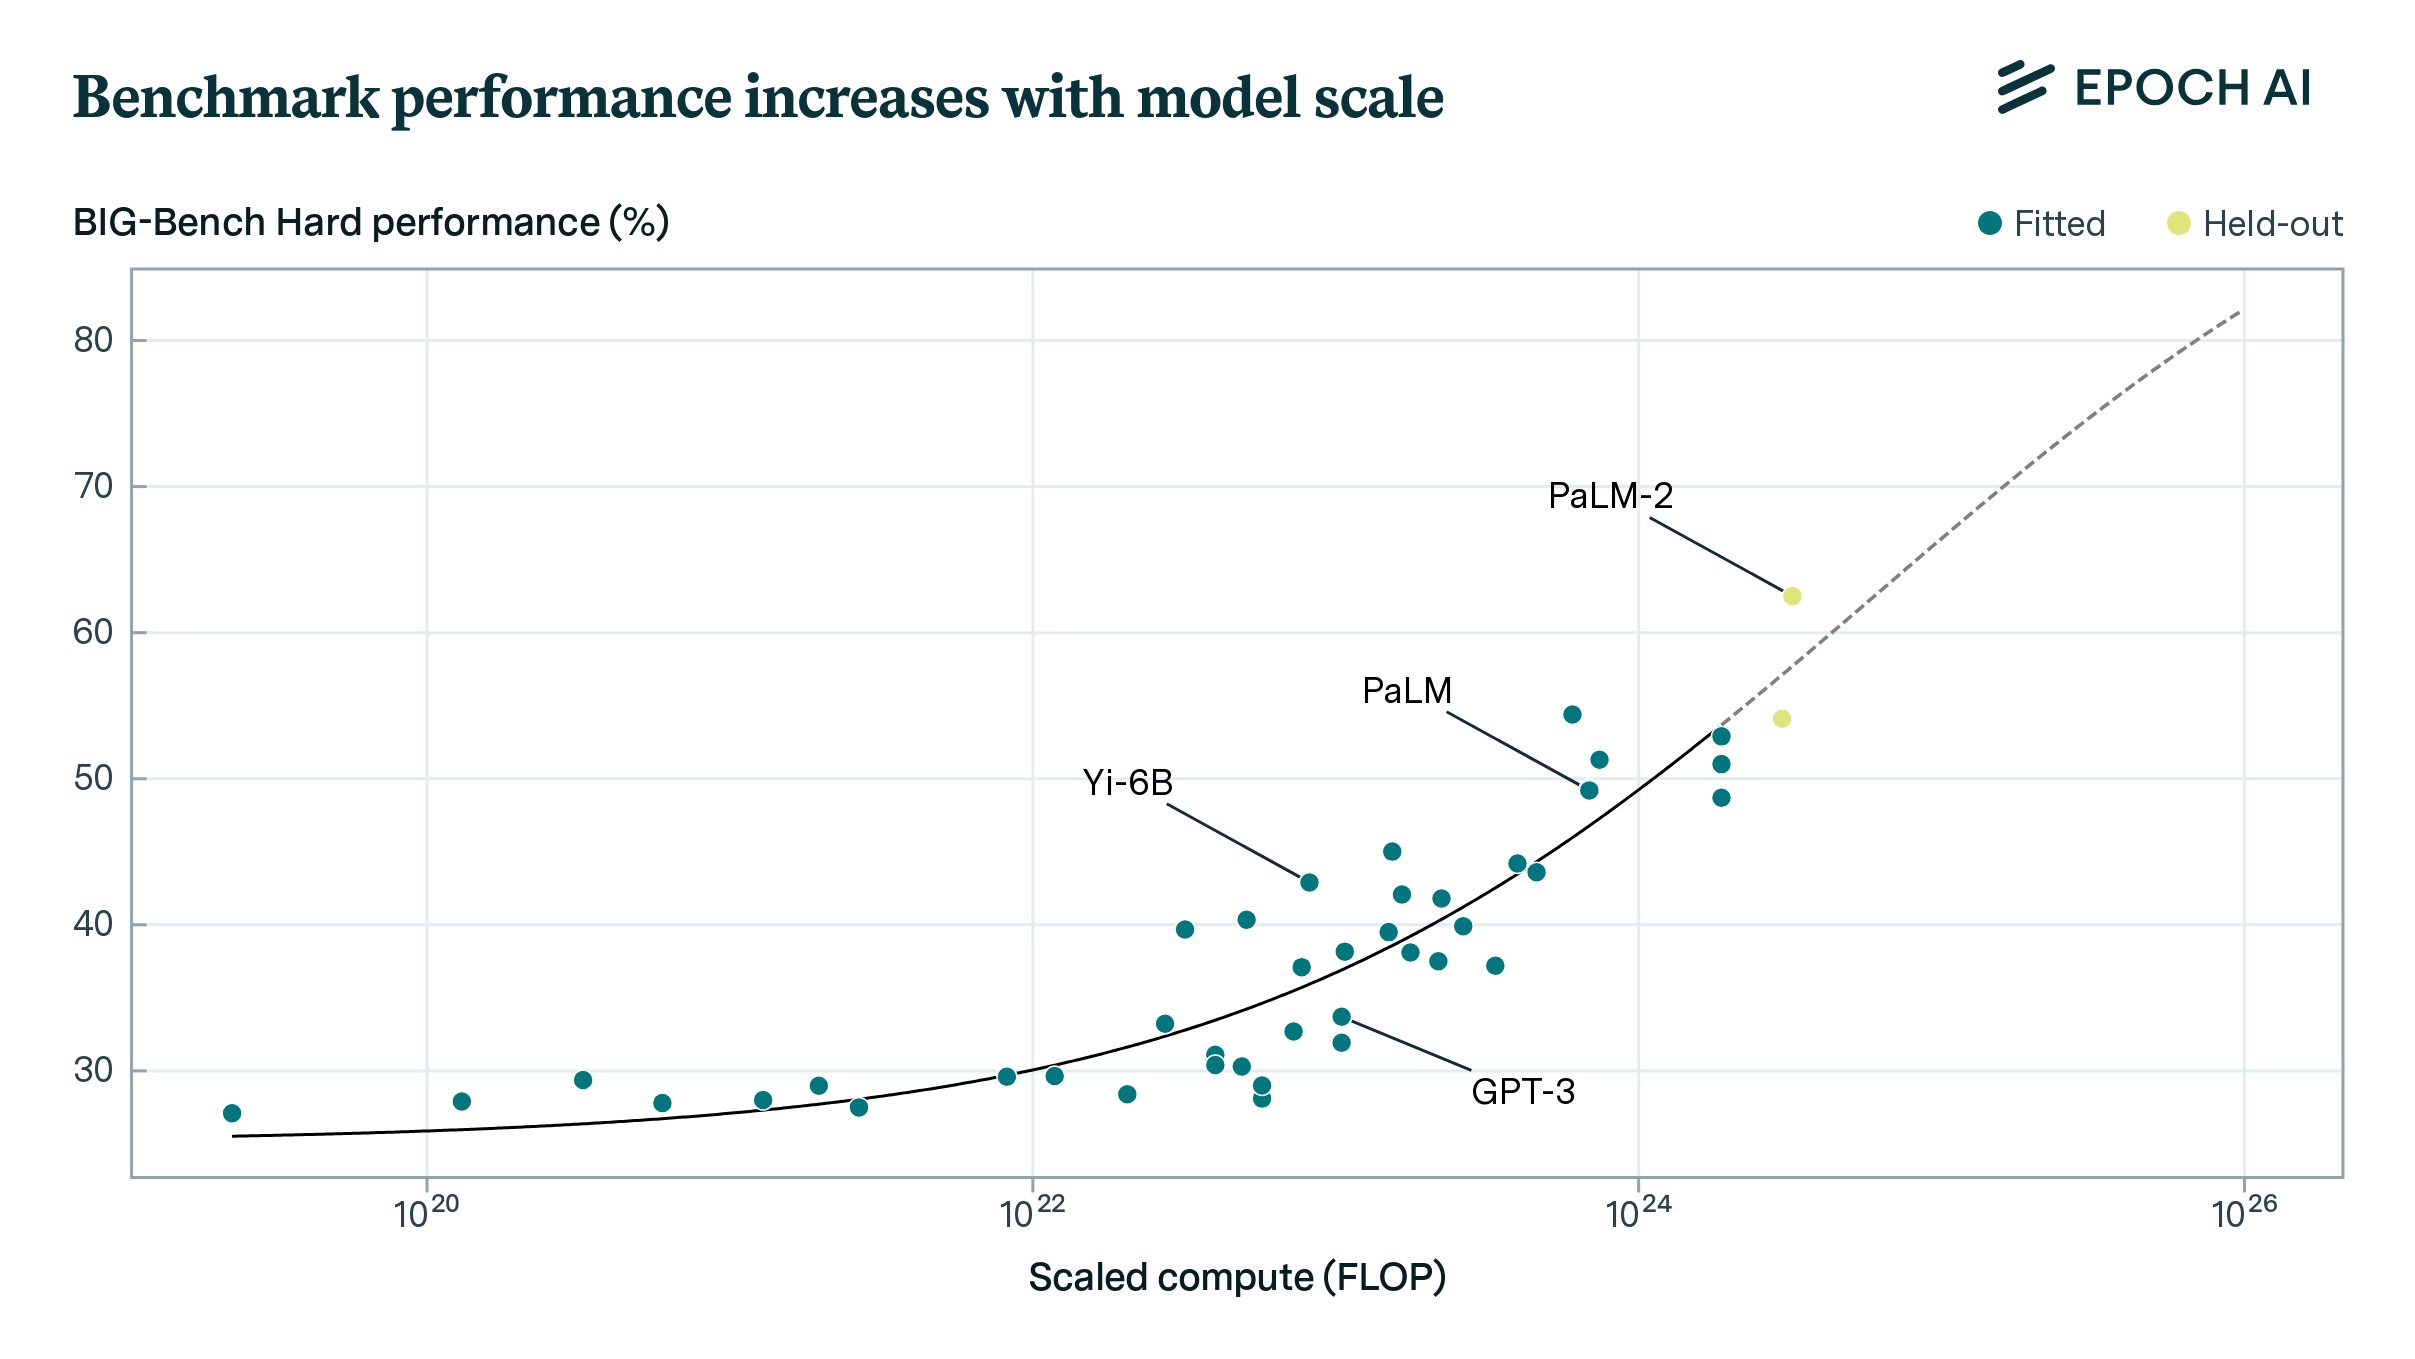
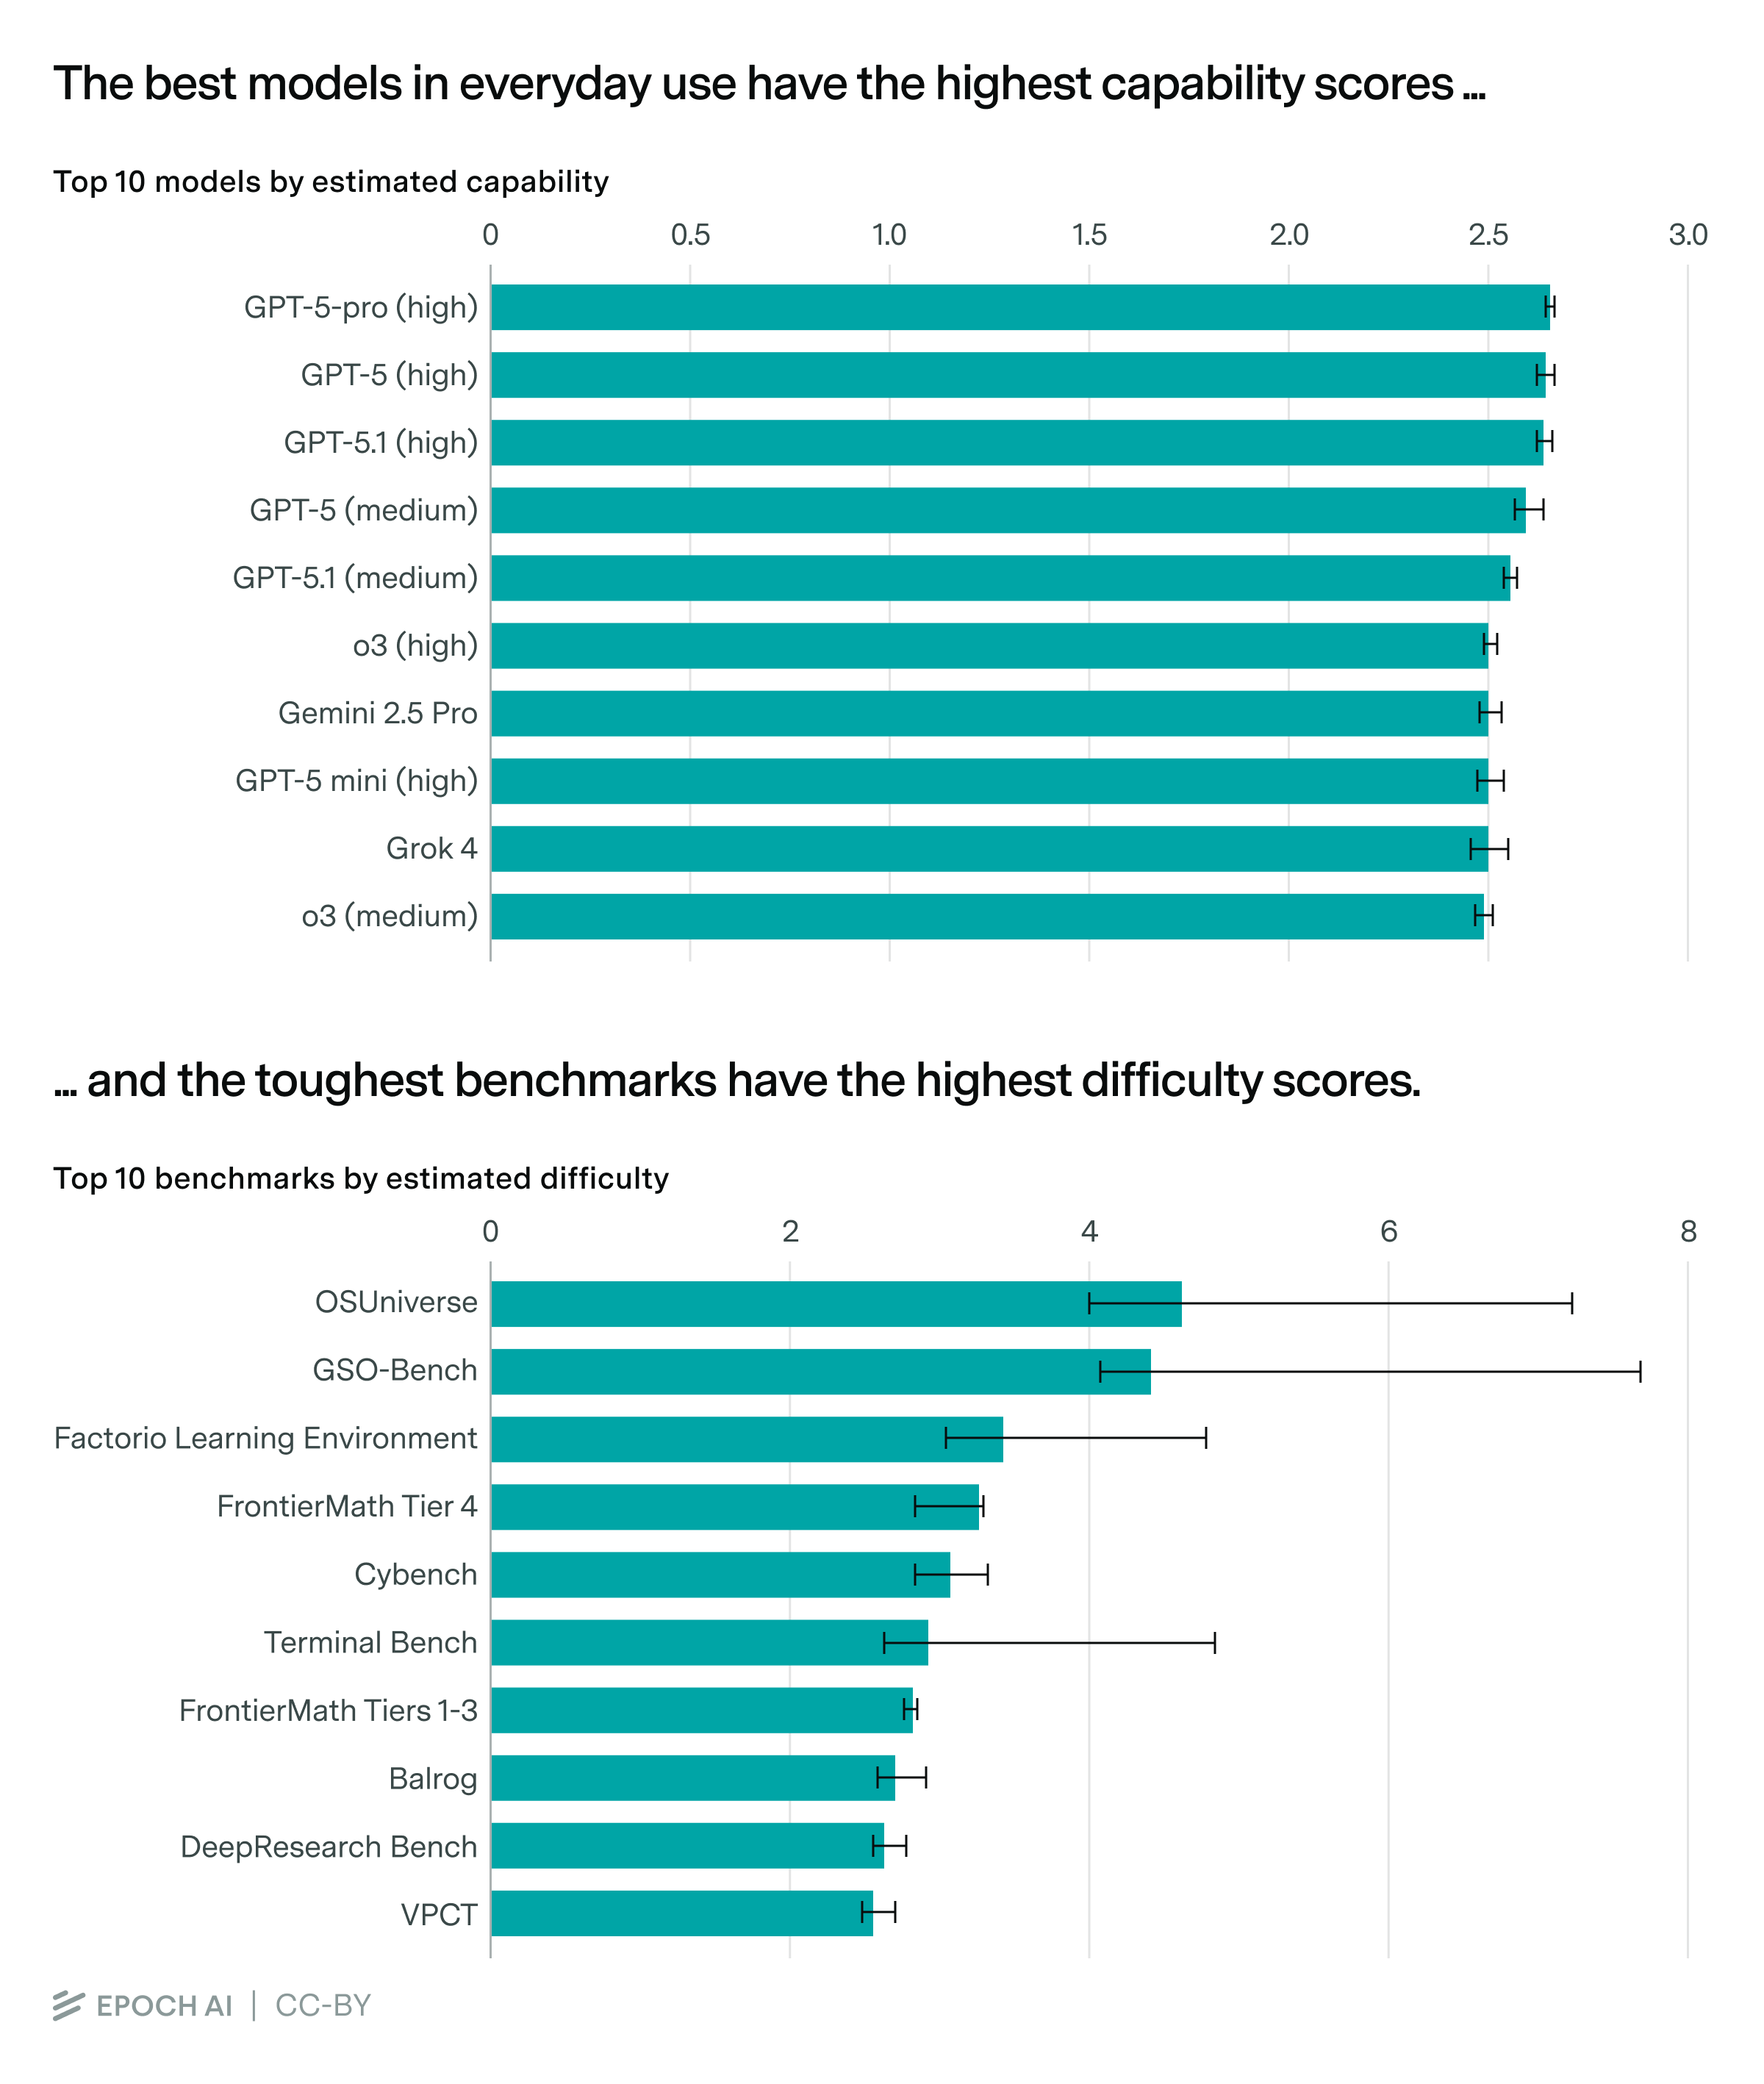
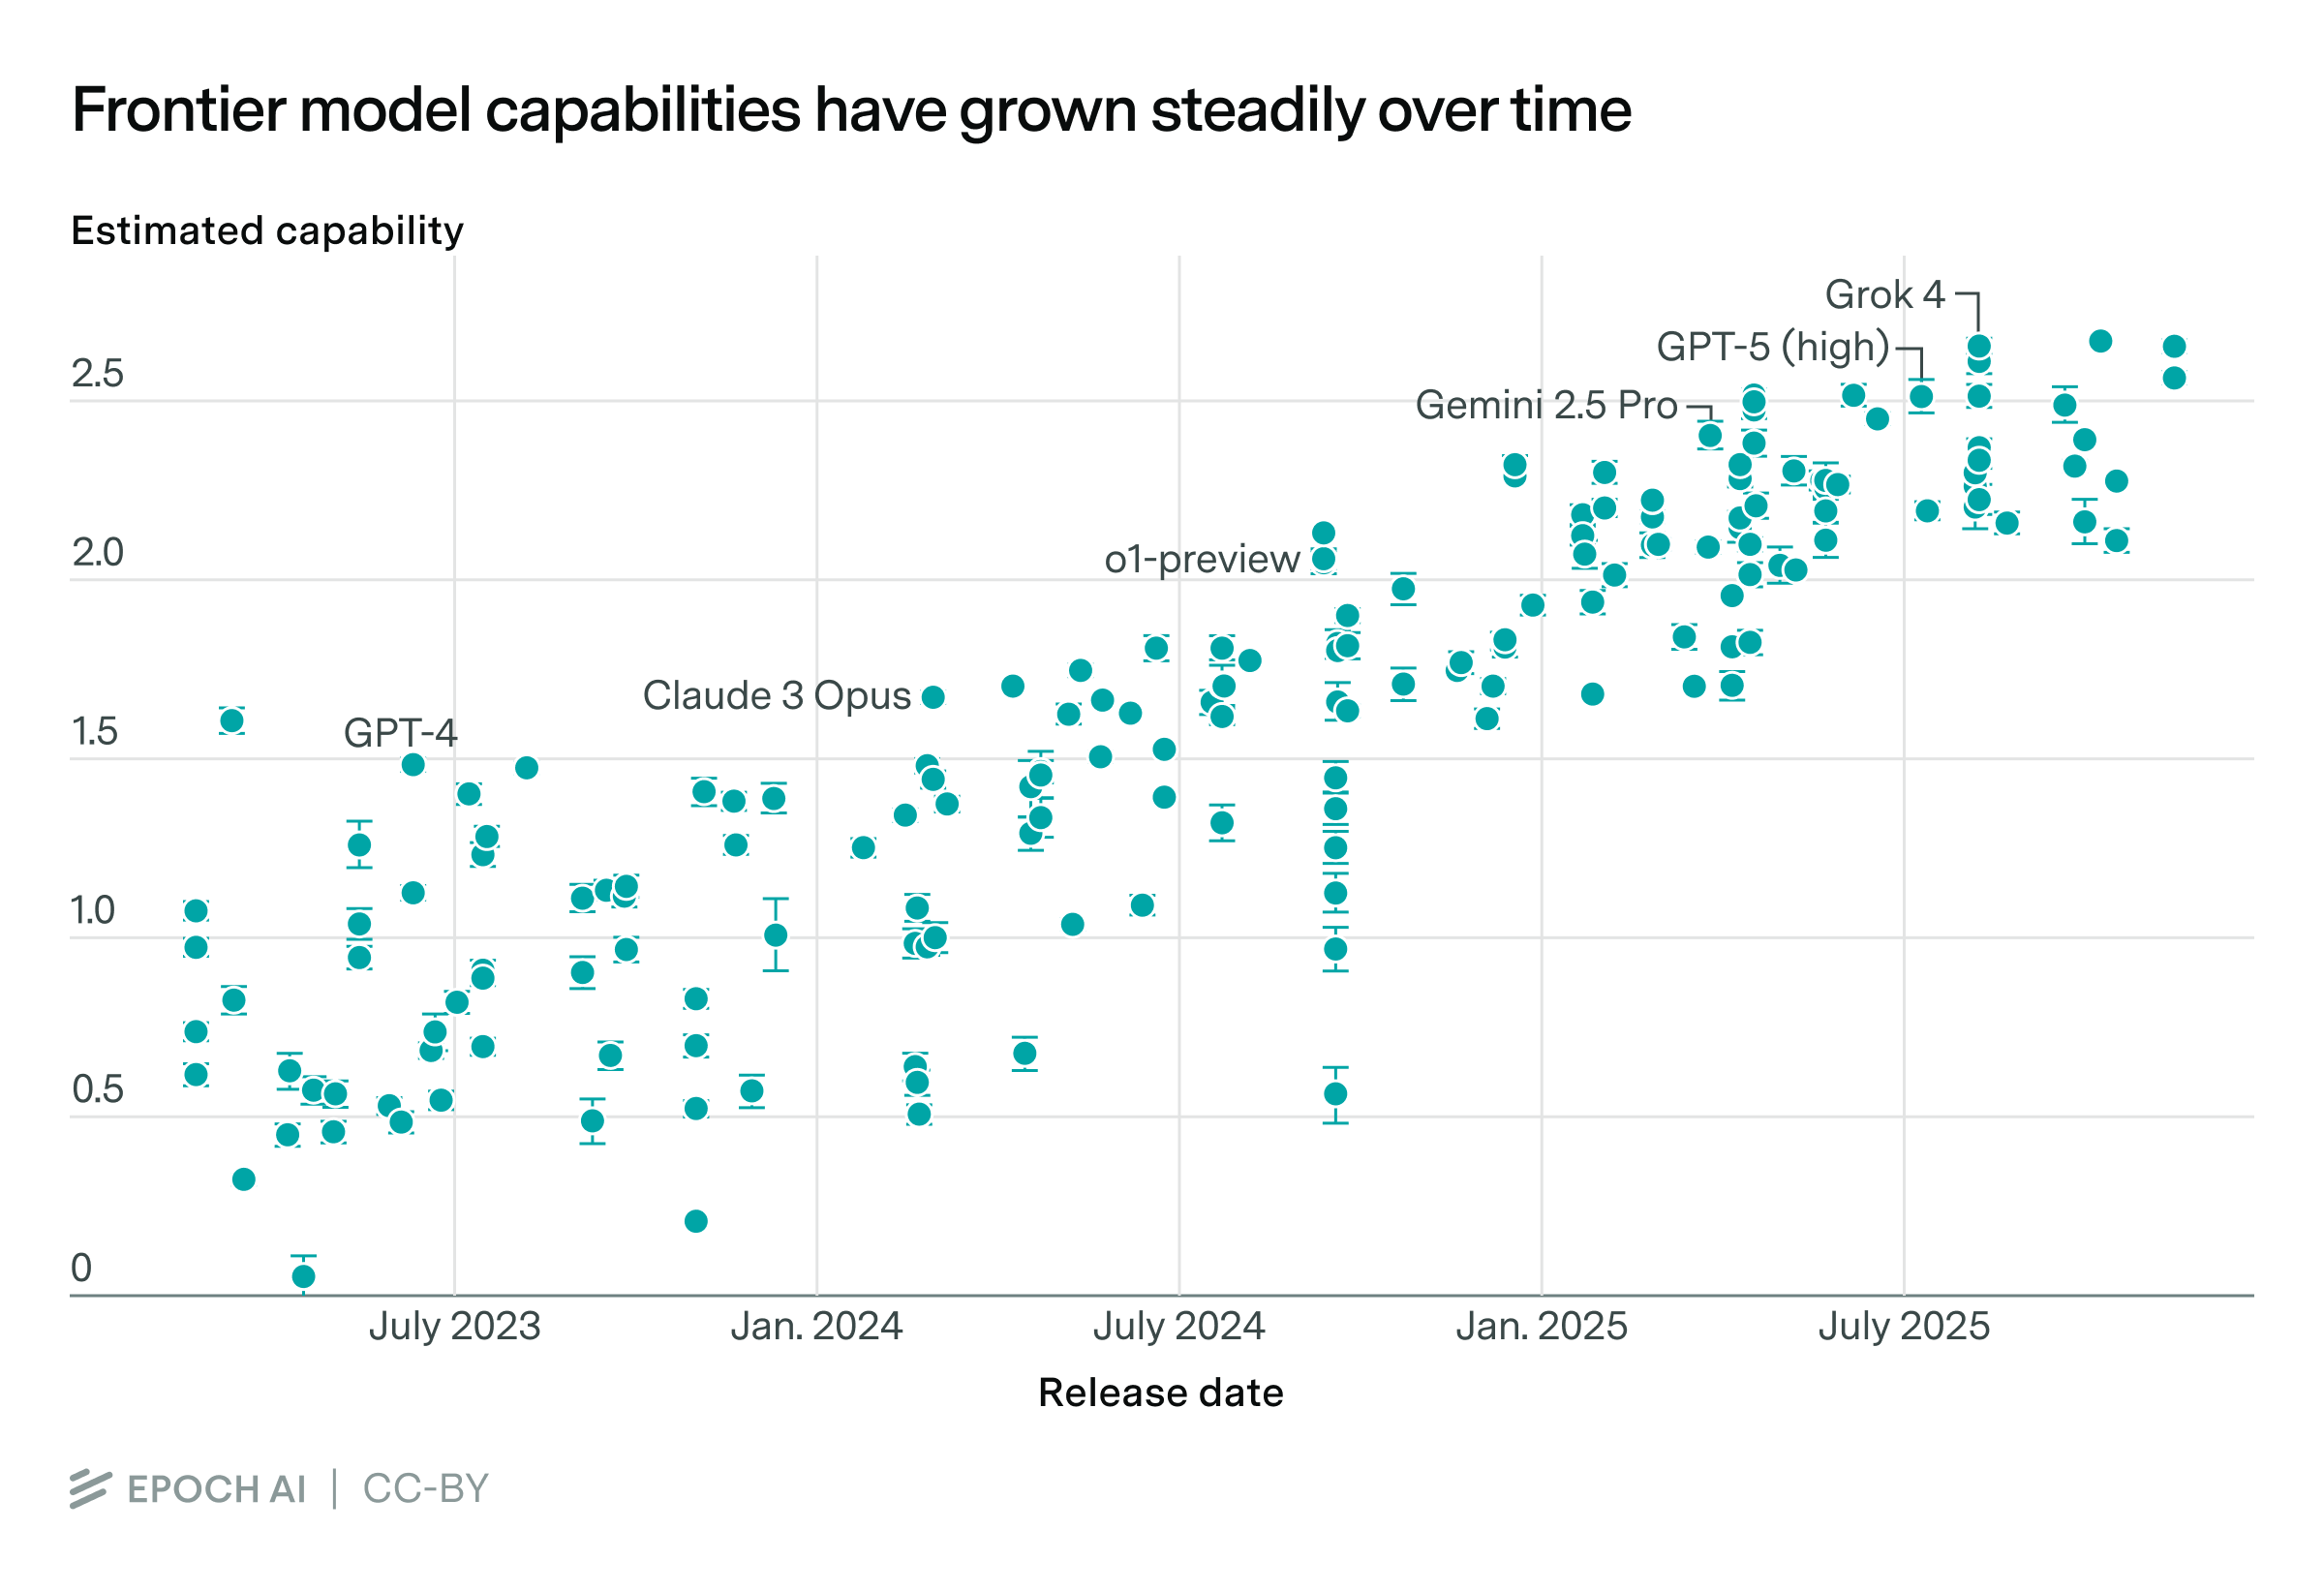
Yet reassuringly, it provides a plausible ranking of model capabilities and benchmark difficulties, with models like GPT-5.1 and Gemini 2.5 Pro near the state-of-the-art.2 This matches our intuitions from evaluations and using these models in practice,
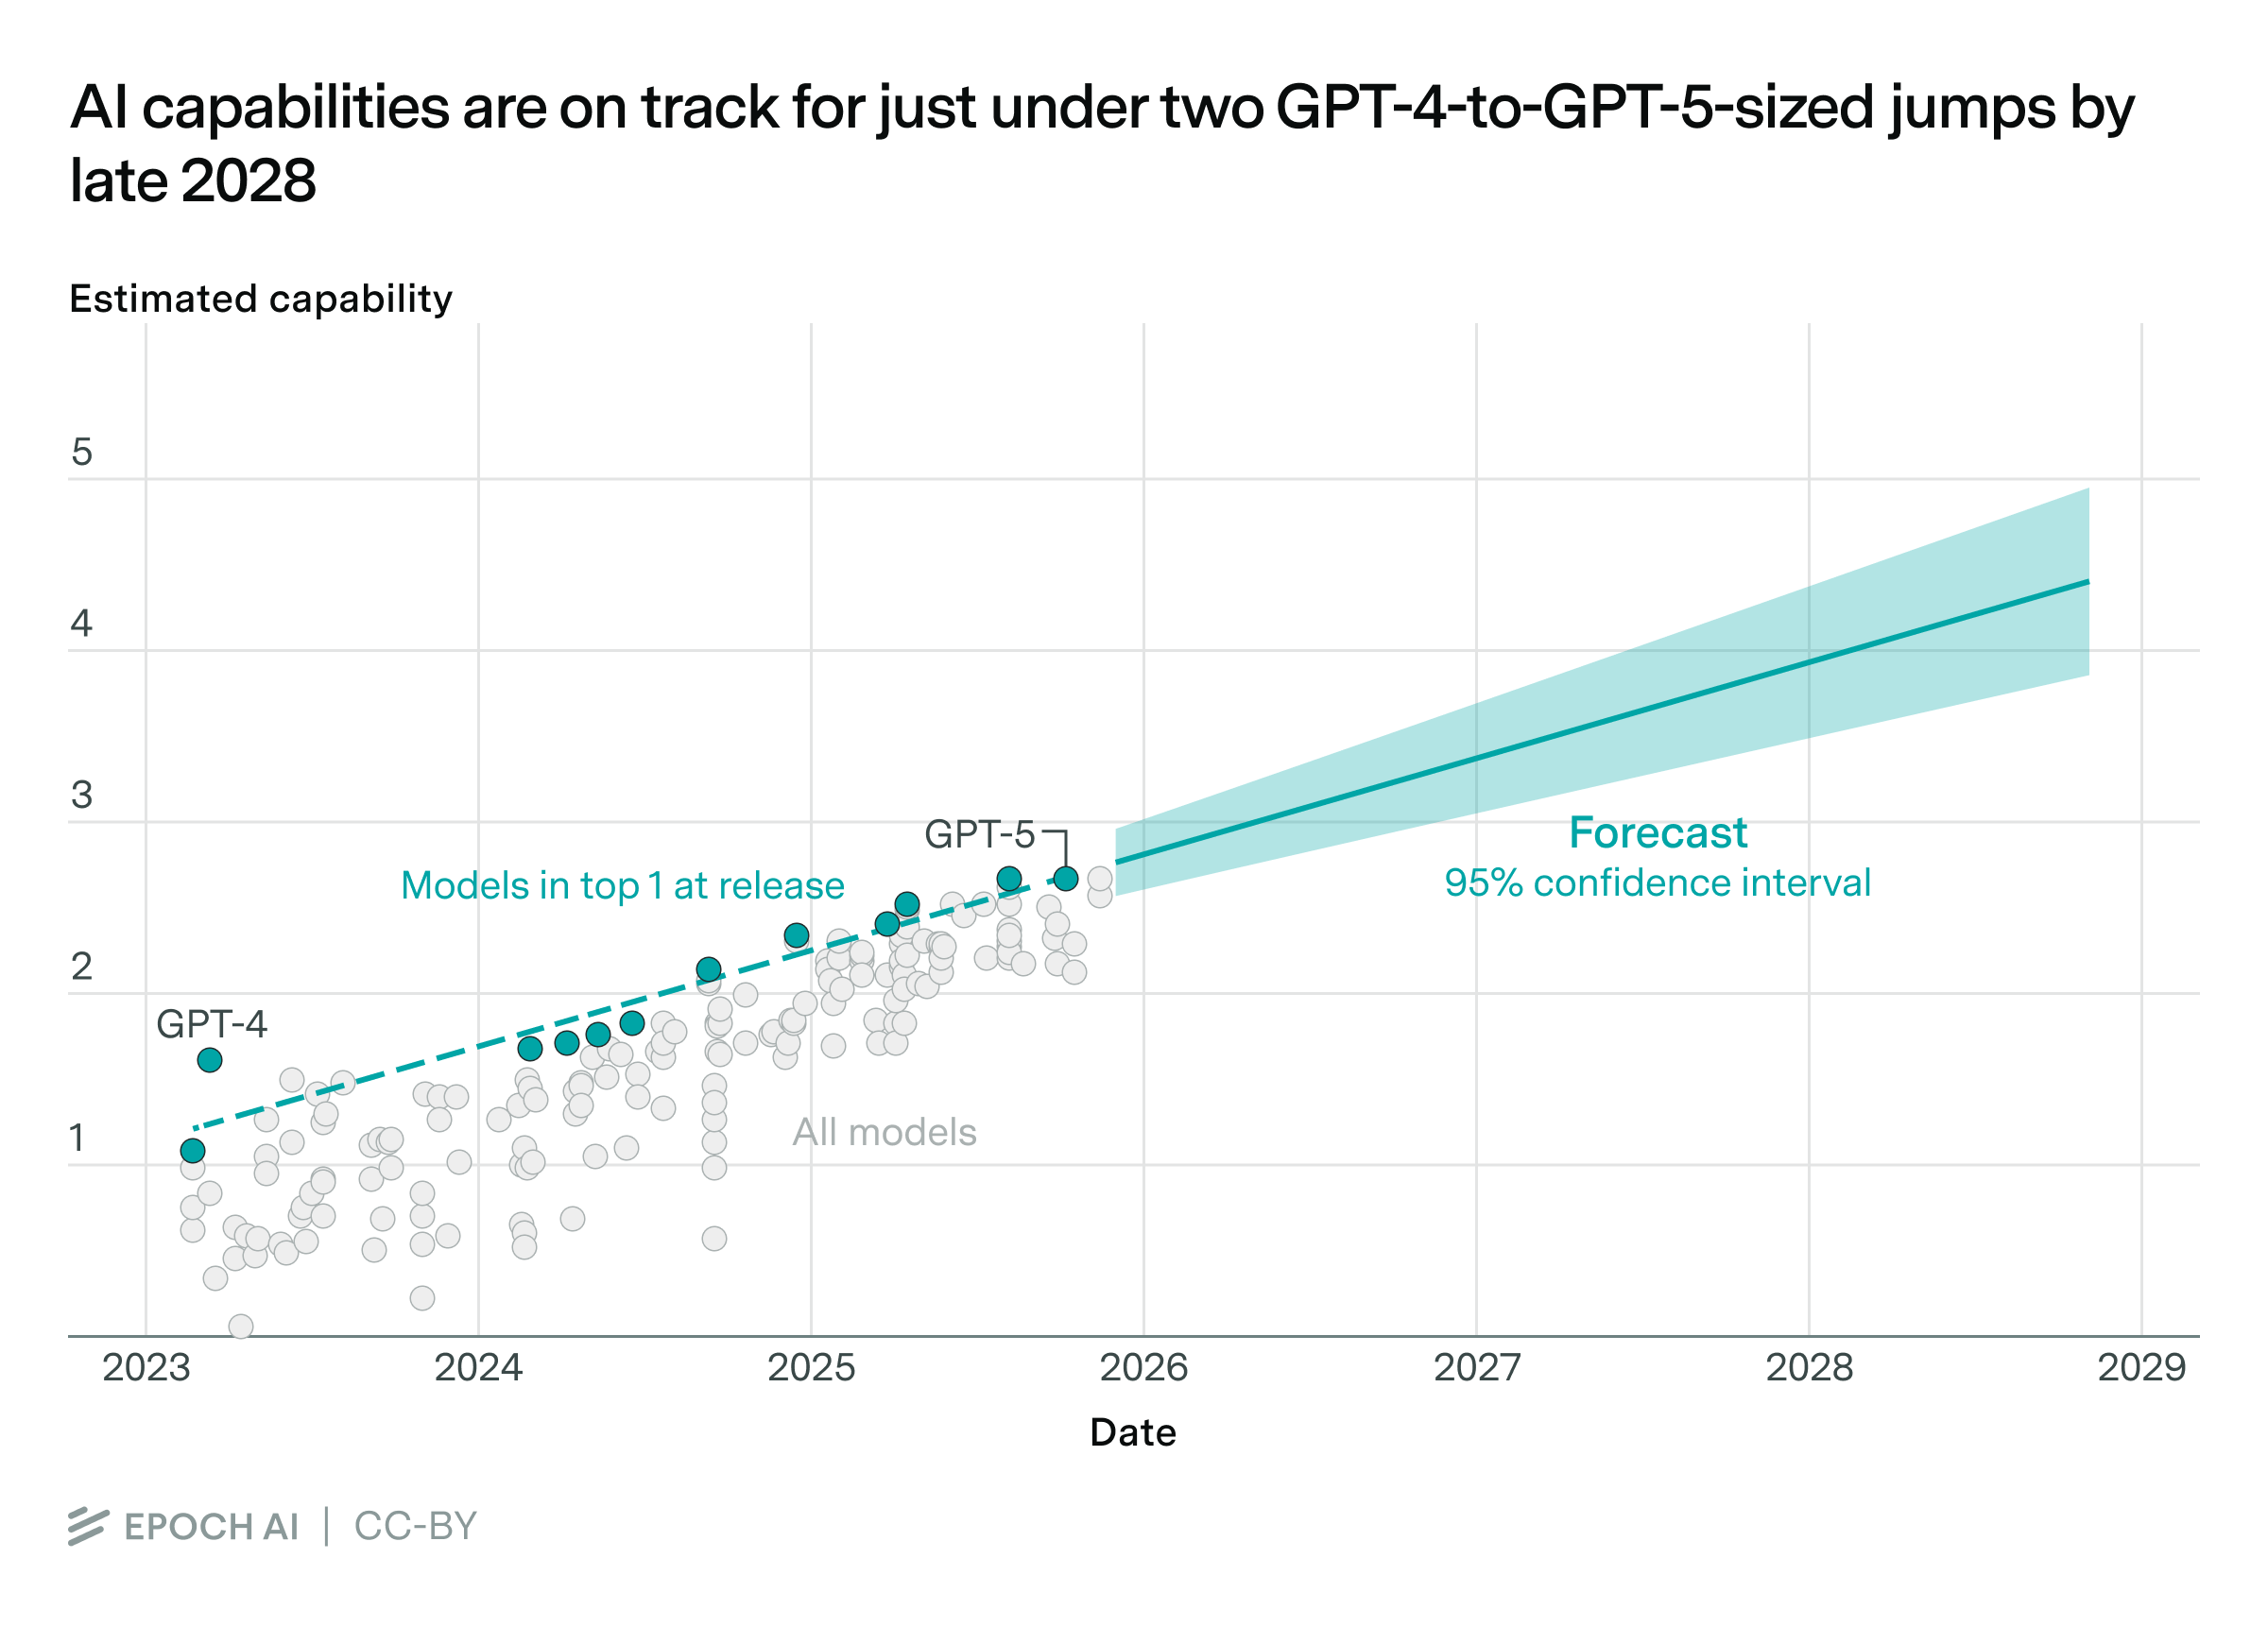
Our framework also lets us see how model capabilities have changed over time. On average, across models that push the state of the art in capabilities, the annual improvement is about 0.6 units per year. That’s as big of capabilities improvement that took place from GPT-4.5 to GPT-5.
We can then project the overall trend forward to get a naive forecast of future capabilities.
And we can use this trend to study software improvements. With better software, we can train models with less compute while still reaching the same capability, increasing “software efficiency”.

To quantify this effect, we combine this capability trend with data on how much compute was used to train different models. Then we can do a statistical analysis on frontier models to say how much capability improvements came from using more training compute, and how much came from better software. The result: each year, we need around six times less training compute to reach the same capability!
This is incredibly fast — but some argue that progress could be much faster still. The idea is that if AIs could fully automate AI research, they would recursively improve themselves. Our framework gives a way to detect this — look for an acceleration in the capability scores over time. In synthetic data simulations, we’re able to reliably detect a two-fold speedup within two to three months:
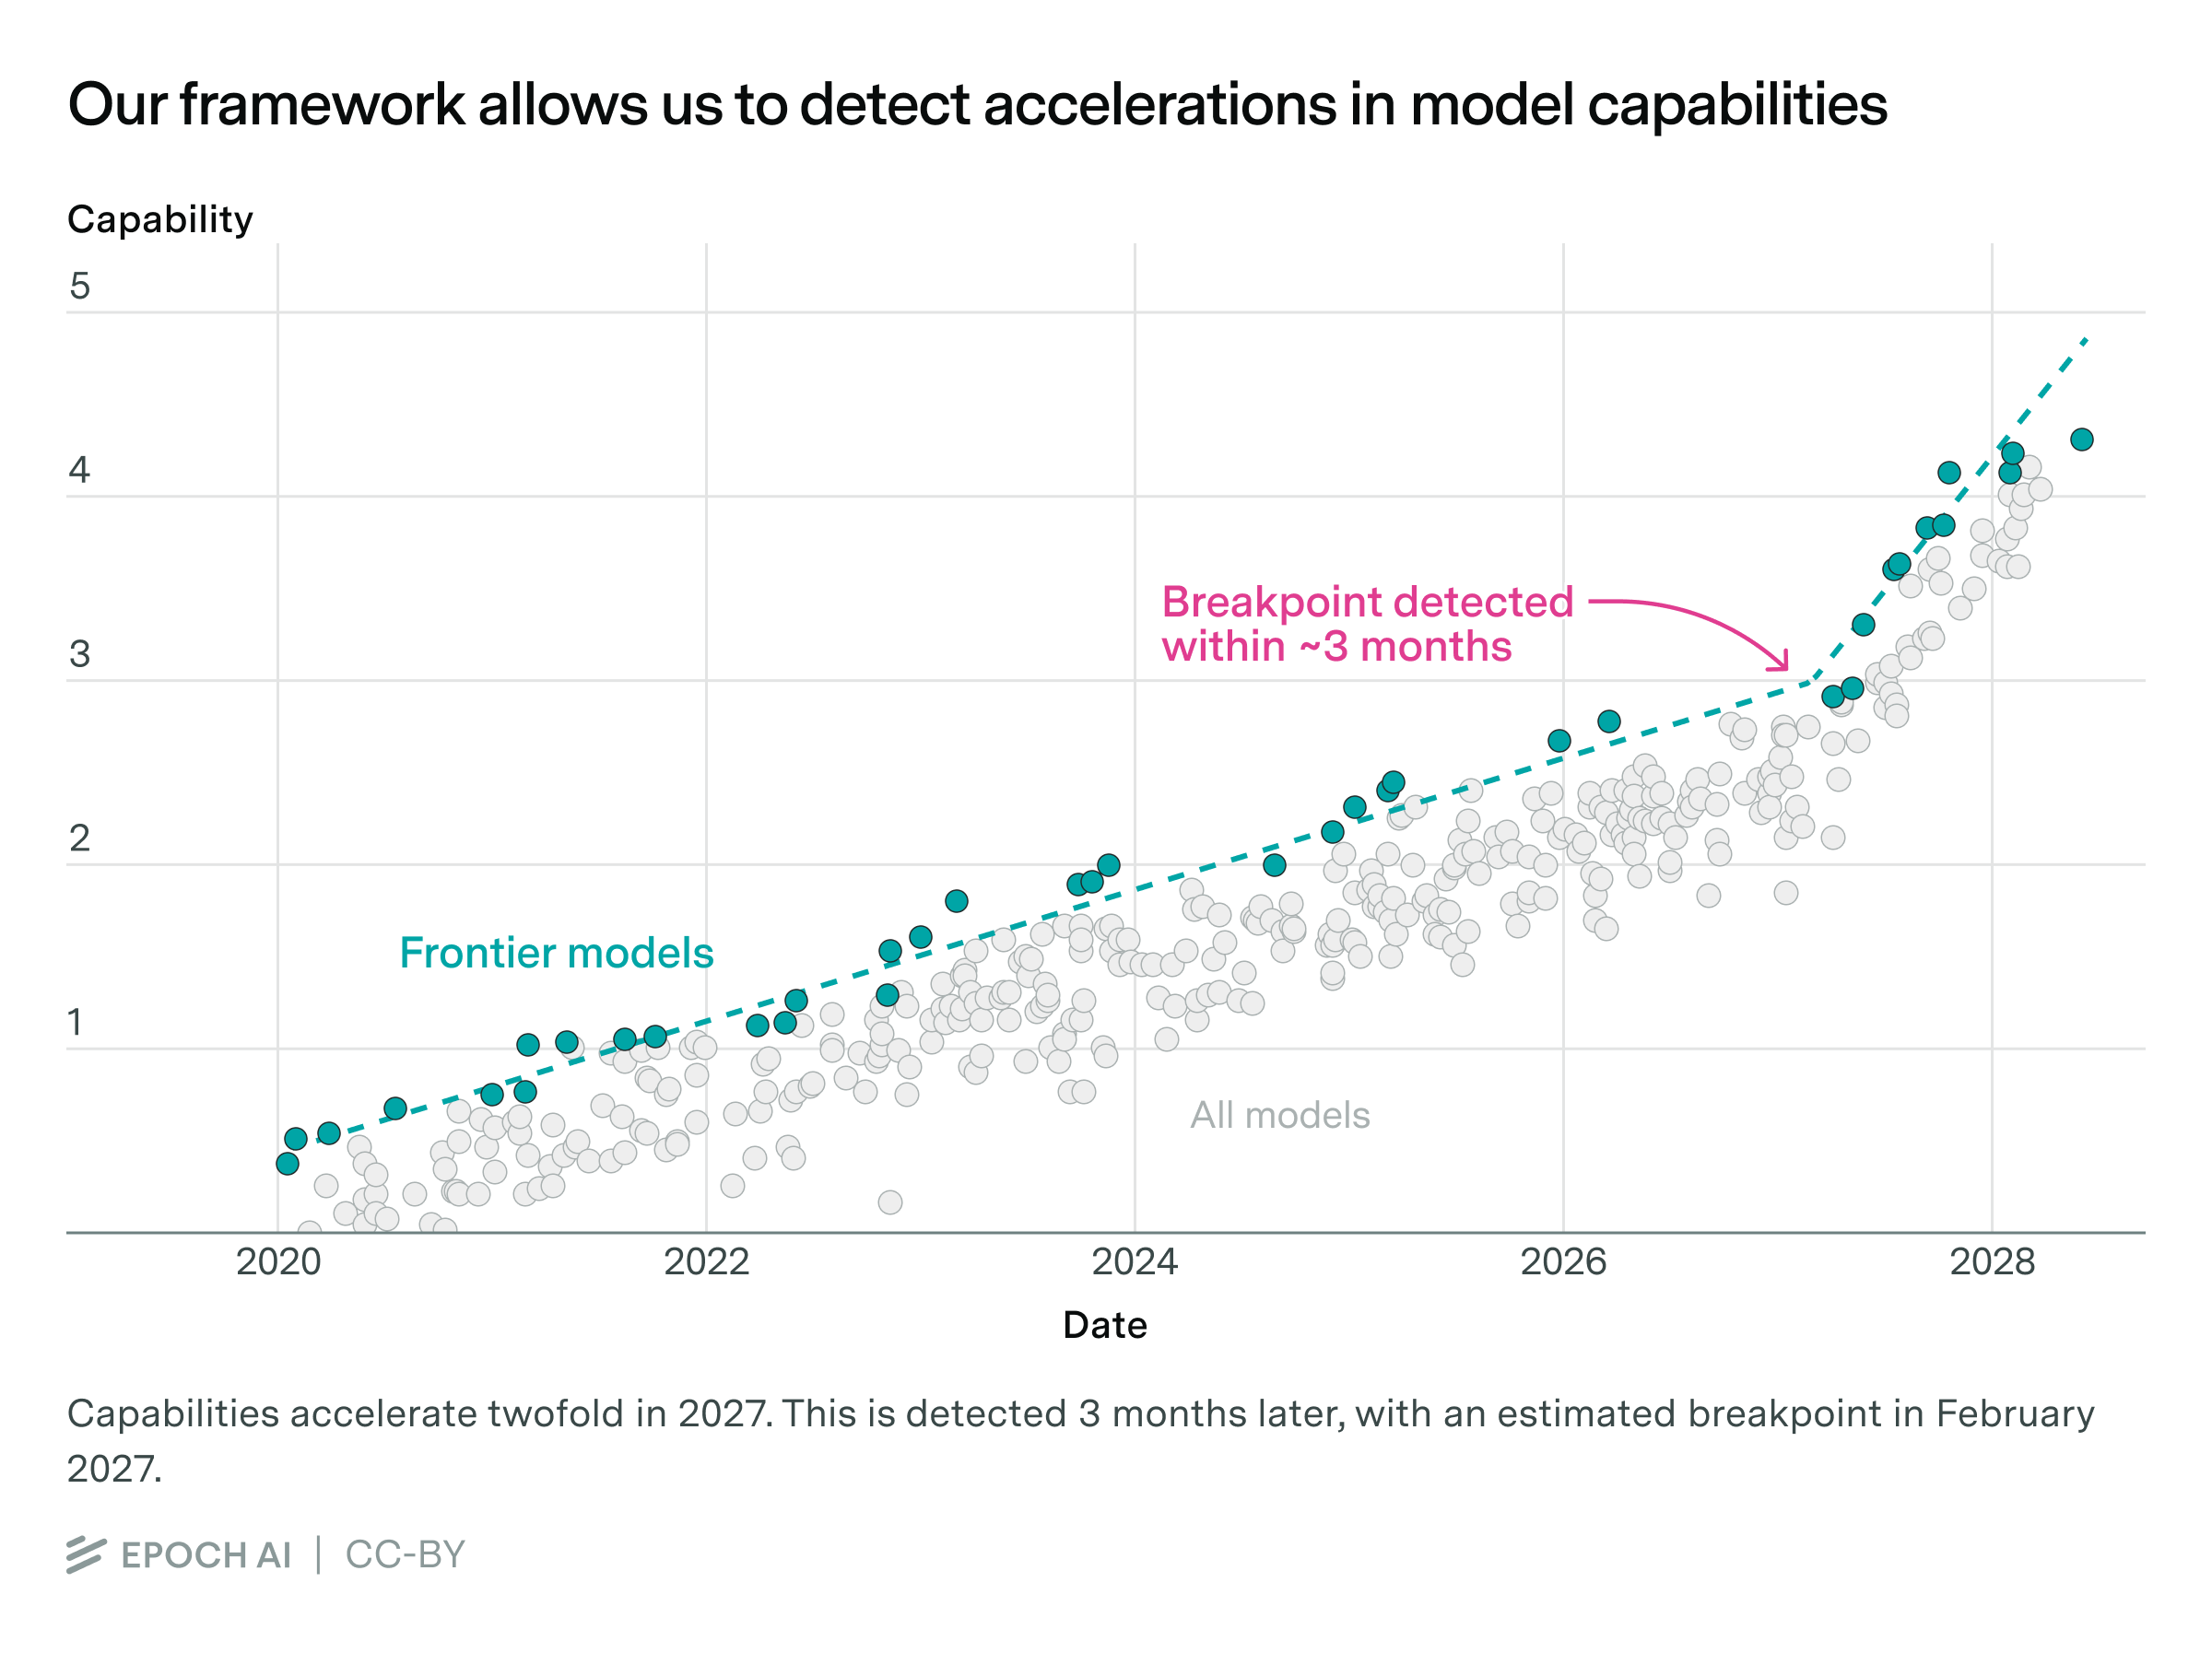
With enough benchmarking data going forward, this could give us an early warning signal of rapid capabilities accelerations, giving the world more time to respond.
Next steps
Our approach has several limitations. After all, our framework relies on benchmarks, so we inherit most of their limitations. Models can be optimized to do really well on specific benchmarks, without doing better across the board. Benchmarks rarely aim to capture the complexities of the real world. And model capability estimates can vary depending on how models are evaluated.
But these limitations also suggest avenues for further work. For example, we could:
- Gather data across more benchmarks to observe longer-term trends in model capabilities and benchmark difficulties, favoring benchmarks more focused on the complexities of real world tasks.
- Develop evaluation infrastructure to make sure that model benchmark scores can be compared in an apples-to-apples way.
- Improve how we detect rapid capability accelerations — for example, our paper focuses on a simple scenario with a single breakpoint marking the start of the acceleration. But real accelerations might be more continuous, and need methods that focus on that more directly.
At the end of the day, our work is just an early attempt in stitching AI benchmarks together. It’s helped us extract new insights from existing data, and suggests many directions to explore. And there’s still a lot of low-hanging fruit — so we’re excited about people exploring our ongoing public implementation of this approach, the Epoch Capabilities Index. We’d also love to see more work building on our framework or considering other ways to extract information from benchmark scores, improving our understanding of AI progress.
This work was funded by and done in collaboration with researchers from Google DeepMind. We’d like to thank Jay Tate and Robert Sandler for helpful feedback on this post.
-
For example, some benchmarks contain multiple-choice questions with four options, making the random baseline 25%.

-
Note that our data includes models up to November 17th, 2025, so it doesn’t include models like Gemini 3 Pro and Claude 4.5 Opus, which were released after this cutoff.
About the authors


Related work