Epoch’s Capabilities Index stitches together benchmarks across a wide range of difficulties
A core problem in assessing trends in AI capabilities is that benchmarks tend to saturate within 1-3 years. The Epoch Capability Index allows comparisons across a wide range of model capabilities, by stitching together benchmarks.
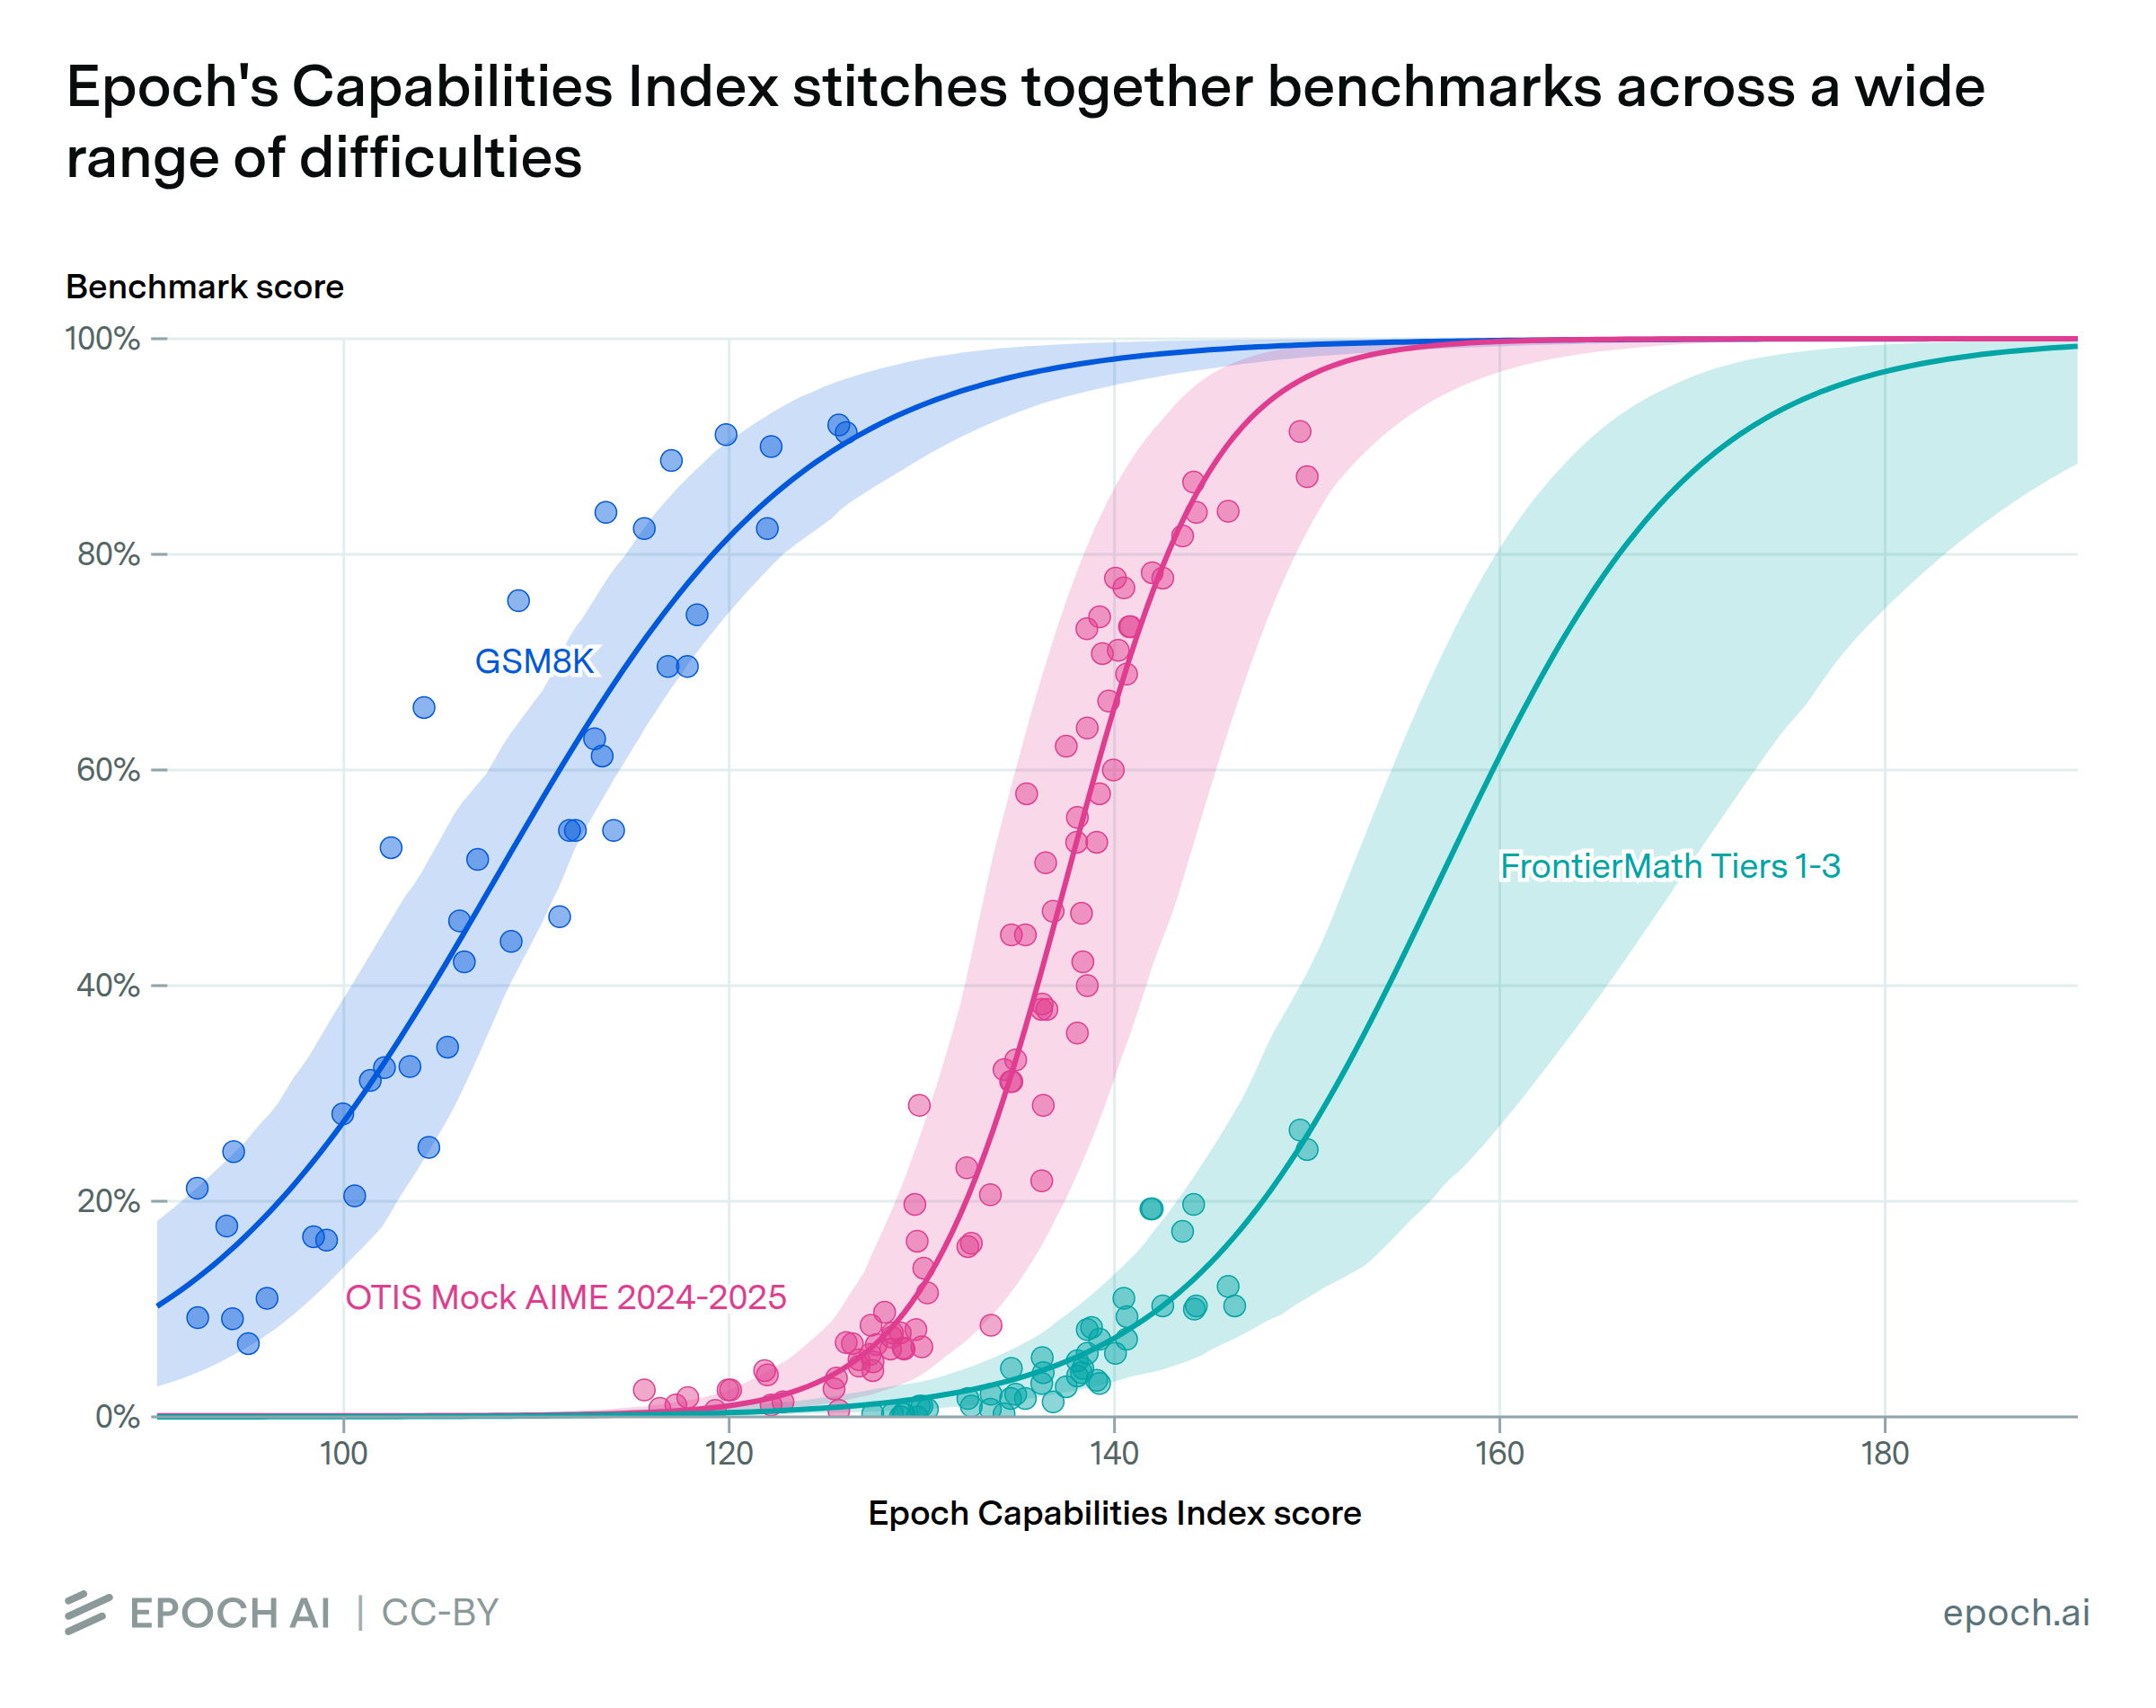
The ECI uses an abstract scale, but scores can be interpreted by calculating the expected performance on individual benchmarks. In the chart above, we show expected benchmark performance across a range of ECI values for GSM8K, OTIS Mock AIME 2024-2025, and FrontierMath Tier 1-3.
Authors
Published
November 6, 2025
Learn more
Overview
One way of interpreting an Epoch Capabilities Index (ECI) score is by calculating the expected performance on individual benchmarks based only on the ECI score. We plot this relationship for GSM8K, OTIS Mock AIME 2024-2025, and FrontierMath Tier 1-3, three benchmarks that vary considerably in difficulty. We also show 90% confidence intervals as a shaded region.
Data
The ECI is calculated using data from Epoch’s Benchmarking Hub. We utilize both internally run evaluations, as well as benchmark creator- and model developer-reported evaluations. Currently, the ECI uses 1123 distinct evaluations, covering 147 models and 39 underlying benchmarks. More details on the methodology used for the ECI can be found here.
Analysis
ECI is based on a statistical model that estimates three types of parameters. Each AI model is given an estimated capability (which we use to produce the ECI), and each benchmark is given location and slope parameters, indicating the model’s overall difficulty and the range of difficulties among its constituent problems, respectively.
These parameters are estimated by fitting the observed data to the following formula:
\(\textrm{performance}(m,b) = \sigma(\alpha_b [C_m - D_b])\)
Where \(C_m\) is capability for model \(m\) (i.e. ECI), \(D_b\) is overall difficulty for benchmark \(b\), and \(\alpha_b\) is the “slope” for benchmark \(b\).
To back out the expected performance on each benchmark across a range of ECI scores, we simply plug in the estimated \(\alpha_b\) and \(D_b\) values for each benchmark, and plot how performance changes as \(C_m\) varies.
We calculate 90% confidence intervals by bootstrap resampling from our observed scores, fitting a new model for each resample, and calculating the 5th and 95th percentile for expected scores across samples.
Limitations
This analysis focuses on the expected score on several benchmarks for a given ECI score. The plotted 90% confidence intervals represent a confidence interval over the expected performance, not a prediction interval for the performance obtainable for a given ECI. In practice, individual models may perform above or below the 90% confidence interval.
More information on the technical details and limitations of ECI can be found on the ECI tab of the AI Benchmarking hub.