LLM providers offer a trade-off between accuracy and speed
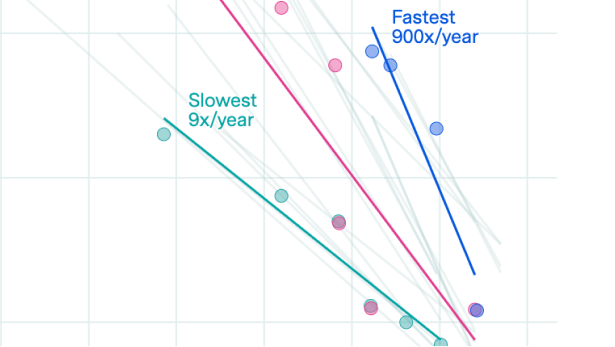
Across major language model providers, the models that achieve higher accuracy on benchmarks also take longer to run. Along the accuracy-runtime trade-off frontier, cutting the error rate in half typically slows the model by roughly 2x to 6x, depending on the task.
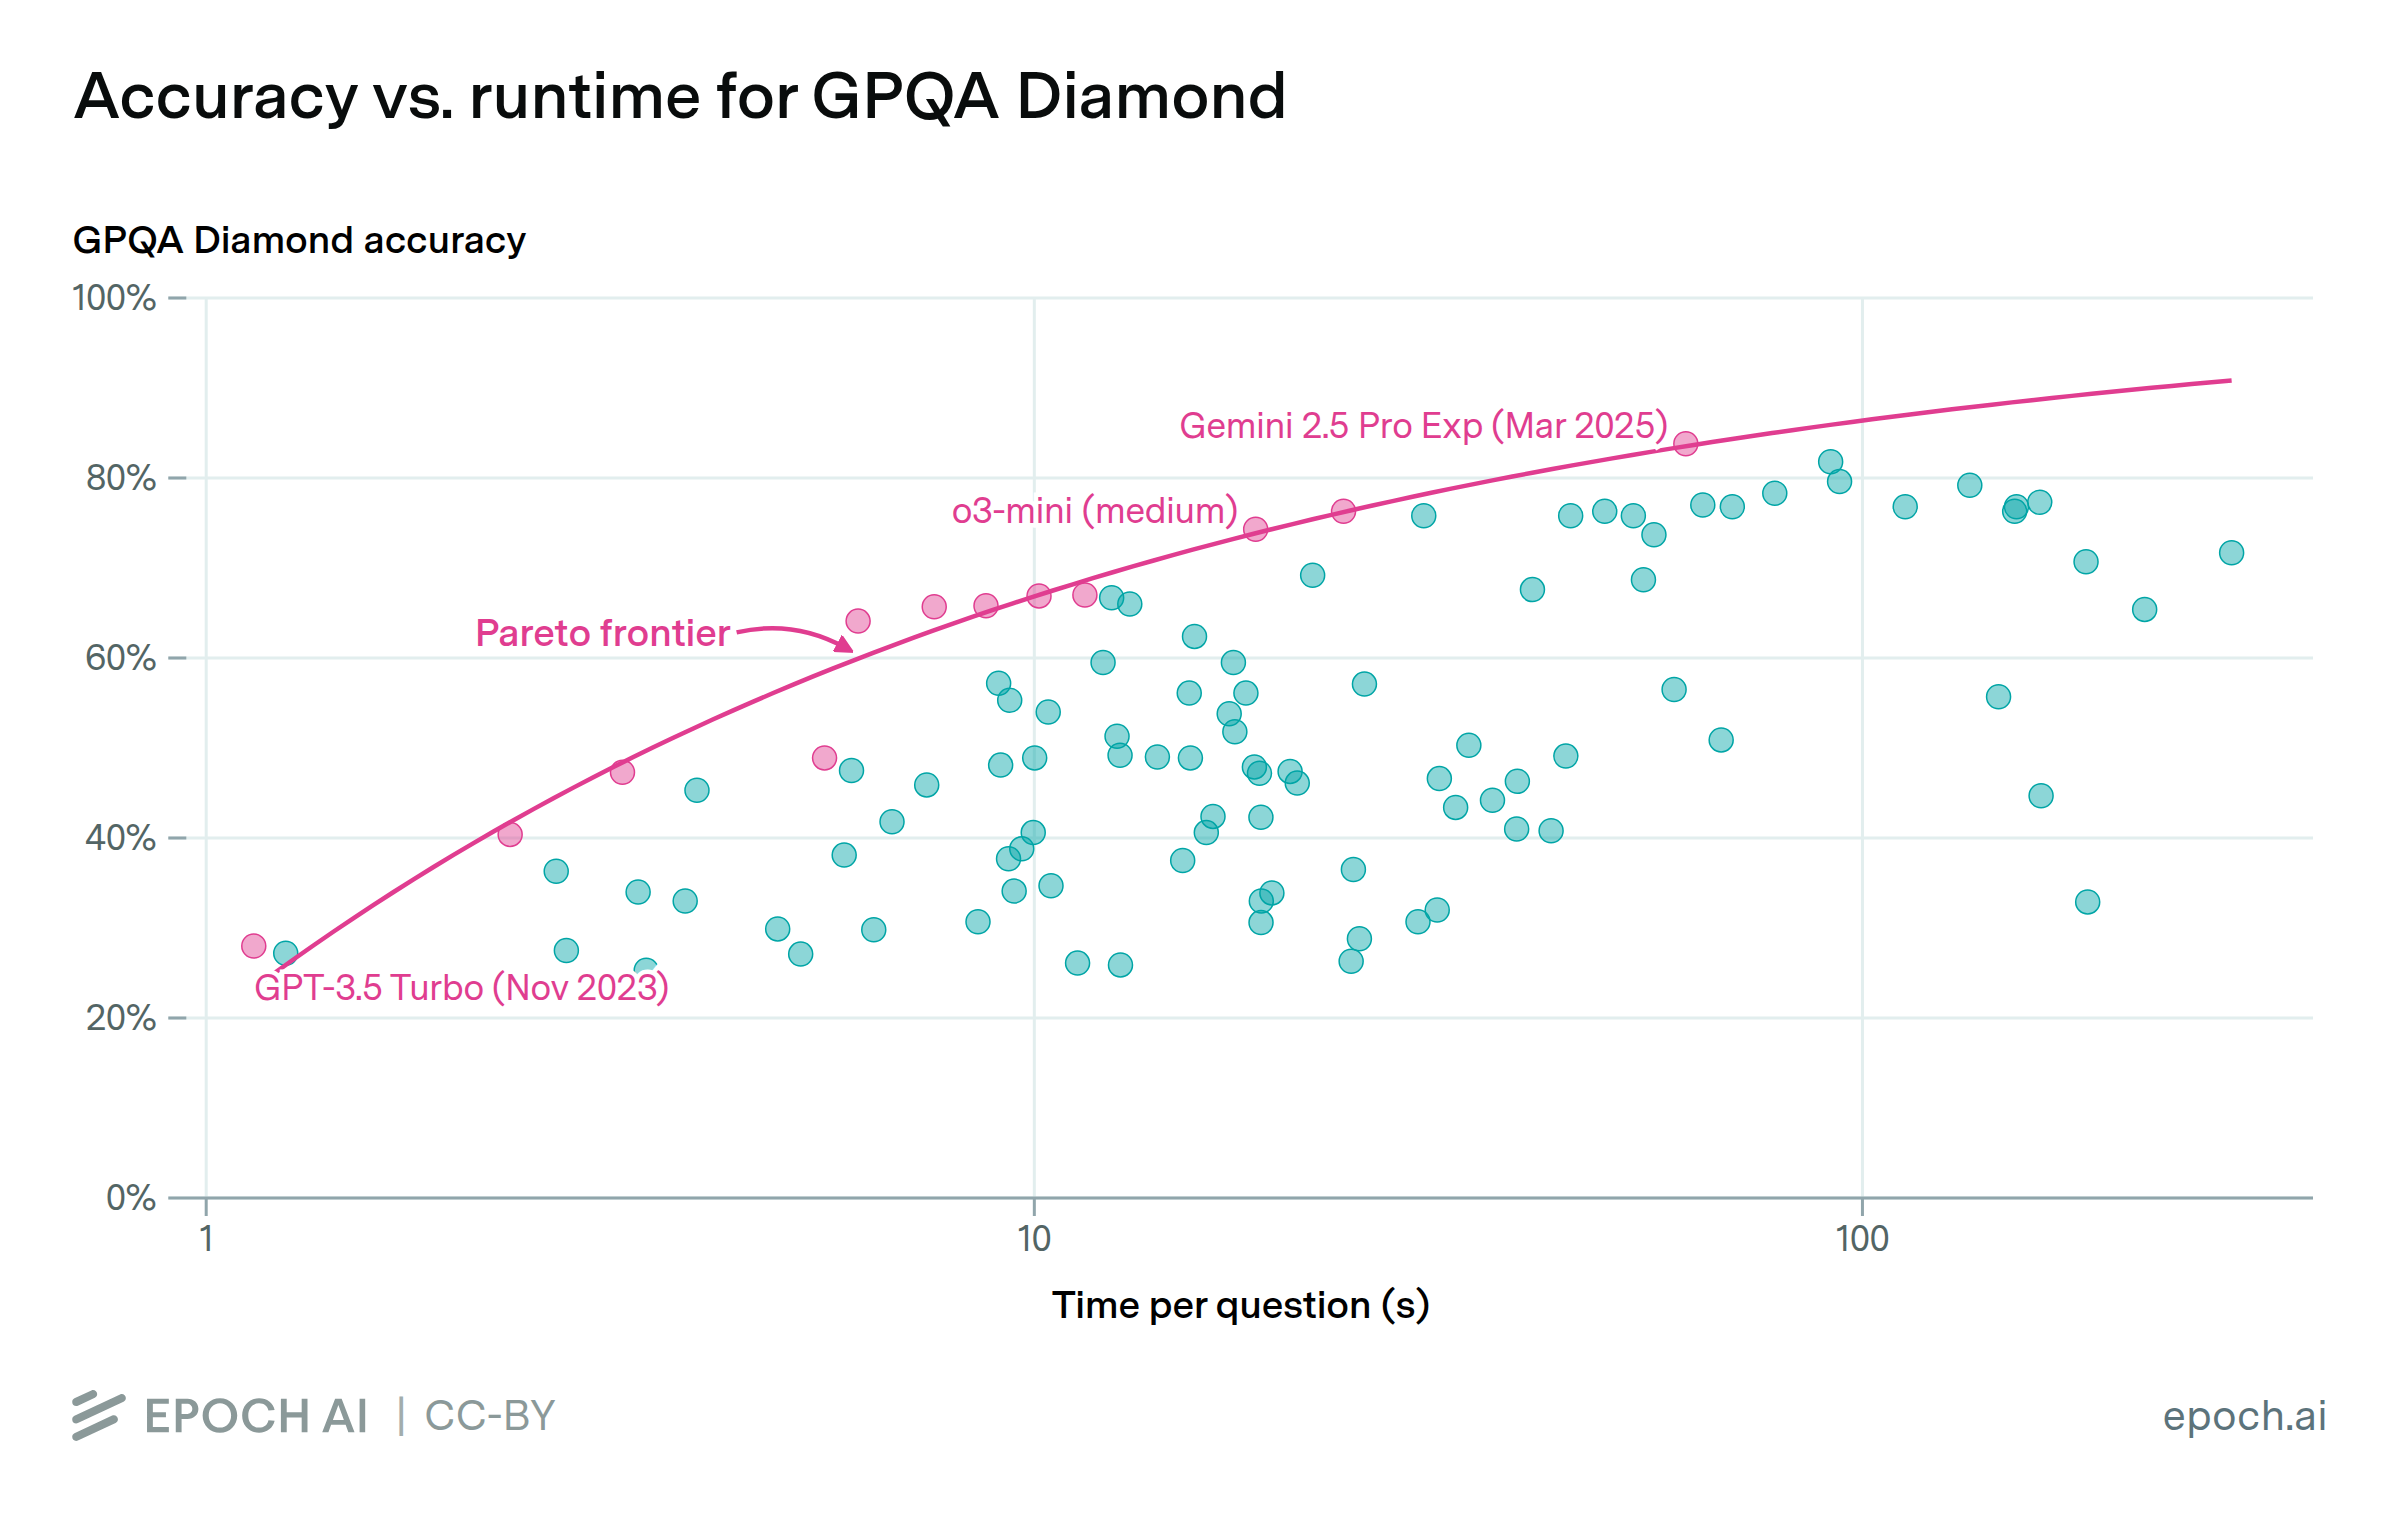
LLM providers have several ways to balance performance against cost, such as model size, query batching, and quantization. Many of the models on the speed-accuracy trade-off frontiers appear to have been designed with efficiency in mind: over half of them are labeled turbo, flash, mini, or nano. The models on this frontier are mostly from two providers: OpenAI and Google.
Learn more
Overview
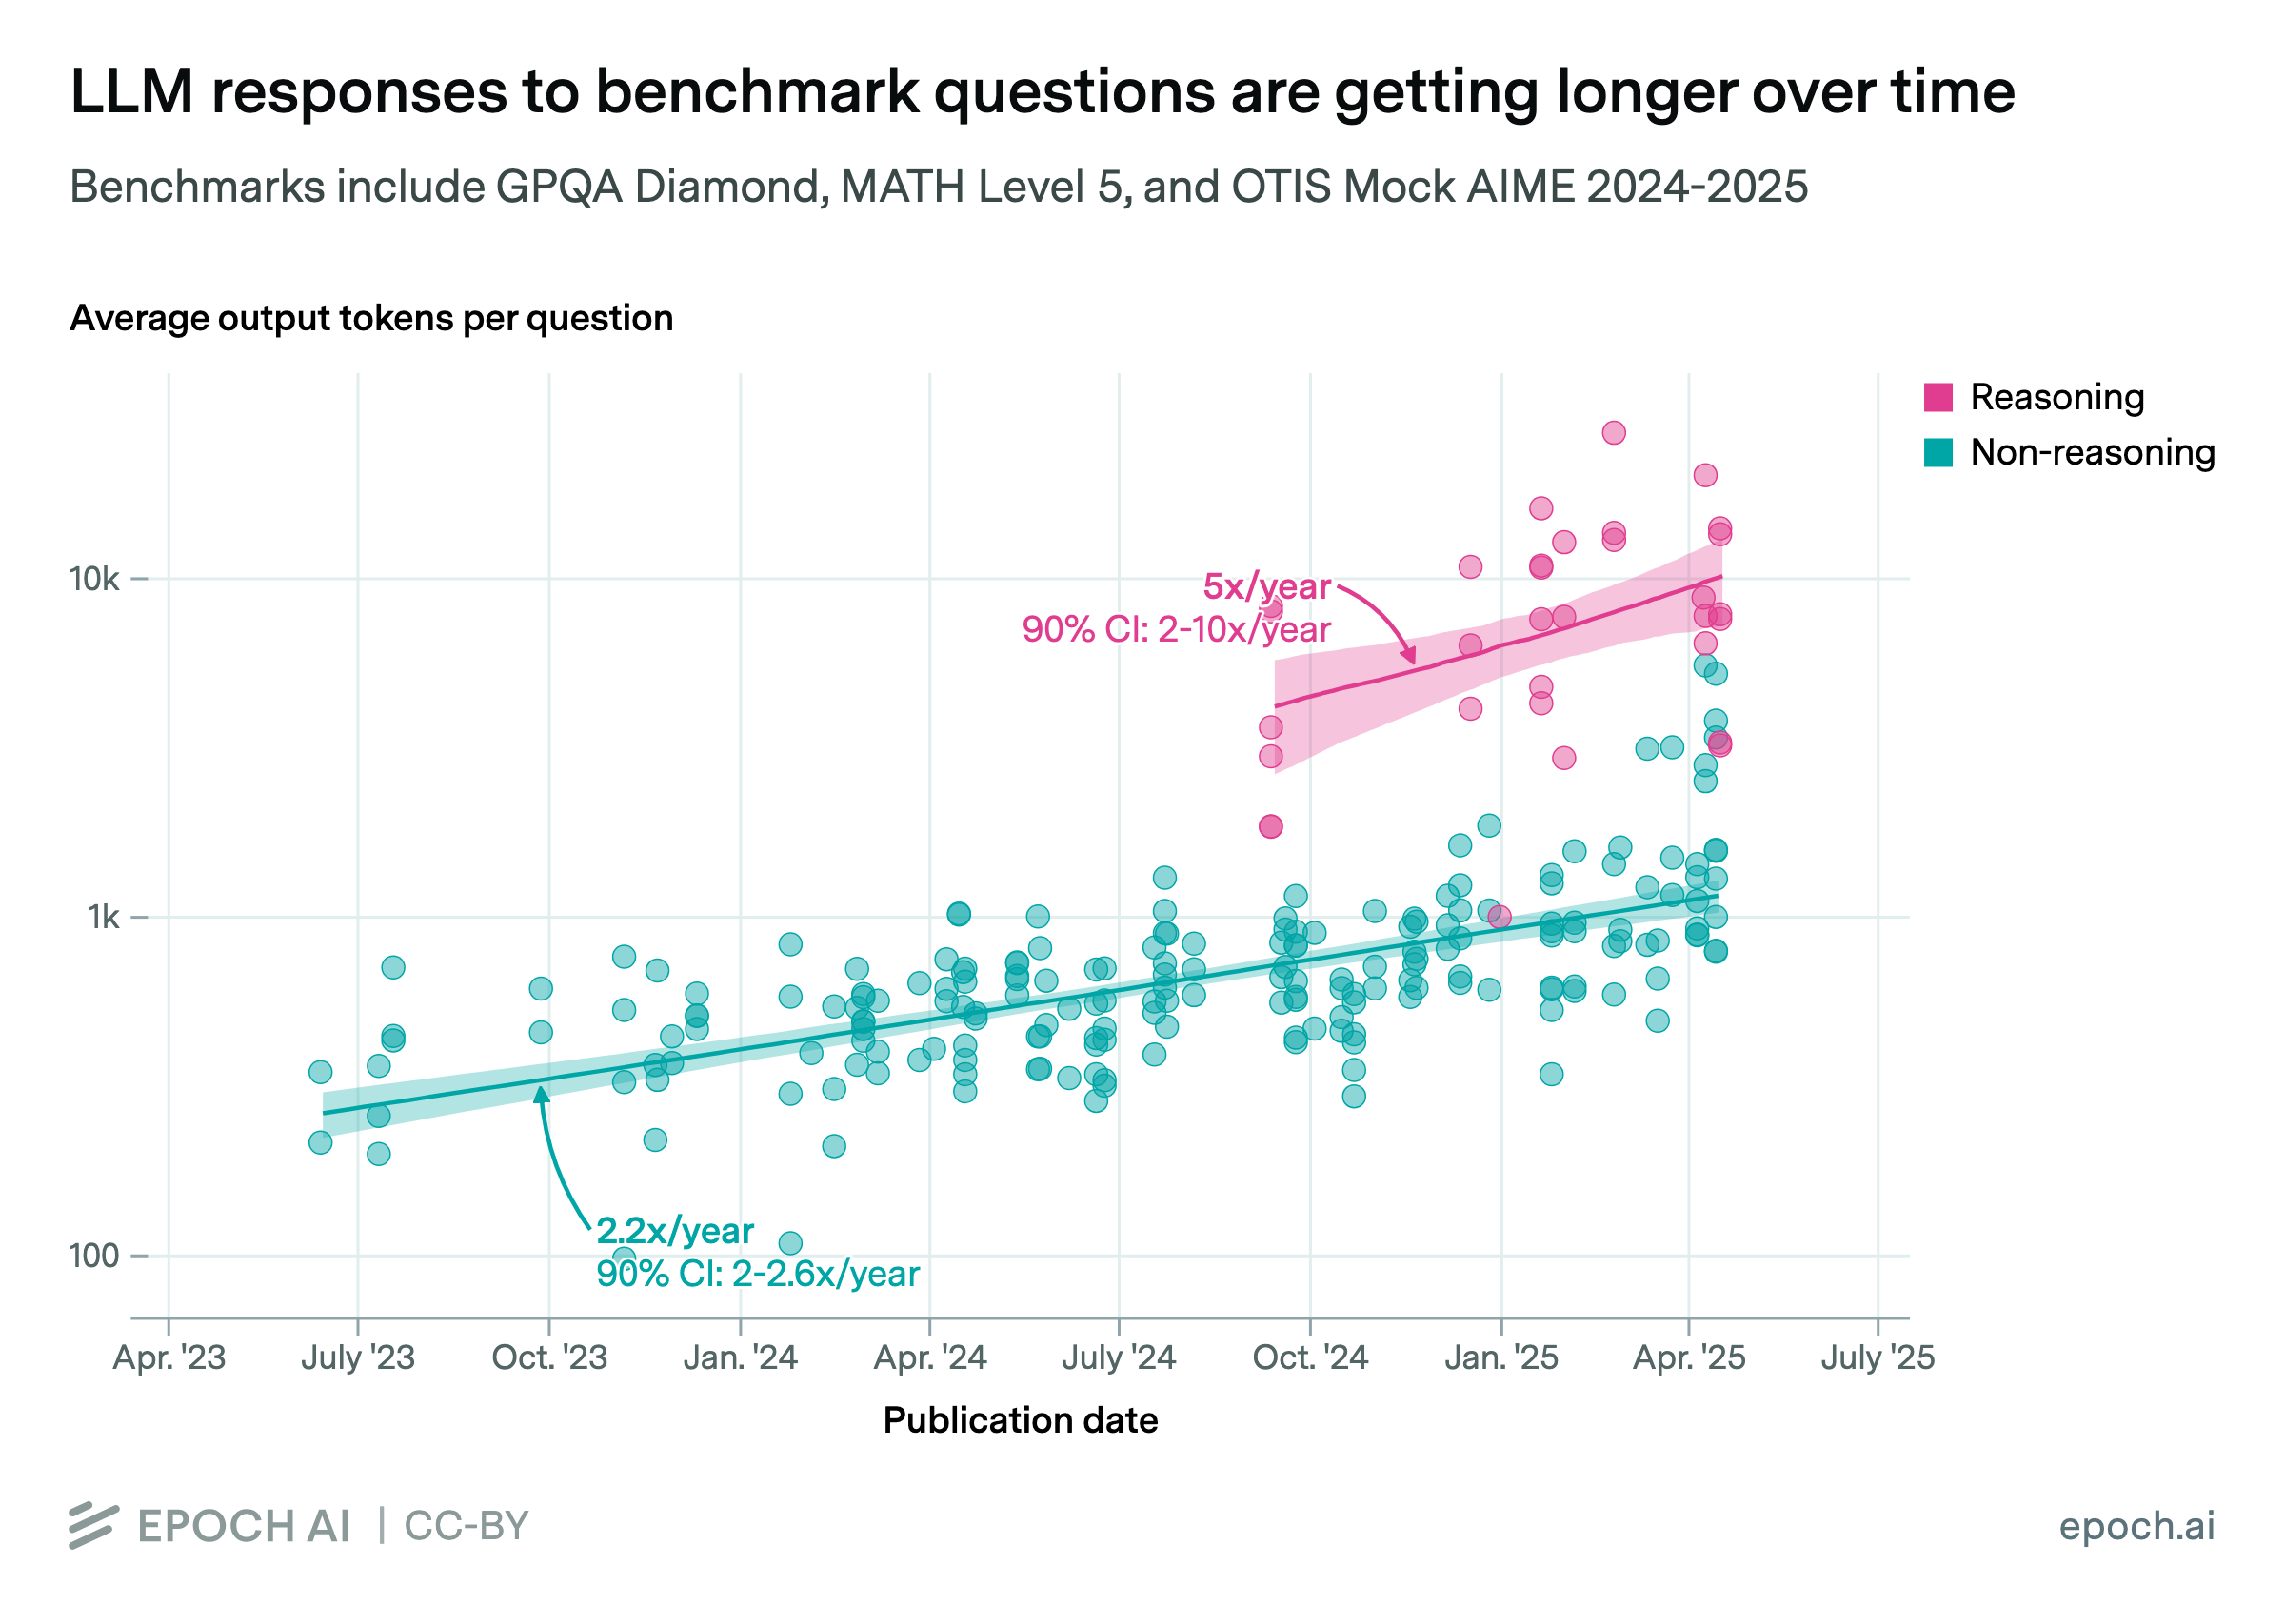
Using Epoch’s internal benchmarking data, we measure the average time taken to answer a question across several benchmarks: GPQA Diamond, MATH Level 5, and OTIS Mock AIME 2024-2025. We plot this against each model’s accuracy on that benchmark. We focus on the Pareto frontier of models, i.e. those that are faster than all more accurate models, or more accurate than all faster models. We model the trade-off as an exponential decay in error rate with respect to the log of runtime. We observe a halving of error rate as being associated with a 6.0x, 1.7x, and 2.8x increase in runtime, respectively.
We also note that, of models appearing on at least one of these frontiers, 12/19 have “flash”, “mini”, or “nano” in their names. These generally correspond to smaller versions of larger models that are specifically optimized for speed and cost, using techniques like distillation.
Code for our analysis is available here.
Data
Data for runtime and accuracy comes from Epoch’s Benchmarking Hub. We focus on the benchmarks with highest coverage across models. These benchmarks all have a simple question-answering format which does not call for any agentic scaffolding or multi-turn interactions. Thus, runtime data reflects a single API call per sample. Models are typically sampled 8 times on GPQA Diamond and OTIS Mock AIME. Models are typically sampled 4 times on MATH Level 5, due to the larger size of this benchmark. In a few cases, due to cost or API instability, models are sampled only 1 time per question.
For GPQA Diamond, we filtered out models with accuracy lower than 25%, corresponding to random guessing. For the other benchmarks, we filtered out models with accuracy lower than 10%, representing a negligible degree of utility on the task.
Some reasoning models are offered with varying levels of “effort”. The same model run with a different effort level was considered a distinct evaluation for this analysis.
All together, this resulted in a dataset of the following size.
Benchmark | Model Evaluation Runs |
---|---|
GPQA Diamond | 104 |
MATH Level 5 | 90 |
OTIS Mock AIME | 43 |
Analysis
We observe that choosing a model with 2x longer runtime cuts its error by about the same factor, regardless of initial runtime. To formalize this, we perform linear regressions for each benchmark, with the log of average question runtime as the independent variable and the negative of the log of the error rate as the dependent variable. We refer to this as the exponential decay fit. This model produces a good fit, although the sample size is small: see the first three columns in the table below.
We use bootstrap sampling (n=500) to assess sensitivity, fitting the exponential decay model to the frontier of each sample. The last column in the table below gives the median runtime multiplier needed to cut the error rate in half, together with its 90% bootstrap confidence interval (5th - 95th percentile).
Benchmark | Observations at Frontier | R² | Runtime Increase (90% CI) |
---|---|---|---|
GPQA Diamond | 12 | 0.97 | 6.0x (5.3-11.3) |
MATH Level 5 | 8 | 0.92 | 1.7x (1.5-2.4) |
OTIS Mock AIME | 11 | 0.95 | 2.8x (2.4-3.3) |
We also evaluate using accuracy as the dependent variable, which we refer to as the log-linear fit. For MATH Level 5, the exponential decay fit yields significantly lower errors (paired t-test, p=0.04). This matches our expectations, given MATH Level 5’s increasing saturation: error rates compress as performance approaches 100%. For GPQA Diamond and OTIS Mock AIME 2024-2025 the two fits are not significantly different. The exponential decay fit is slightly better for GPQA Diamond whereas the log-linear fit is slightly better for OTIS Mock AIME 2024-2025.
Most of the current frontier models are provided by OpenAI and Google (15/19). To test for robustness, we filter out models from these providers and recompute the fit. The general pattern of an upward-sloping frontier remains, though, as the table below shows, R2’s are somewhat lower and the runtime increase factors are somewhat larger.
Benchmark | Observations at Frontier | R² | Runtime Increase |
---|---|---|---|
GPQA Diamond | 10 | 0.88 | 8.9x |
MATH Level 5 | 10 | 0.89 | 2.5x |
OTIS Mock AIME | 5 | 0.97 | 3.0x |
Assumptions and limitations
This analysis uses data from model evaluations when they were run in the normal course of maintaining Epoch’s Benchmarking Hub. These runs have taken place on different dates over time: all took place in 2025, but not all on the same date. The date of each run can be found on the Benchmarking hub, in the started_at column.
Thus, the data is subject to an unknown amount of through-time variance, as providers may change the speed at which they serve a given model over time. We can get some sense of this from Artificial Analysis, which observes throughput speeds (tokens/second) 8 times daily and reports on the distribution of these observations over a three-month trailing window. For most models on the accuracy-speed frontier, the range from the 25th to 75th percentiles of these observations is between 10 and 50 tokens/second. There are two outliers: for o3-high, this range is 100 tokens/second, and for Llama 4 Maverick it is 150 tokens/second. Our analysis assumes that this through-time variance is not significant enough to invalidate the overall findings.