AI capabilities progress has sped up
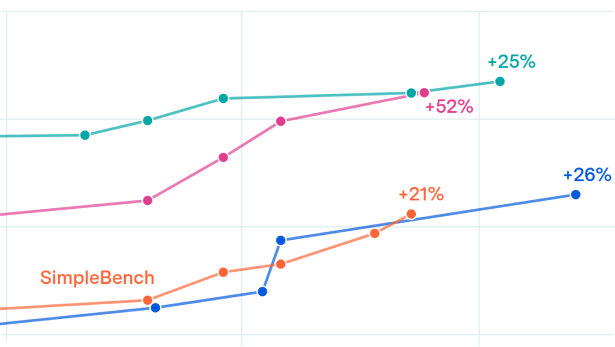
The best score on the Epoch Capabilities Index grew almost twice as fast over the last two years as it did over the two years before that, with a 90% acceleration in April 2024. This is consistent with a similar 2024 acceleration seen in the METR Time Horizon benchmark of 40% in October of 2024. The acceleration roughly coincides with the rise of reasoning models and an increasing focus on reinforcement learning among frontier labs.
In order to provide additional data we include pre-2023 models, which are currently filtered out from the Benchmarking Hub due to the comparative sparsity of benchmark scores during that time. Our conclusions do not change substantially if this data is excluded.
Authors
Published
December 23, 2025
Learn more
Overview
Using the Epoch Capabilities Index, we compare simple models of AI capability trends, finding that the best-fitting model features an acceleration in improvement around April 2024. The rate of frontier improvement nearly doubled, from about 8 points/year before the breakpoint to 15 points/year after. METR’s time horizon analysis shows a similar pattern.
Data
We use data from the Epoch Capabilities Index (ECI), which itself builds off the paper “A Rosetta Stone for AI Benchmarks”. The current implementation of ECI filters out all models released before 2023, and further filters any models with less than four ECI-included benchmark scores. These requirements were relaxed for the purpose of improving this retrospective analysis’ scope, allowing earlier models with sparser data to be included.
Specifically, models before 2023 were permitted to have as few as three ECI-included benchmark scores, though all models estimated to be at the frontier had at least 4 benchmarks. This left only two points in the 2019-2020 range, so the data cutoff was extended by only a year to preserve continuity. The analysis spans 149 models over four years, ranging from December 2021 to December 2025.
We found that re-fitting the ECI with extended data changed the models’ rankings very little despite extra data; the largest jump was Claude 3 Haiku (From 97th to 102nd place) and the third-largest jump was a movement by one place. That is, while some granular score shifts may have happened, we are confident that general trends did not change.
Analysis
Upon obtaining the newly fitted ECI scores, we keep a running maximum in order to determine the model with the highest ECI at each timepoint. This yields 17 frontier points.
Next, we fit a two-segment linear model to frontier ECI vs time, with a single breakpoint and a continuity constraint at the breakpoint. Dates are converted to numeric days for regression purposes, and 5000 breakpoint candidates are chosen between the 10th and 90th percentile of dates (assuming there are no breaks near the edges).
For each candidate breakpoint, we fit a line by OLS to points left of the breakpoint, and another line to points right of the breakpoint. Continuity is enforced by adjusting the right intercept such that the two lines meet at the breakpoint. Candidates are scored by the residual sum of squares, and the best one, with the lowest RSS, is kept.
April 9, 2025 was chosen as the best breakpoint candidate. Our fit has an R2 of 0.9649, with a pre-breakpoint slope of 8.226 ECI/yr, and a post-breakpoint slope of 15.290 ECI/yr. The post-breakpoint slope is 1.86x as large, and can be interpreted as a marked change in the rate of AI progress. We compare this breakpoint model to a simple linear OLS regression in the table below:
| AIC | BIC | |
|---|---|---|
| OLS model (k = 2) | 48.8 | 50.4 |
| Two-segment model (k = 4) | 43.8 | 47.2 |
We find that the AIC and BIC are both lower in the two-segment model, implying an Akaike Evidence Ratio of 12 and a Bayes factor of 5.2. Across 500 resampled frontier datasets (same size, sampled with replacement), the two-segment model beat the single-line fit on AIC 85% of the time and on BIC about 75% of the time. This reinforces our belief that the breakpoint signal is fairly robust.
We also obtain 90% confidence intervals via a nonparametric bootstrap, resampling the dataset with replacement and refitting the piecewise model with new frontier points each time.
| 5th percentile estimate | 95th percentile estimate | |
|---|---|---|
| Pre-breakpoint slope | +5 ECI / year | +10 ECI / year |
| Post-breakpoint slope | +13 ECI / year | +19 ECI / year |
| Slope ratio (speedup factor) | 1.4x | 3.3x |
| Breakpoint | 2023-11-08 | 2024-09-24 |
Assumptions and limitations
ECI is a composite index constructed from many underlying benchmarks. While we are confident that it tracks a single underlying factor of capabilities progress, interpreting that factor is a bit difficult. For more information, see our ECI FAQ section.
Several data points in our extended ECI dataset feature very wide confidence intervals for capability estimates. Caution should be used when interpreting point estimates for data before 2023.
While we compare piecewise linear models against a simple linear OLS fit, we do not compare against a model of smooth exponential growth. We leave this for future analysis.