
In the world of AI, half a year is a very long time. Back in July, we saw LLMs being adopted faster than almost any other technology in history. Five months later we’re still seeing rapid growth, but we’re also seeing early winds of change — both in who uses AI and how they do so.
Using the latest public data,1 and a poll of US adults we conducted with Blue Rose Research, this post shares an updated picture of the state of LLM adoption.
How quickly are consumers adopting LLMs?
More people are using LLMs — but they’re increasingly using different LLMs, different products, and in different places
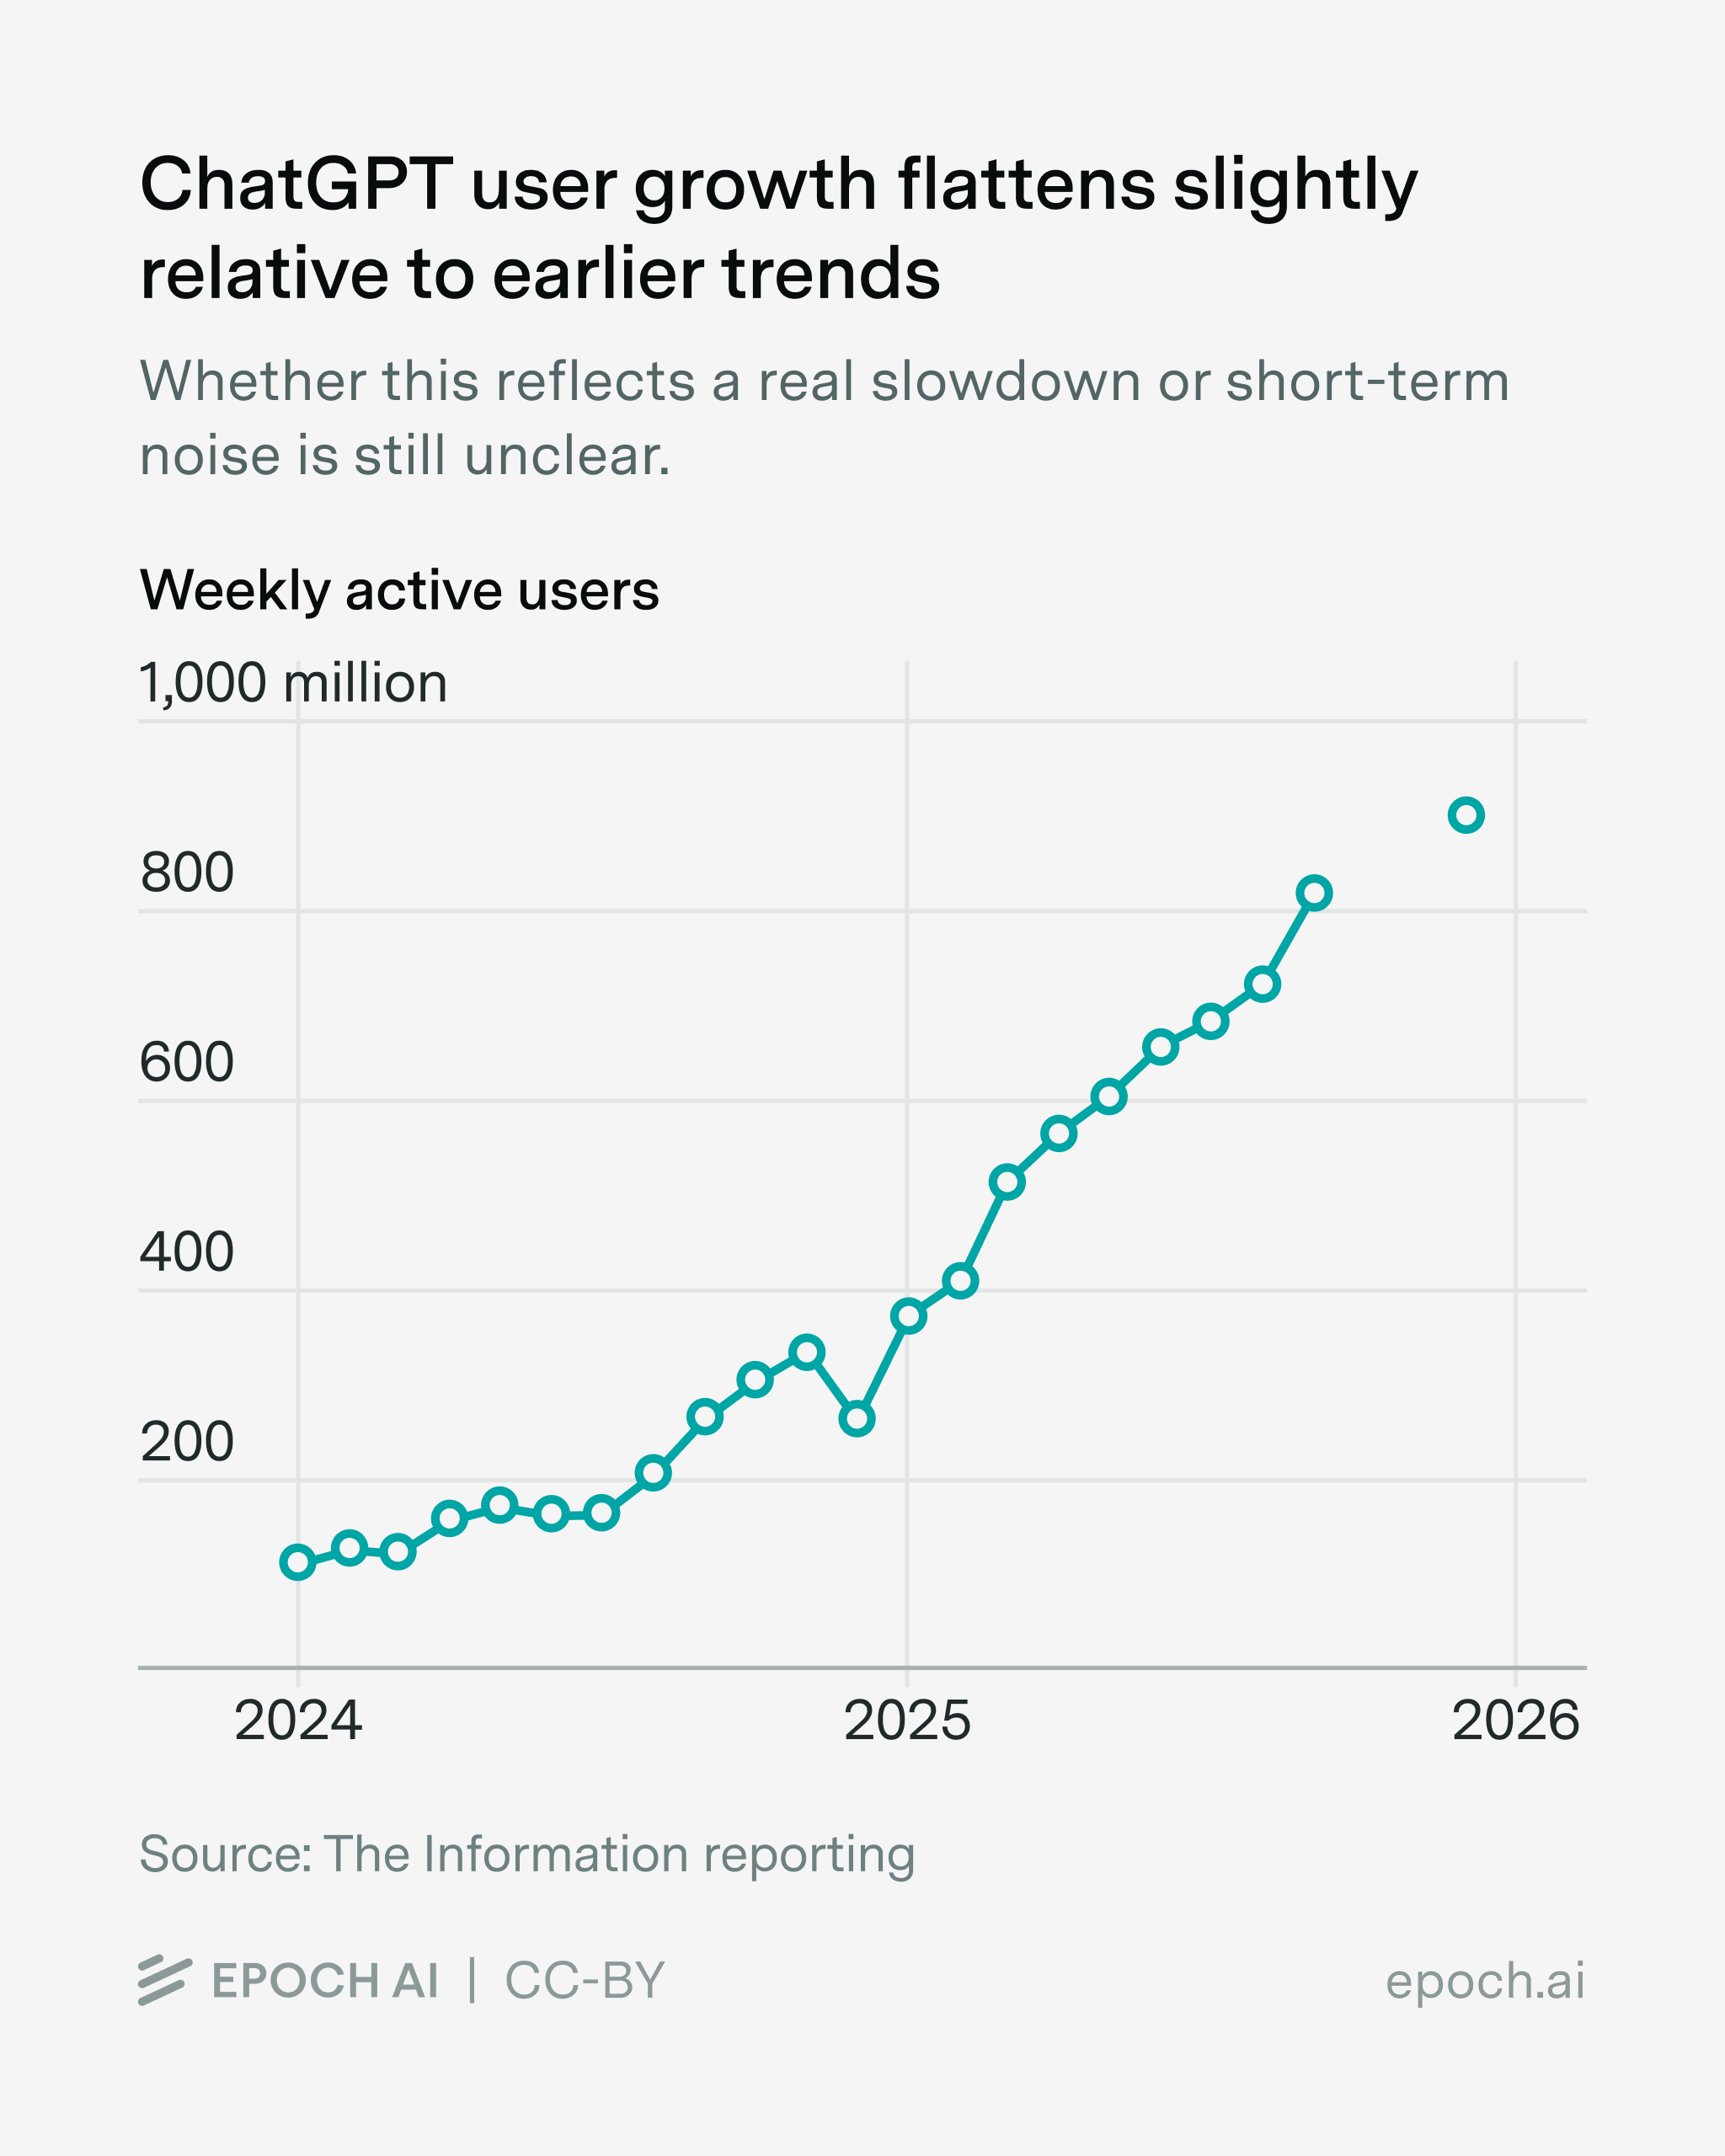
Through the first half of 2025, ChatGPT’s user base grew at a remarkable pace, from under 400 million weekly active users in January to nearly 800 million by August — roughly 50 million new users per month. Since then, growth may have slowed slightly, though it’s a bit soon to tell how much of this is noise versus a lasting trend change:
Does this mean that LLM adoption has slowed down? Not necessarily — even if ChatGPT user growth is slowing, other LLMs have recently seen faster consumer growth. For example, between August and November, Gemini monthly active users increased about 30%, compared to 5% for ChatGPT. And that’s not because Gemini has very few users — both Gemini and ChatGPT have hundreds of millions of monthly active users. That said, ChatGPT still maintains the larger userbase: in our poll, about 35% of registered voters reported having used ChatGPT over the past week, compared to 24% for Gemini.
Increasingly, this consumer growth is coming from countries besides the US. According to OpenAI’s “How People Use ChatGPT” report, 30% of internet users in high-income countries were already using ChatGPT weekly by mid-2025.2 With less room to grow, we should expect slower user growth in the US compared to the global average.3 And there are hints that this is the case — for example, ChatGPT daily users in India grew sevenfold over the past year, and the number of daily Gemini users in India grew by 15% in November alone. As a result, India now has over twice the ChatGPT users of the US.
Finally, user growth could continue or even accelerate through a different route: integrating AI into widely-used products, rather than using standalone chatbot apps. One example is Google Search, which now includes an “AI mode” that’s powered by their state-of-the-art model, Gemini 3, and was made available to the public in December. Another example is Meta, which has been pushing Meta AI across WhatsApp, Messenger, and Instagram — this integration likely explains where Meta AI’s alleged 1 billion monthly active users comes from.4 And if Meta succeeds in making AI a habitual part of messaging, Meta AI could reach an enormous user base — a possibility not lost on OpenAI.
Overall, the prior trend in global user growth seems more or less on track. Growth might be slower in saturated markets like the US, but this is offset by faster growth elsewhere.
Consumers are using LLMs much more intensely on AI apps, while web traffic has stagnated
Even without new LLM users, we could still see an increase in adoption. That’s because each user could still use LLMs more intensely, such as by sending more messages. Indeed, between June 2024 and 2025, the number of ChatGPT messages grew faster than the number of weekly active users.
So what’s happened more recently? The answer depends on what metric you look at, and also on the specific LLM.
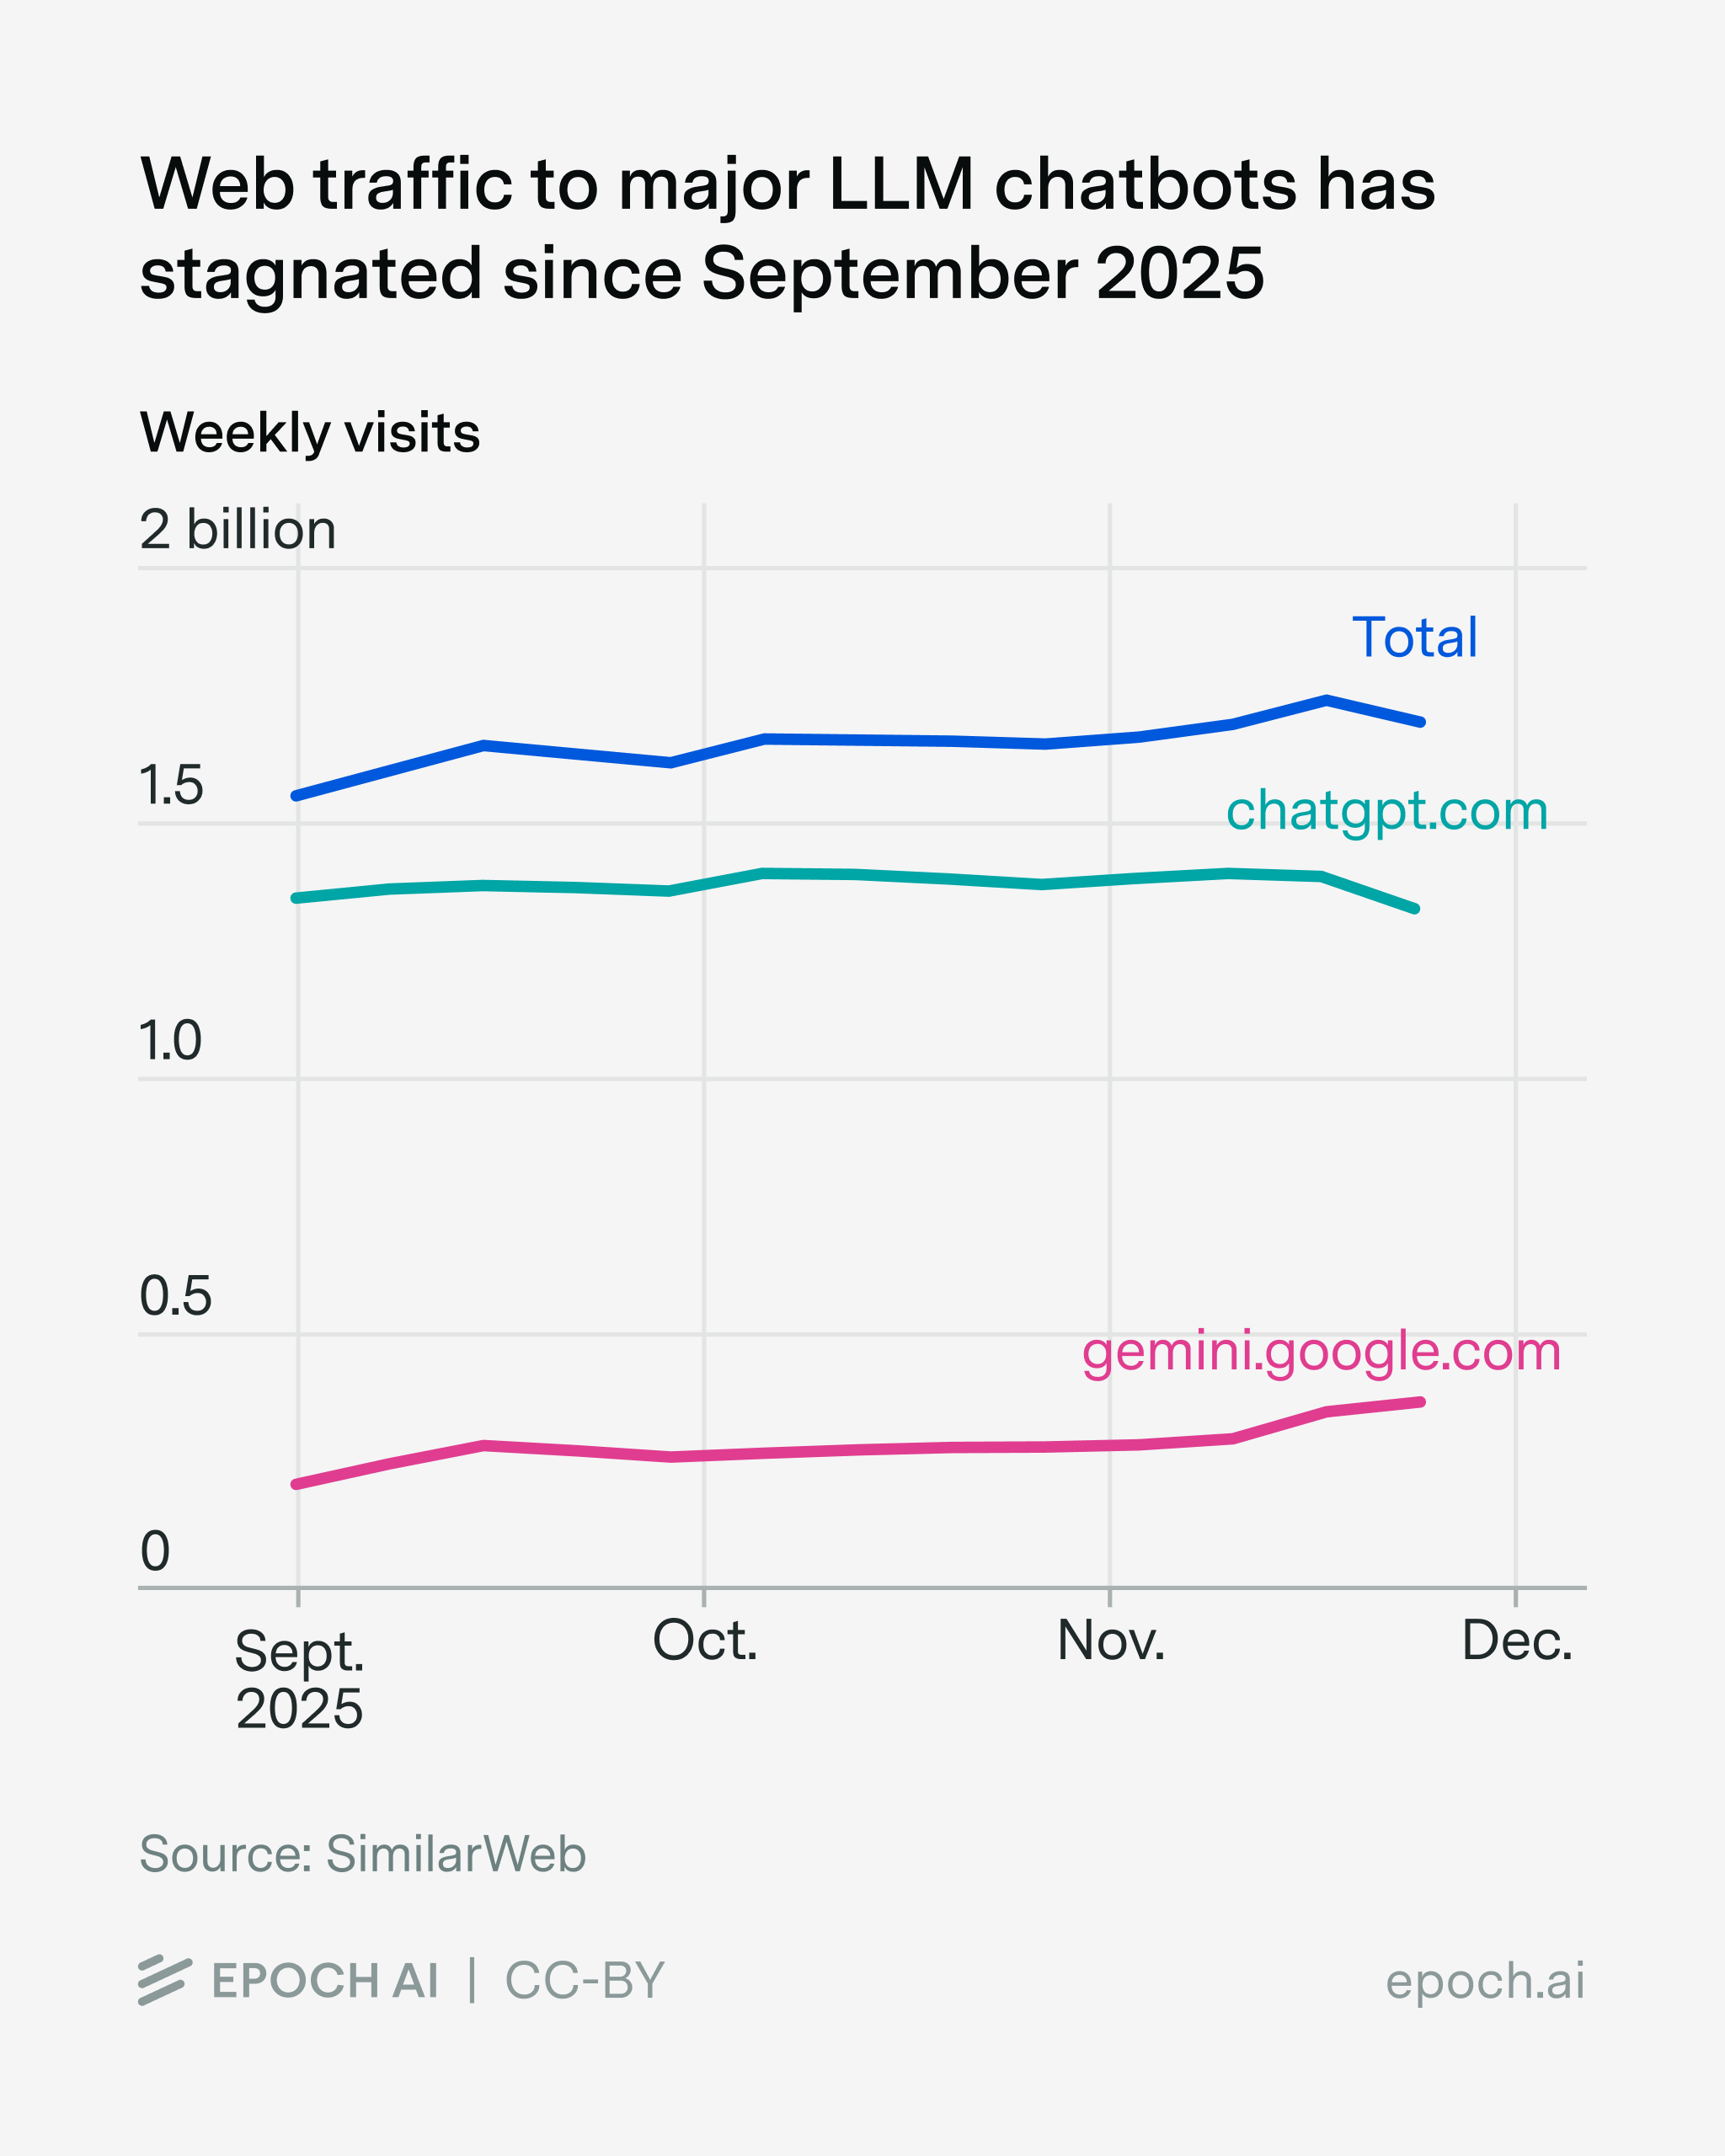
For example, one metric we can check is recent web traffic. According to SimilarWeb, ChatGPT’s web traffic has been essentially flat since September 2025. In contrast, Gemini’s traffic has grown somewhat over that same period, though it started from a smaller base, such that the combined web traffic across the two models has stagnated.
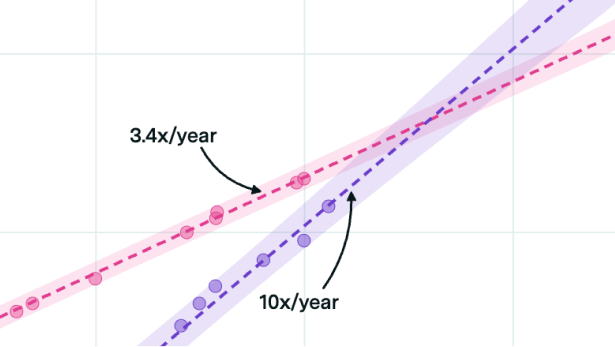
But the story looks quite different over a longer period. Between November 2024 and November 2025, ChatGPT’s web traffic grew by around 1.5×. That’s faster than most websites, but surprisingly slow compared to the roughly 3× growth in weekly active users over a similar period. This discrepancy might be due to a shift from web use to faster-growing chatbot apps — SimilarWeb captures traffic from the former, but not the latter. Notably, the ChatGPT app was downloaded 1.9 billion times between October 2024 and September 2025 — the most downloaded app of the year.
We also see people using models more intensely within these apps. As of November, ChatGPT users spent 17 minutes per day in the app, up about 6% from March. Gemini users averaged about 11 minutes per day, up roughly 120% from March, but again starting from a smaller base.
But while looking at web traffic and time use is helpful, it misses out on a crucial way by which LLMs could be used more intensely — processing more tokens even with the same number of user sessions. For example, reasoning models tend to have longer responses, and some changes in model personality could lead to more messages per session. So ideally, we’d also look at the number of messages sent and the tokens processed per user. Alas, we don’t know how much this impacts users on average, because only a small fraction of users regularly use the “reasoning” functionalities of frontier models (e.g. ChatGPT’s “thinking” mode). Moreover, we don’t know how many of the total tokens processed by ChatGPT are driven by a small fraction of ChatGPT “power users”.
Putting everything together, there’s still only limited evidence on how intensely people use LLMs and how this has changed over time. But if we squint at the data we have, it seems that individuals are likely using LLMs much more intensely than before.
AI company revenues have continued to grow incredibly fast, in line with previous trends
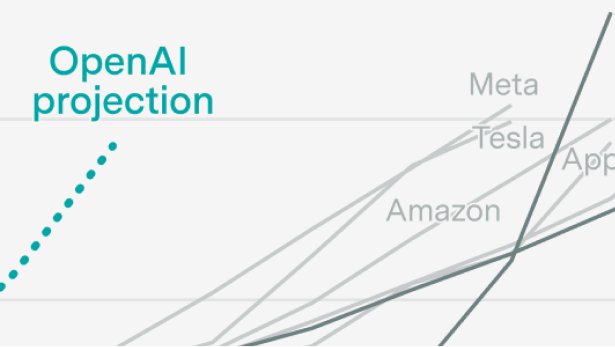
So far we’ve looked at two dimensions of increasing adoption: more users, and more intense use. Combining these two lets us measure total LLM use, which we can capture using revenue. This is a metric which has grown so fast that it puts companies like Google and Uber to shame — so you’d have a really hard time arguing that LLM adoption has been slow.
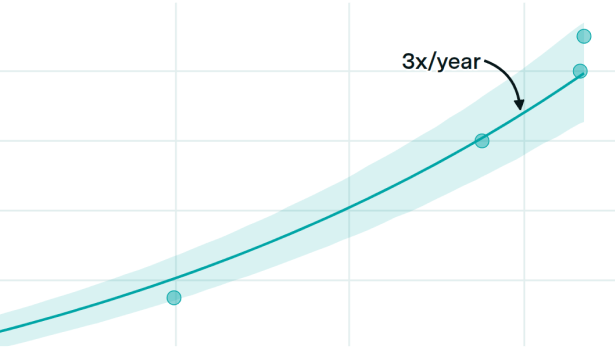
To put things into perspective, OpenAI’s annualized revenue was $13 billion back in August, and growing at about 4.3× a year. On that trend, we’d expect an annualized revenue of around $21 billion by the end of the year, which is essentially what we’ve seen.5 So under this lens, revenue (and hence adoption) has continued following extremely fast historical trends.
How embedded is AI in daily tasks and jobs?
Knowing about the rate of adoption already tells us a lot, but to understand how AI is impacting society, we need to look further. We want to understand how AI is actually being used, and by who.
AI has entered the workplace beyond formal enterprise adoption
The first step is to move beyond individual consumers to the workplace. This is important because an increasing share of OpenAI’s revenue has come from enterprise products like ChatGPT Enterprise and ChatGPT Business.6
The obvious way to measure workplace AI adoption is to look at enterprise deployments. For example, the Ramp AI Index we cited back in July measures the “share of U.S. businesses with paid subscriptions to AI models, platforms, and tools”.
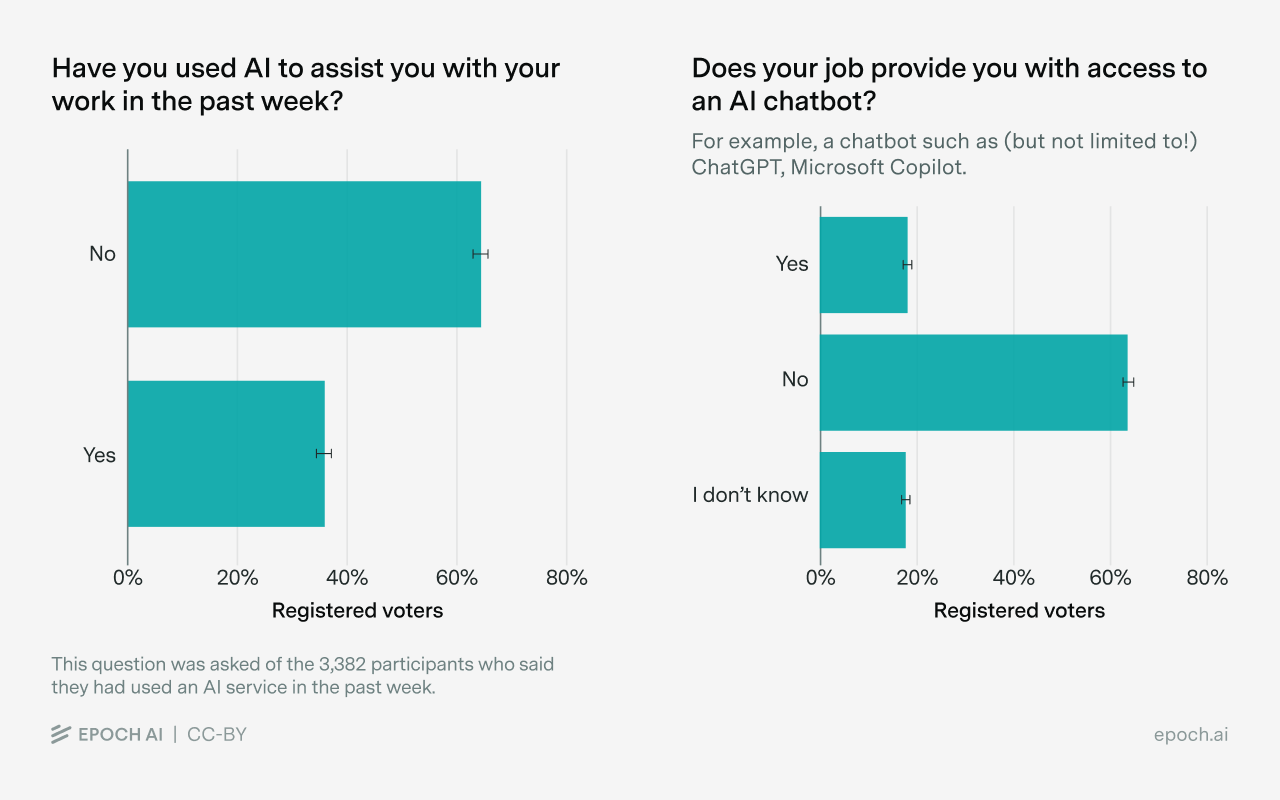
But this misses a large share of actual work usage — many people are using AI for their jobs, even if their employers don’t provide them access. We can see this by looking at our survey data. On the one hand, 36% of respondents who used AI in the past week said they had used it to assist with work. On the other hand, only about 18% of those same respondents said that their job provides access to an AI chatbot, and another 18% weren’t sure!
This gap suggests that a substantial share of workplace AI use is happening on workers’ own initiative, using free tiers or personal subscriptions rather than employer-provided tools. While the proportion of respondents who reported using AI for work does vary across job categories, the effect size is lower than we expected: less than 10 percentage points between “Office job” workers (34.6%) and workers in “Manual, non customer-facing” jobs (25.8%).
Most consumers use AI to seek information
On paper, modern frontier LLMs are optimized for a wide range of tasks, such as coding and writing. But there’s one use case that stands out by far — looking up information. About 58% of AI users in our survey reported using it for this purpose in the past week. Writing assistance (32%) and advice (30%) came next, followed by technical tasks (18%), multimedia (17%), and self-expression (16%).
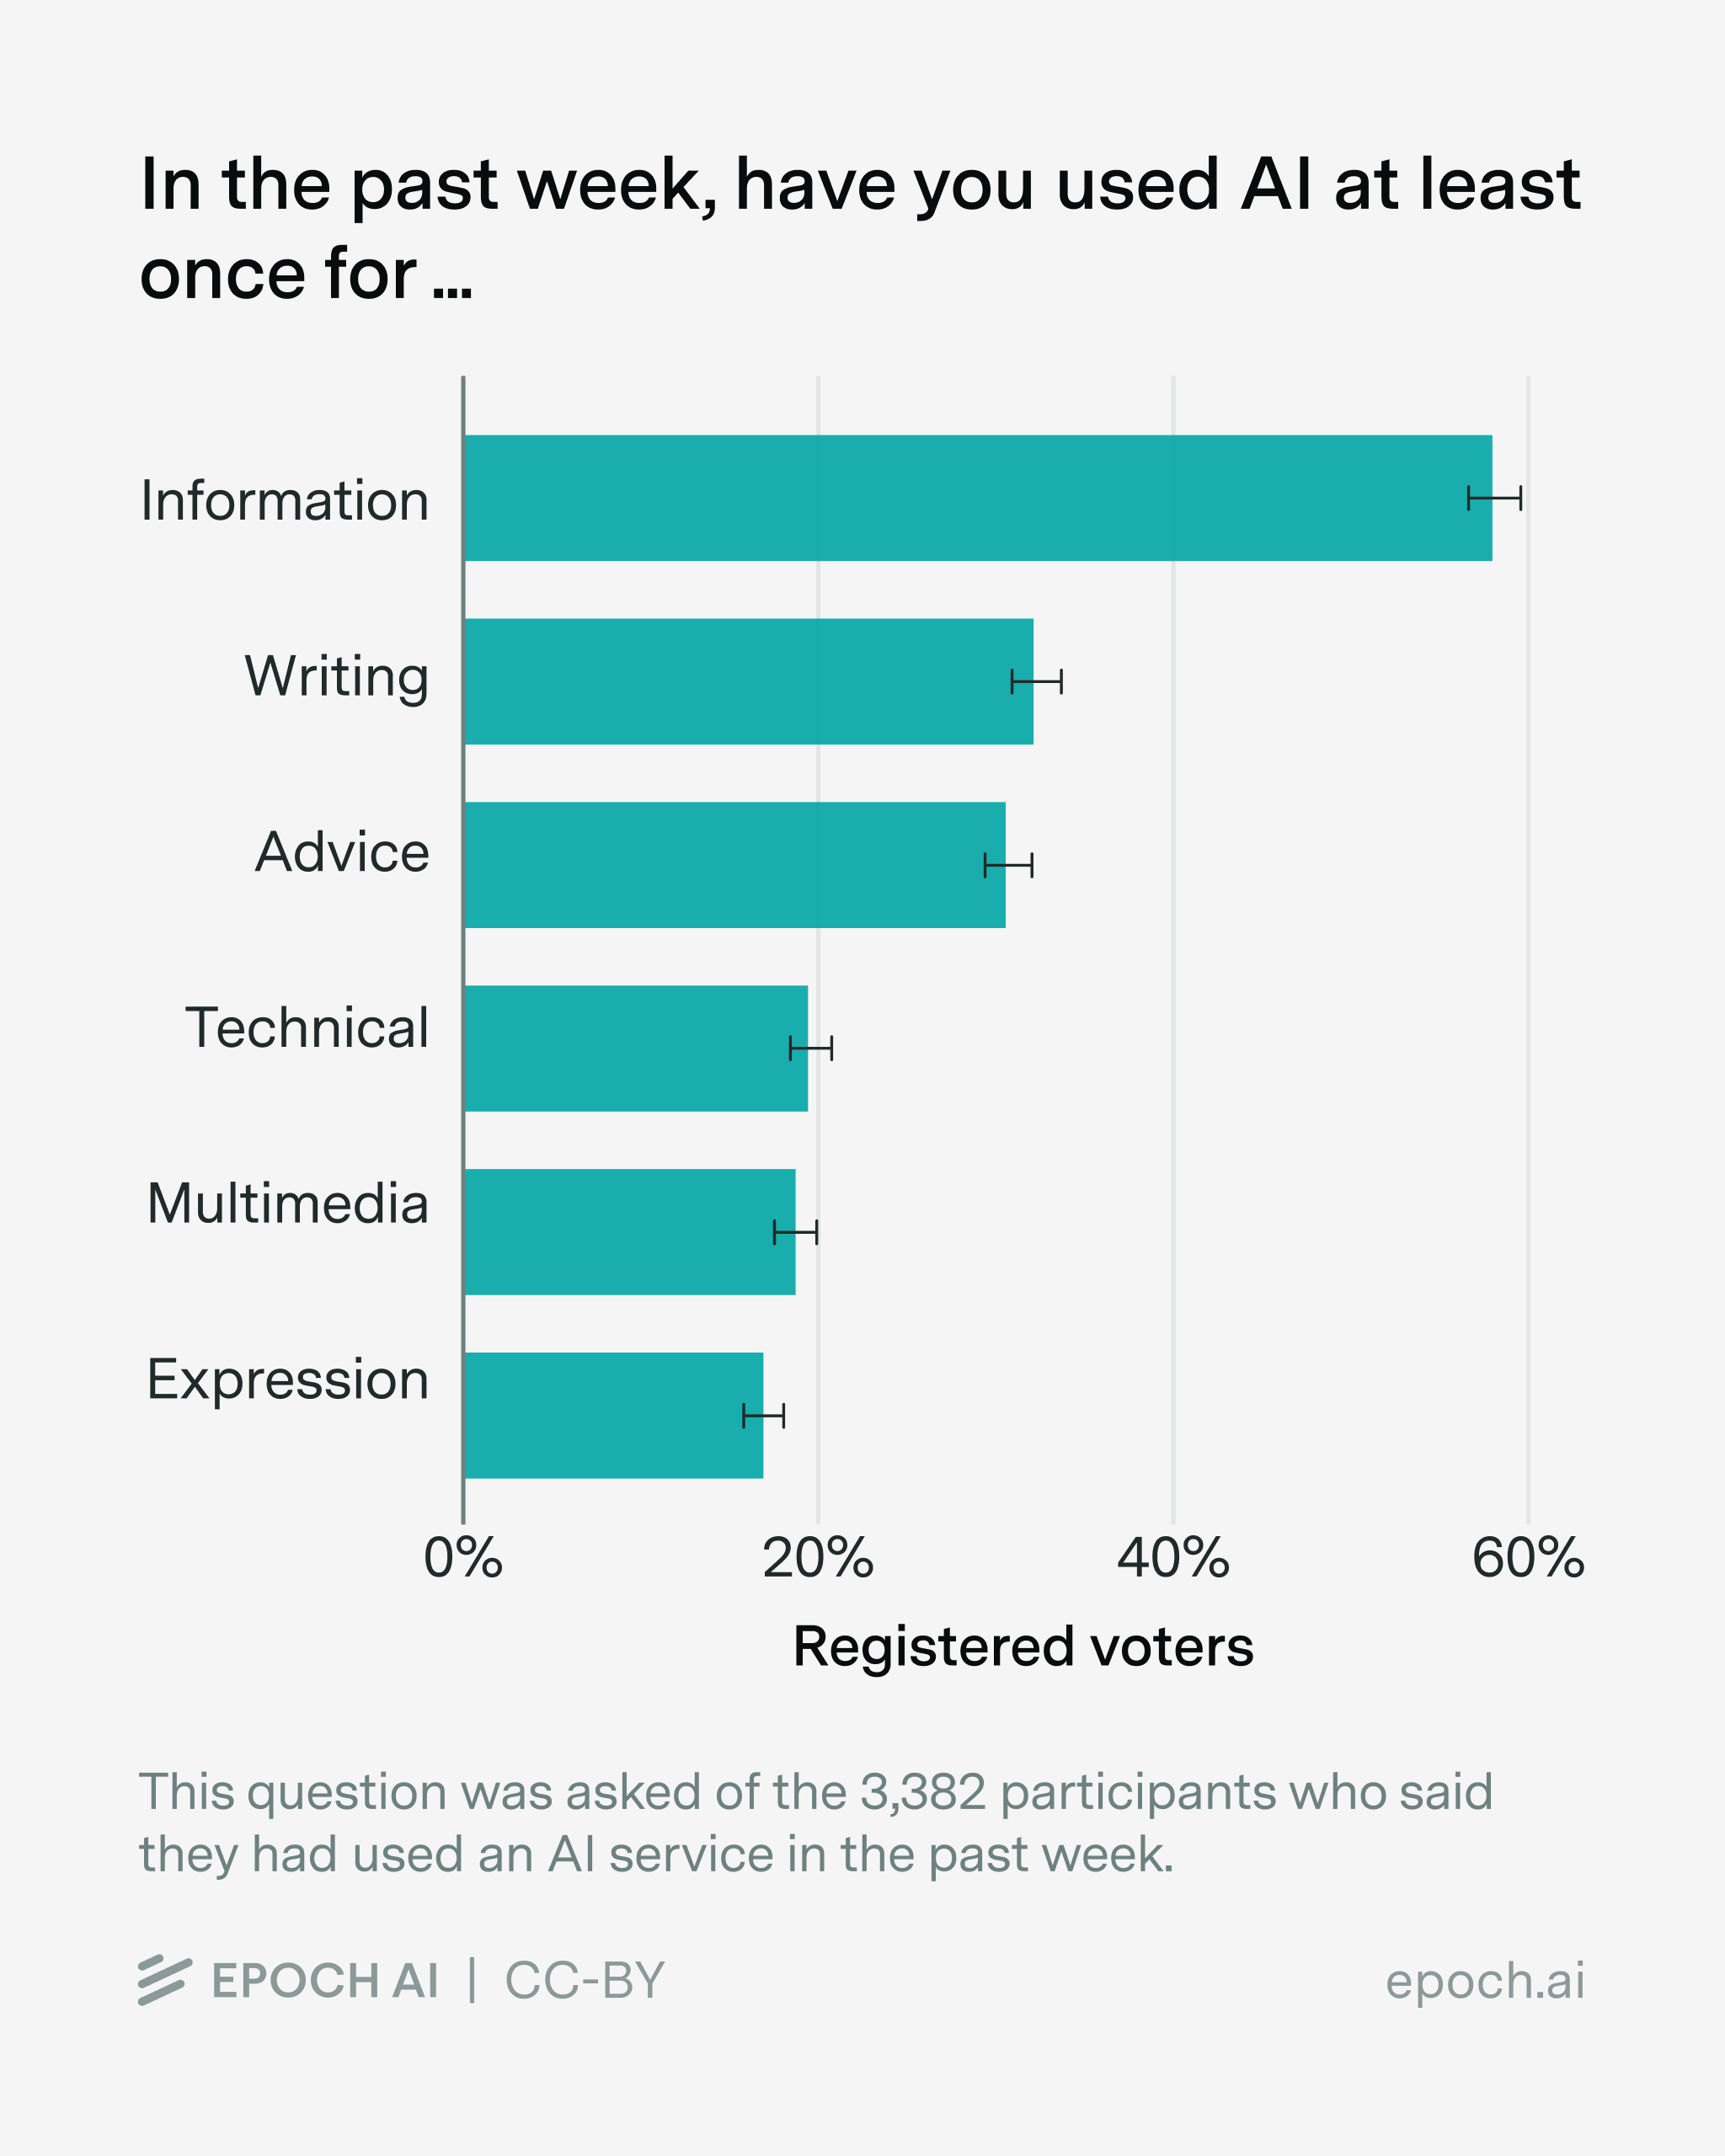
This pattern aligns with OpenAI’s “How People Use ChatGPT” report, which found that “Practical Guidance,” “Seeking Information,” and “Writing” accounted for the largest share of ChatGPT messages.7 It also matches the results of another recent survey, which found “General information or answering question” as the most common use case by far. For most users, these tools function as an enhanced search engine and writing aid, rather than as autonomous agents or virtual companions.
This raises a question: how much does progress on frontier capabilities actually matter for typical users? The benchmarks that AI labs optimize for — SWE-bench Verified (coding), GPQA Diamond (advanced scientific reasoning), FrontierMath (hard math problems), METR’s suite and GDPVal (autonomous task completion) — seem quite distant from “seeking information (e.g. to look up a fact, as a replacement for Google, to get product recommendations),” which is how we described the category to poll respondents. The closest benchmark to this dominant use case might be something like OpenAI’s BrowseComp, which tests web browsing and information retrieval, but usually gets less airtime.
In practice, different capabilities have been highly correlated: models that score well on coding benchmarks also tend to score well on reasoning and information retrieval. So progress on frontier benchmarks may benefit typical users anyway, if the correlation in benchmark scores actually reflects a deep shared latent ability factor. On the other hand, if benchmark scores are correlated for more contingent reasons, there could be a real tradeoff between pushing frontier capabilities in specific domains and catering to the most common use cases.
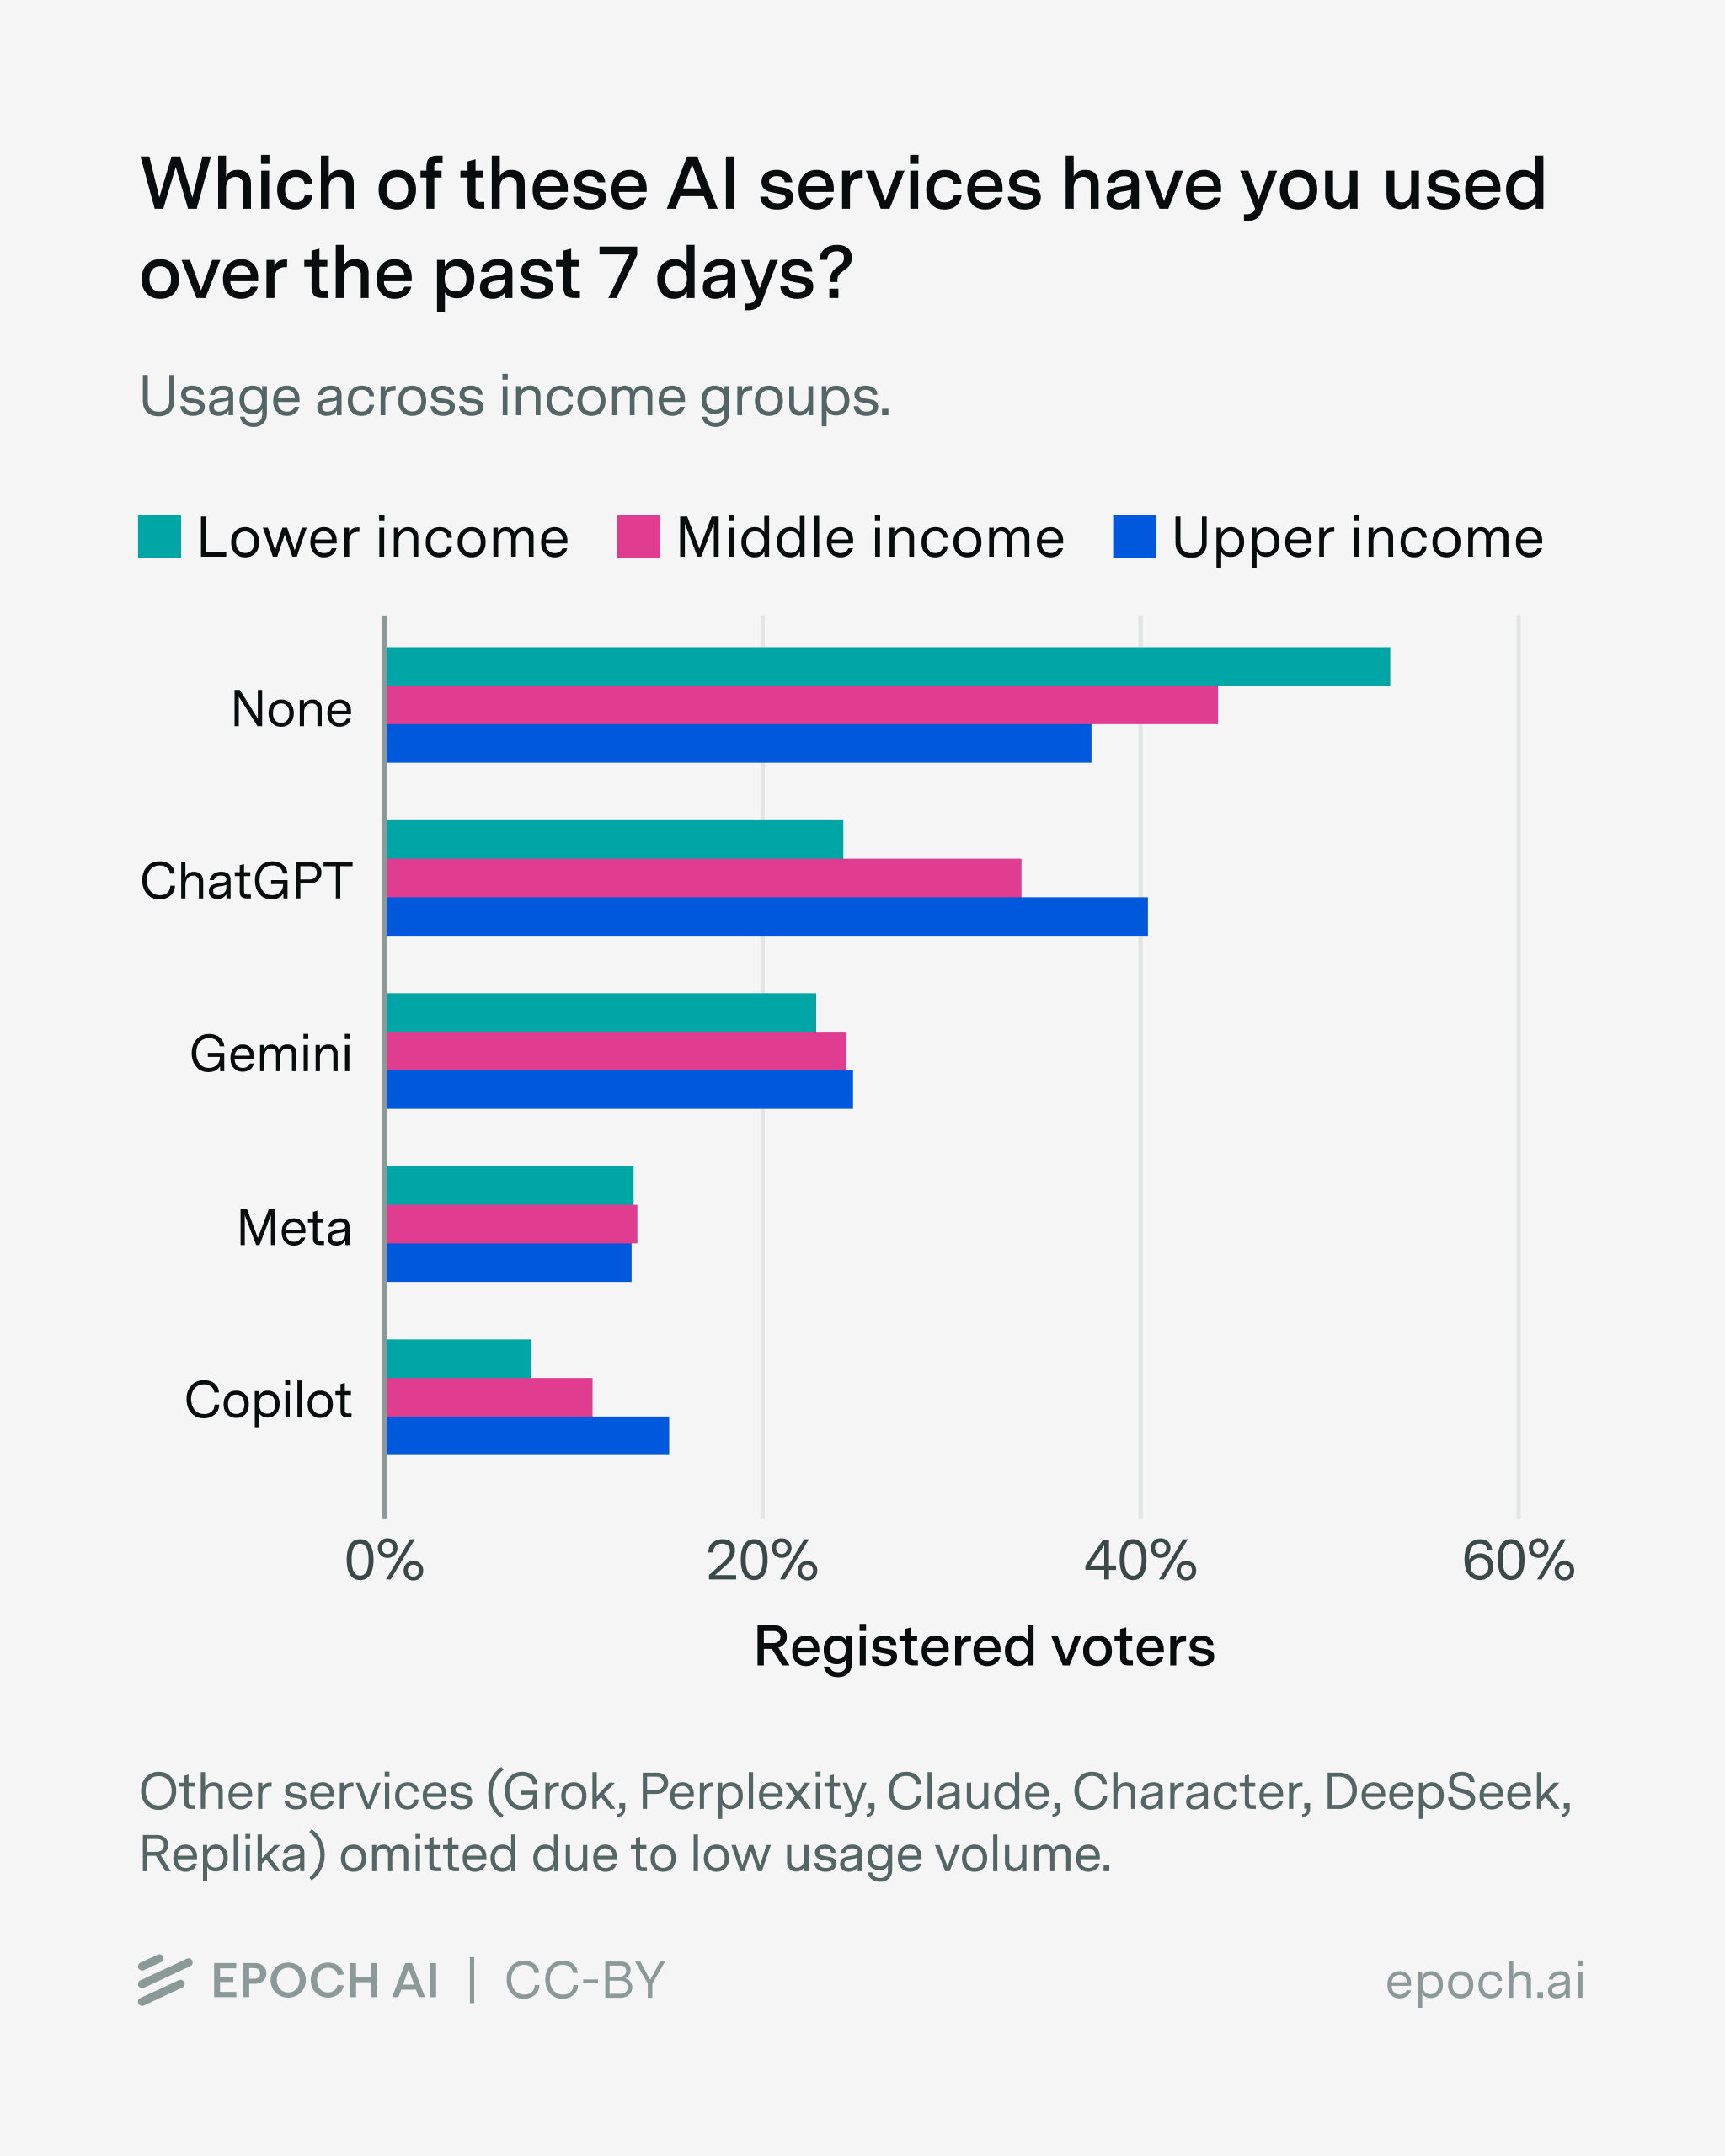
AI use is stratified by income and job type, and less so by gender
Who is using AI? We found that higher-income respondents were substantially more likely to have used AI in the past week, and the pattern holds across services: ChatGPT, Gemini, and Copilot usage all skew toward upper-income groups.
Age also matters: younger respondents (18-34) are more likely to use AI than those over 65, with the gap especially pronounced for ChatGPT.
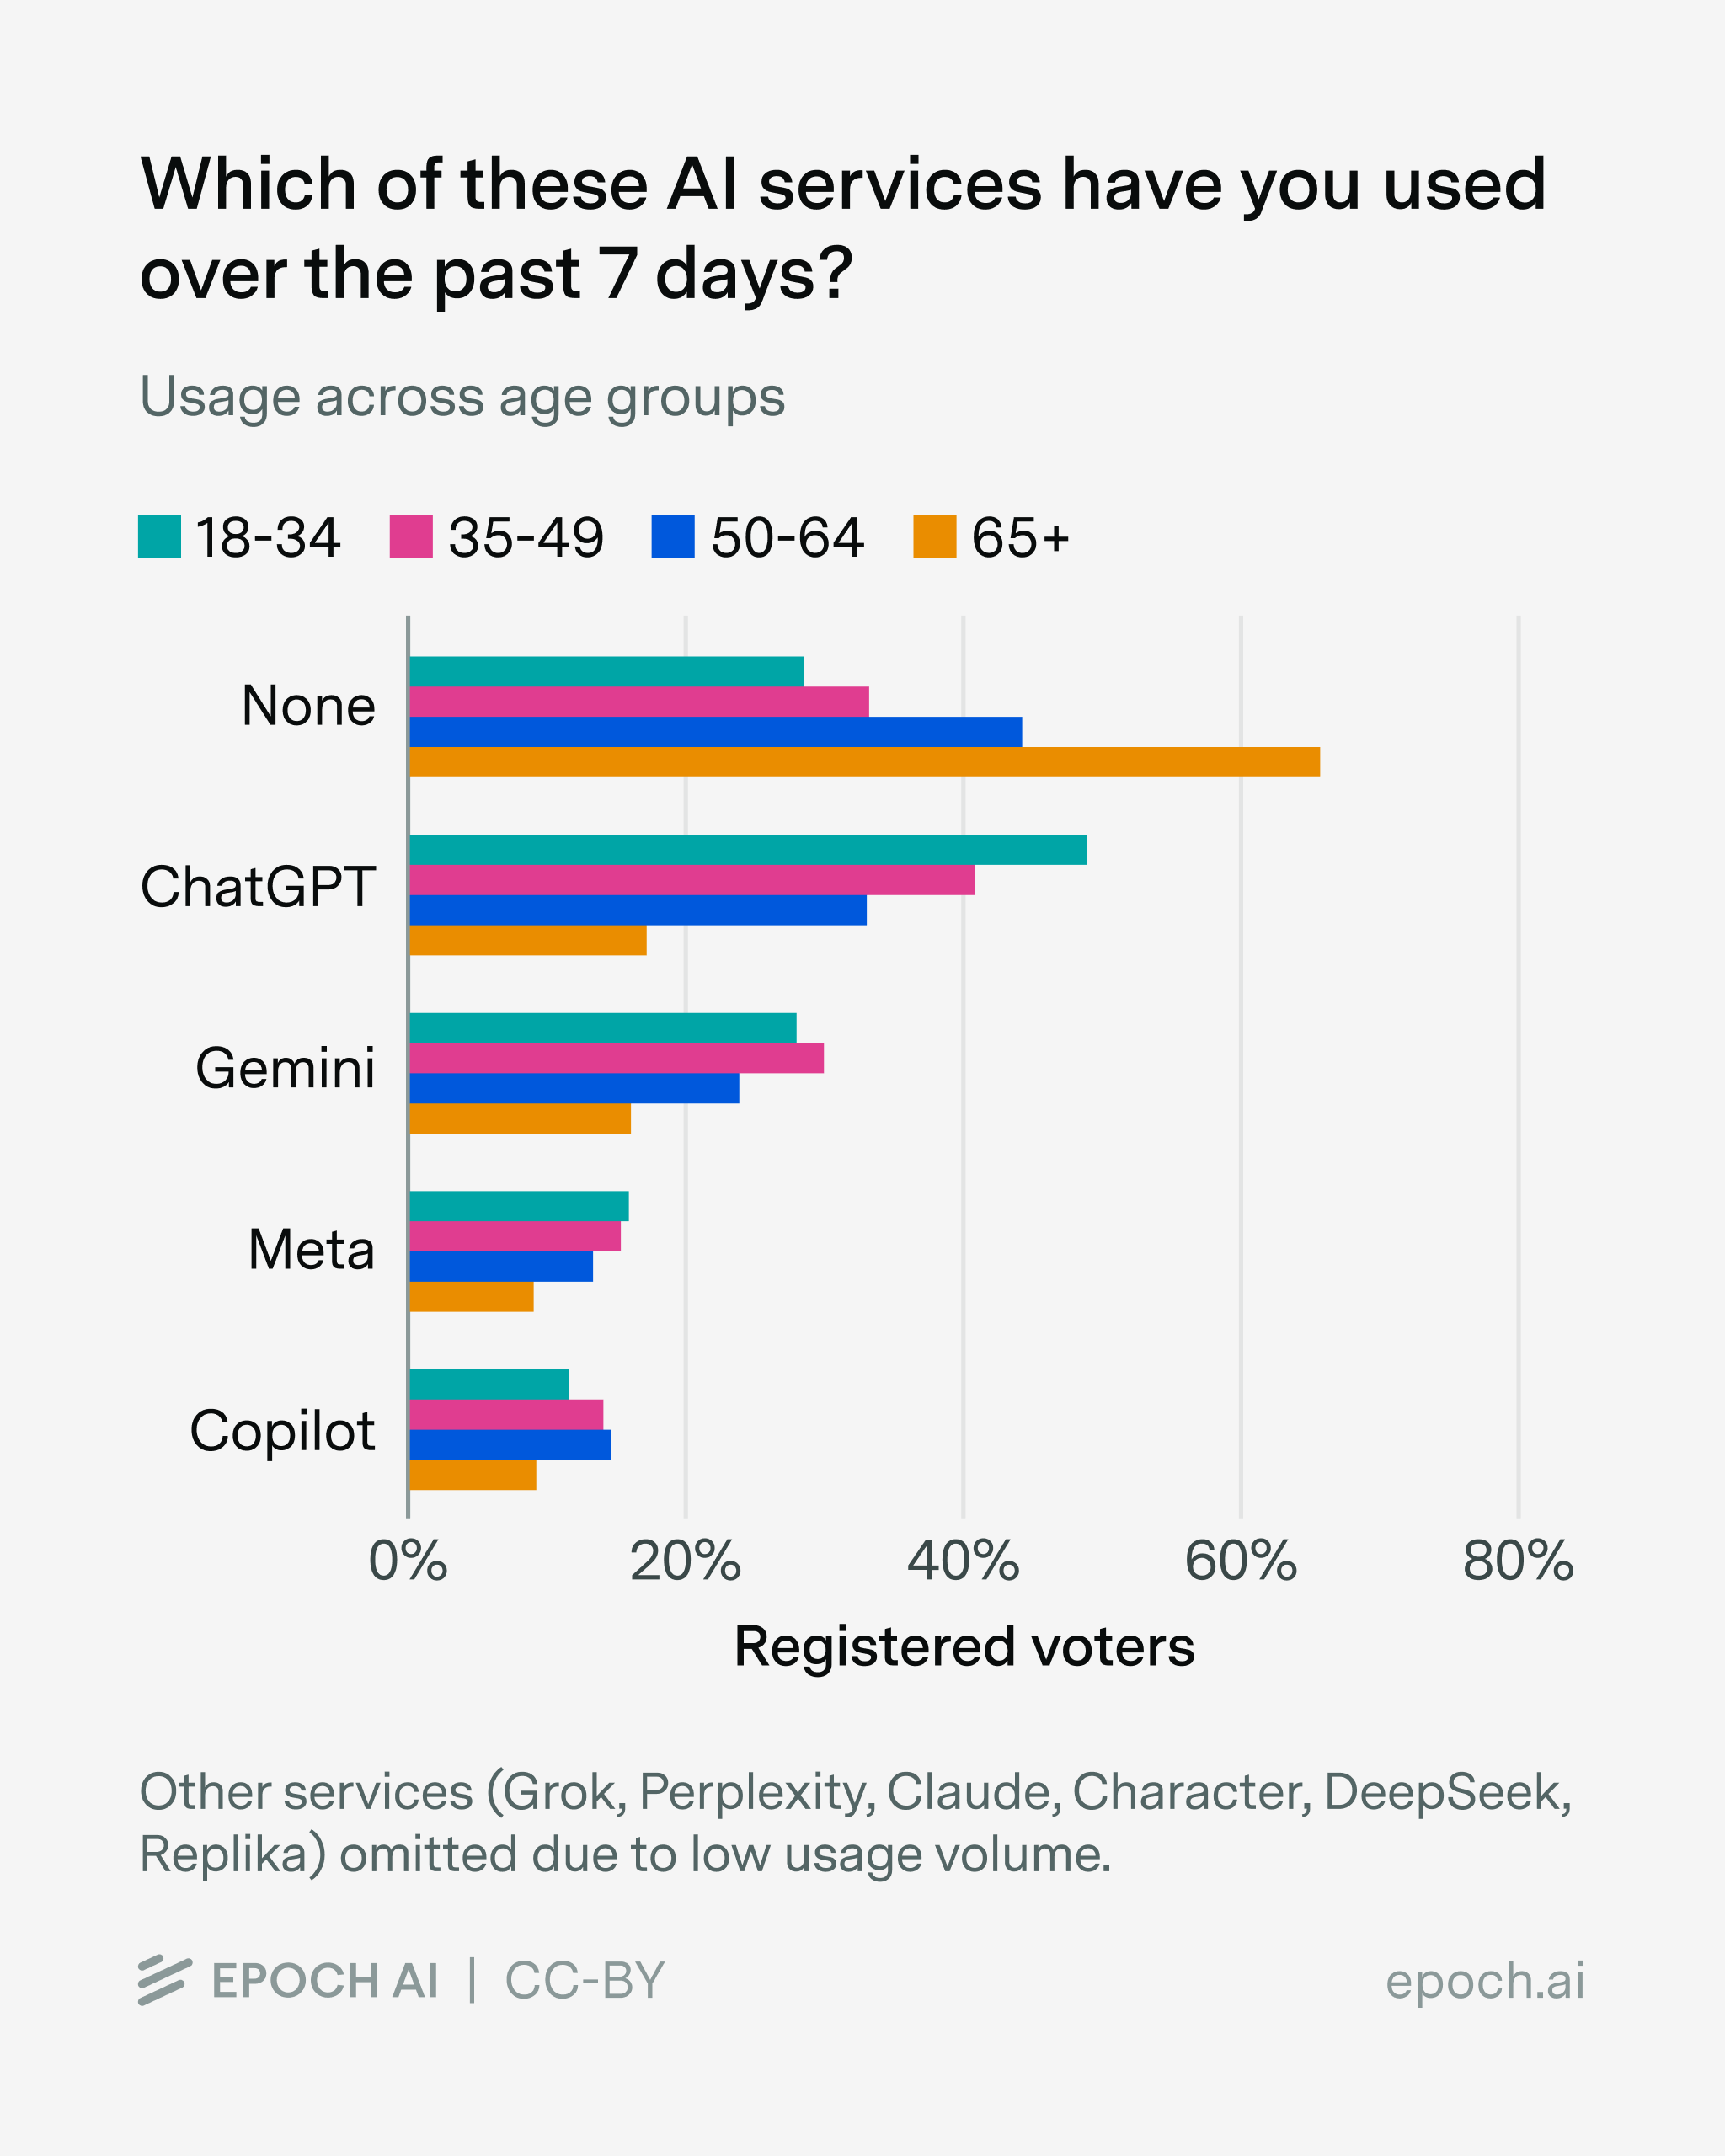
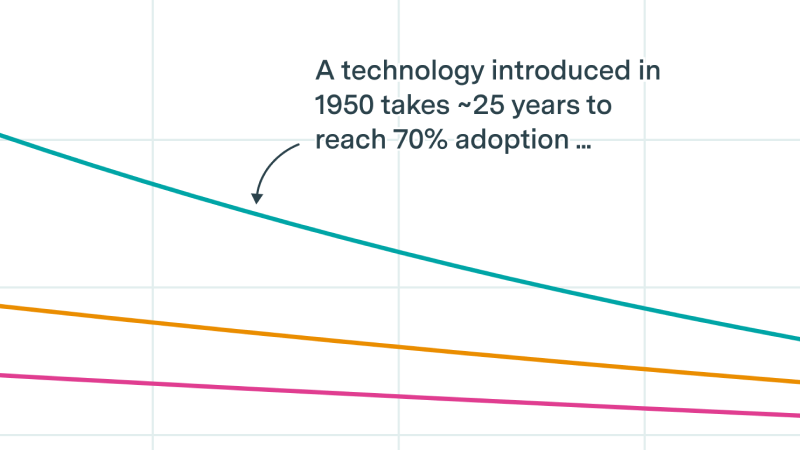
How does this age gap compare to previous technologies? Among respondents 65 and older, about 34% reported using an AI service in the past week. According to Pew Research data, that’s roughly comparable to internet use among the same age group around 2007, when about 35% of Americans over 65 were online.8 It’s also similar to smartphone ownership among over-65s around 2015–2016, when about 30–40% owned one. In other words, AI adoption among older adults today looks similar to where internet and smartphone adoption were roughly 18 and 10 years ago respectively — past the early enthusiast phase, but still with substantial room to grow.
Gender, by contrast, shows relatively little difference in our data: 59.8% of men had used at least one AI tool over the past week, compared with 54.4% of women. This is notable given that early ChatGPT adoption skewed heavily male; OpenAI researchers documented a dramatic narrowing of this gender gap over time, and our polling also suggests it has largely closed for general usage.
Conclusion
In summary, consumer AI adoption remains strong, but the picture is more nuanced than headline user counts suggest. ChatGPT remains dominant and keeps acquiring users, but Gemini’s user growth has been faster over the last few months. Web traffic is plateauing, but usage has shifted to apps. OpenAI’s revenue seems to be on track, but consumer revenue is likely decreasing as a share.
Meanwhile, the way people use these tools is becoming clearer. Most consumers treat AI as a search-and-writing assistant, not as an autonomous agent completing tasks end-to-end or as a virtual partner. And a substantial share of workplace AI use is happening bottom-up, with workers adopting tools on their own rather than waiting for employer-provided access.
-
In particular, this includes data from OpenAI, Google, as well as third-party analytics firms like SensorTower or SimilarWeb.

-
This is shown in Figure 21 of the report.
-
Our polling data is consistent with this: as part of our polling partnership with Blue Rose Research, they asked US adults how often they use AI tools, across three waves from June through November. After reweighting to be representative of US registered voters, the share reporting they use AI tools “once or twice a week” or more frequently was essentially flat: 36.5% in June to July, 37.0% in mid-July to August, and 38.9% in November.
-
Unfortunately, it’s hard to be sure how many of these 1 billion users come from deliberate adoption rather than accidental one-time triggers. We might also be skeptical of this number for other reasons — for example, our US survey suggests Meta AI still lags far behind ChatGPT and Gemini in use. But it’s hard to be certain because our survey data applies to US data, whereas Meta’s strength is in markets outside the US (where WhatsApp dominates).
-
Strictly speaking, OpenAI’s annualized revenue is $19 billion as of mid-December. That’s slightly below the extrapolated $21 billion, but annualized revenues are quite a noisy metric, so these two numbers seem close enough to say that revenue growth has been roughly on trend.
-
ChatGPT had 35 million consumer subscribers in July 2025. Assuming all subscriptions were ChatGPT Plus at $20/month (a lower bound, since some are ChatGPT Pro at $200/month), this implies consumer annualized revenue of at least $8.4 billion. Since total annualized revenue at the end of July was $12 billion, consumer subscriptions were at least 70% of revenue, most likely more.
-
Unlike our poll, “How people use ChatGPT” found that “Practical guidance” accounts for a higher share of messages than “Seeking information”. We think this might be because “Practical guidance” queries involve more messages per session, as users are more likely to ask follow-up questions.
-
The Pew data surveys U.S. adults, while our poll’s percentages apply to U.S. registered voters. This likely doesn’t affect the comparison too much: the largest difference between registered voters and the general adult population is age composition, and here we’re looking specifically at the 65+ group.
About the authors
Related work