Training open-weight models is becoming more data intensive
The ratio of training data to active parameters in open-weight LLMs has grown 3.1x per year since 2022. Recent models have been trained with 20 times more data per parameter than the optimal ratio suggested by the 2022 Chinchilla scaling laws. Our analysis focuses on open-weights models, where information on training tokens and parameters is more available.
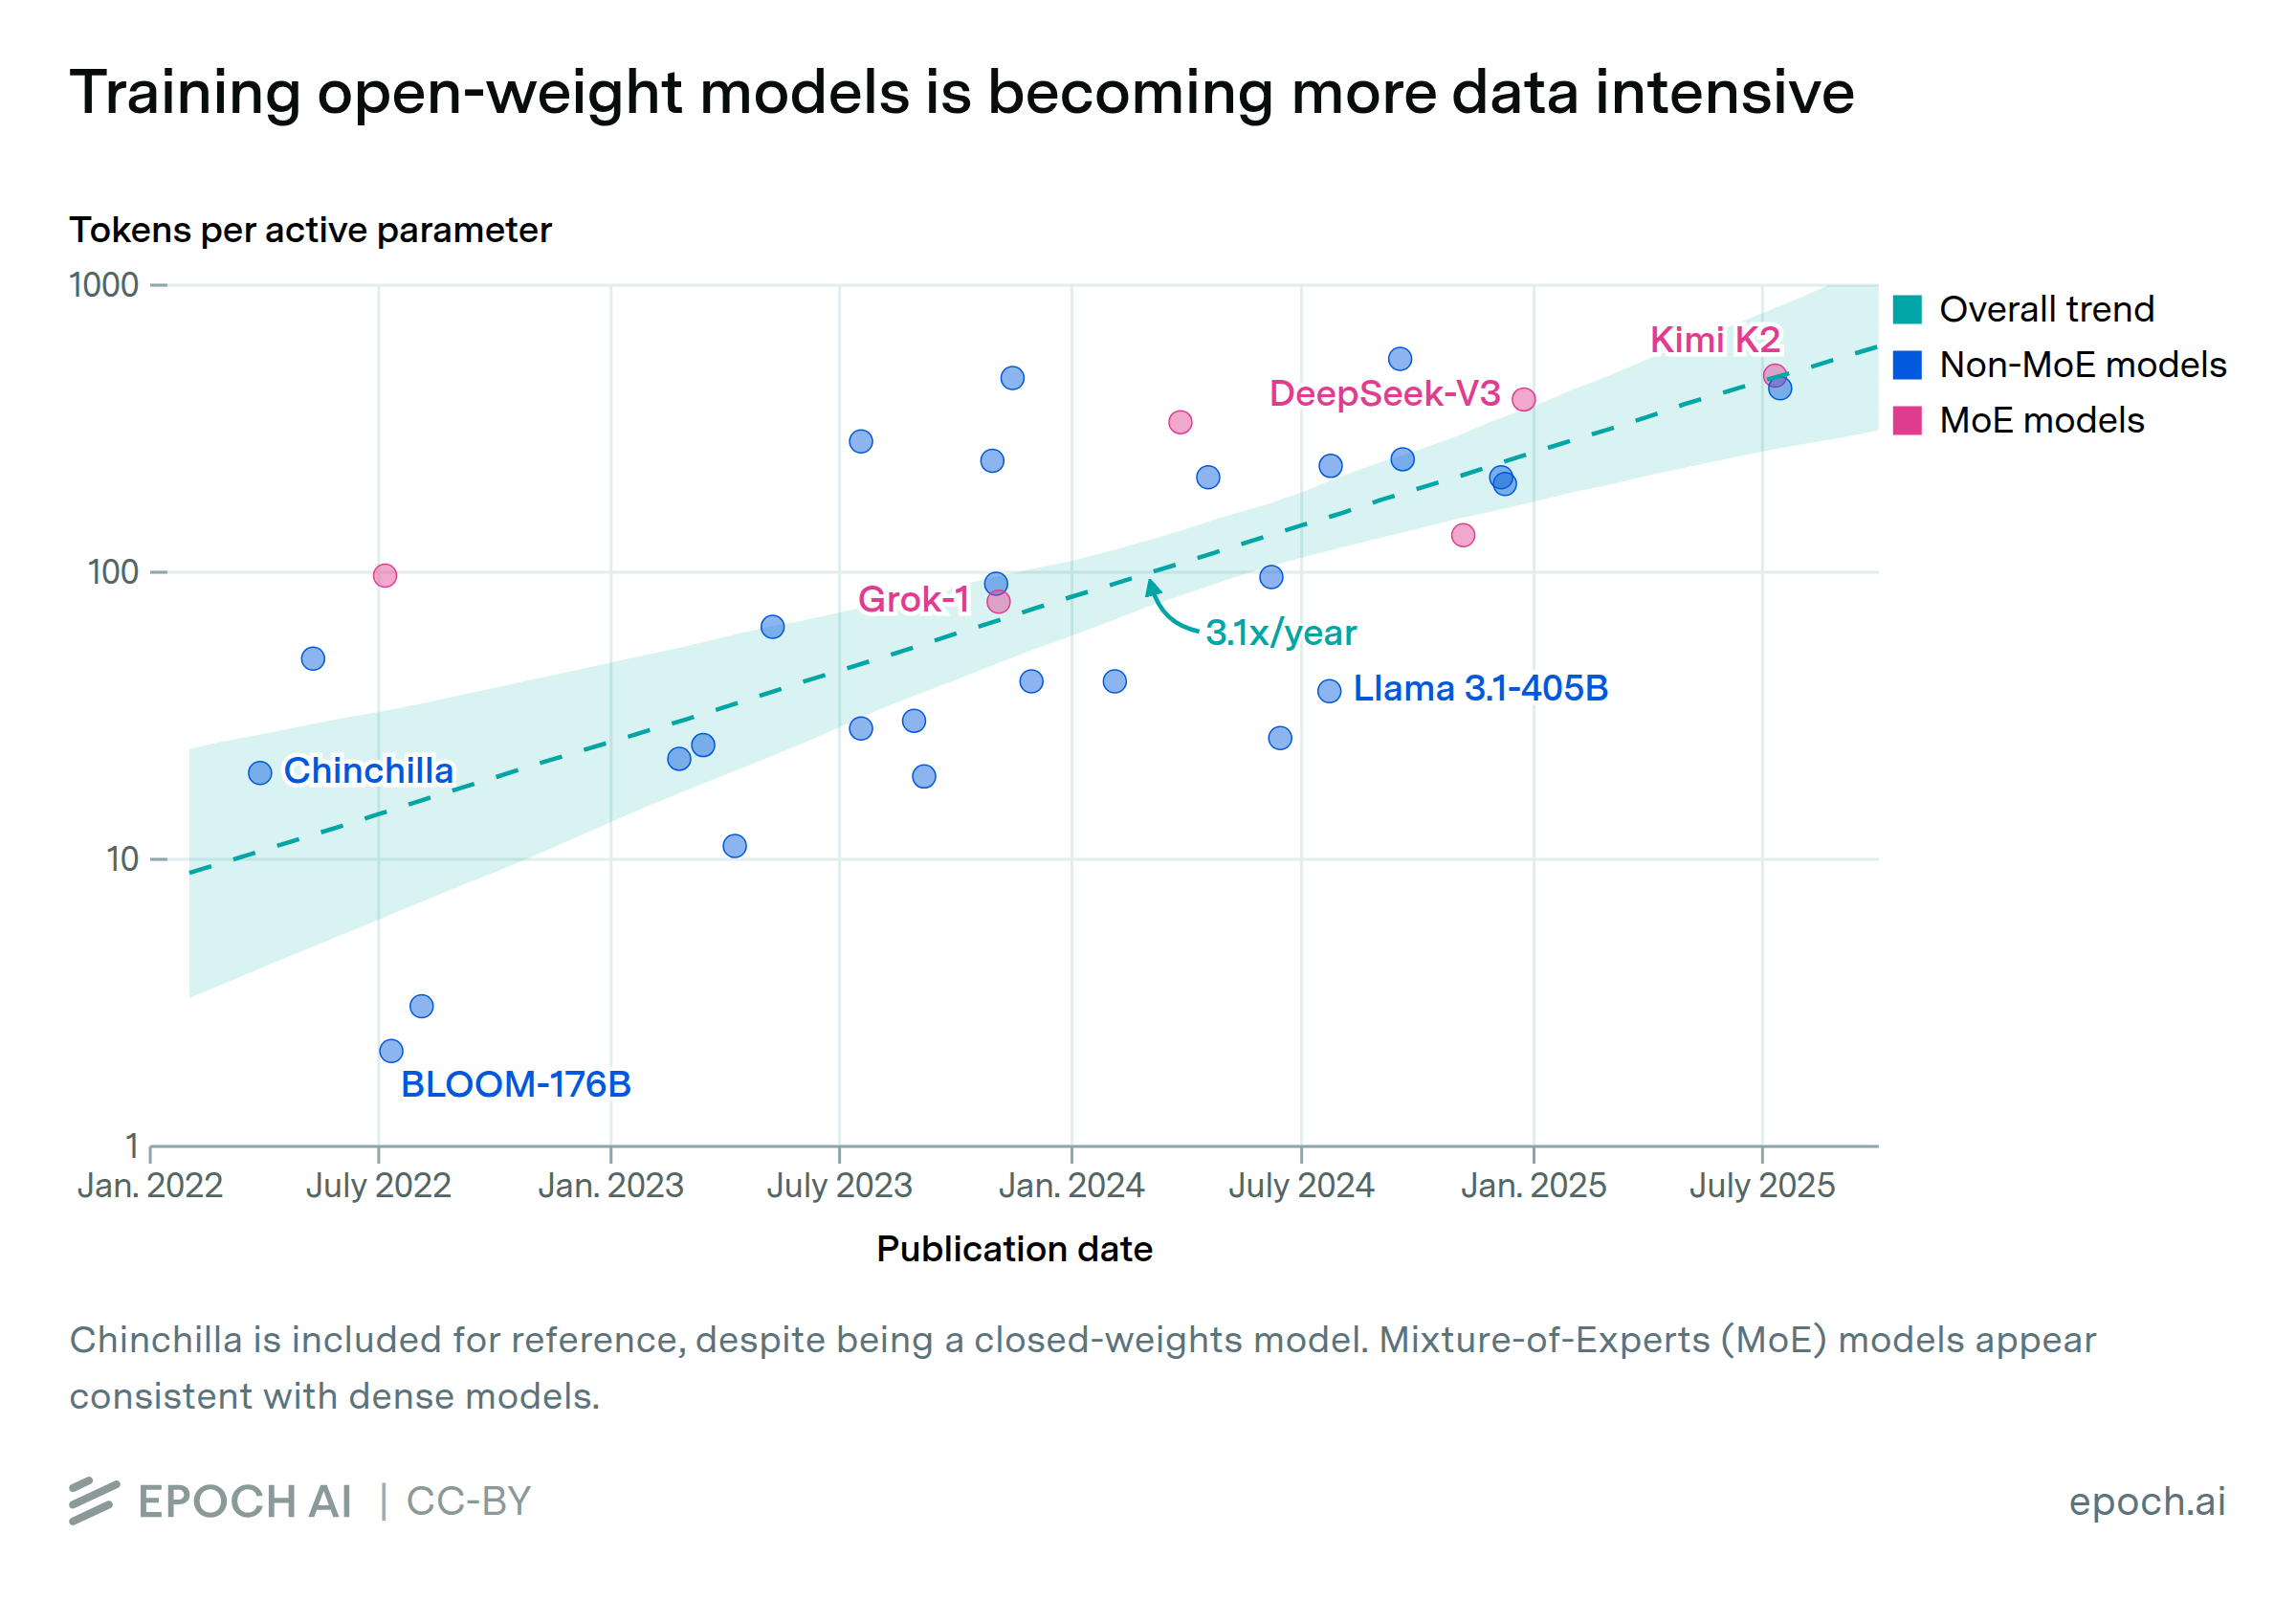
This trend could be driven by economic incentives: models trained on higher tokens per parameter ratios can achieve comparable performance with fewer parameters, making them less expensive to serve at inference time. Open-weight developers may also favor scaling data rather than parameters to keep their models accessible for users to run on their local infrastructure.
Authors
Published
August 01, 2025
Learn more
Overview
We explore trends in the number of tokens per active parameter used to train notable open-weight language models. Tokens per parameter is the total number of training tokens - calculated as dataset size multiplied by epochs - divided by the number of activated parameters on a forward pass. Our analysis shows an upward trend: the average tokens per parameter was approximately 10 in 2022 and climbed to around 300 by 2025.
However, it is important to note that this trend may not hold for closed models, which include many current frontier models. We lack public data to estimate their token-to-parameter ratios.
Code for this analysis is available here.
Data
We use Epoch AI’s Notable Models database and pull relevant fields including publication date, number of parameters, estimated training compute, and training dataset size. To focus on models trained from scratch, we exclude non‑language systems as well as any fine‑tuned, continually trained, or distilled variants, since their token‑per‑parameter ratios reflect downstream adaptations rather than pre‑training dynamics.
For transformer-based models lacking reported dataset sizes but have available compute estimates (C) and active parameter counts (N), we infer their tokens to active param ratio by rearranging the relation C=6 N D to:
\[ \frac{D}{N} = \frac{C}{6N^2}. \]
We then include these estimated values of tokens per parameter in our overall trend analysis.
Analysis
We fit an exponential growth model by performing a linear regression on log(tokens per parameter) against model publication date. The resulting linear fit is statistically significant and shows a positive correlation between tokens per active parameter and model publication date.
To generate confidence intervals, we used bootstrap sampling with replacement (n=500). For each bootstrap sample, we resampled the 33 observations with replacement, refit the exponential growth model, and collected the resulting slope estimates. We then calculated the 5th and 95th percentiles of the bootstrap slope distribution to construct 90% confidence intervals.
The annual growth factor derived from the bootstrap median is 3.1x per year, with a 90% confidence interval of [2.1x, 4.9x].
Assumptions
The reliability of the findings are directly tied to the accuracy and completeness of the training dataset size, parameter count, and training compute estimates in our Notable AI models database.
An important limitation of our analysis is the lack of data on closed models. Many do not disclose key details such as training compute, parameter counts, or cumulative training tokens, which prevents us from estimating their tokens‑per‑parameter ratios.