

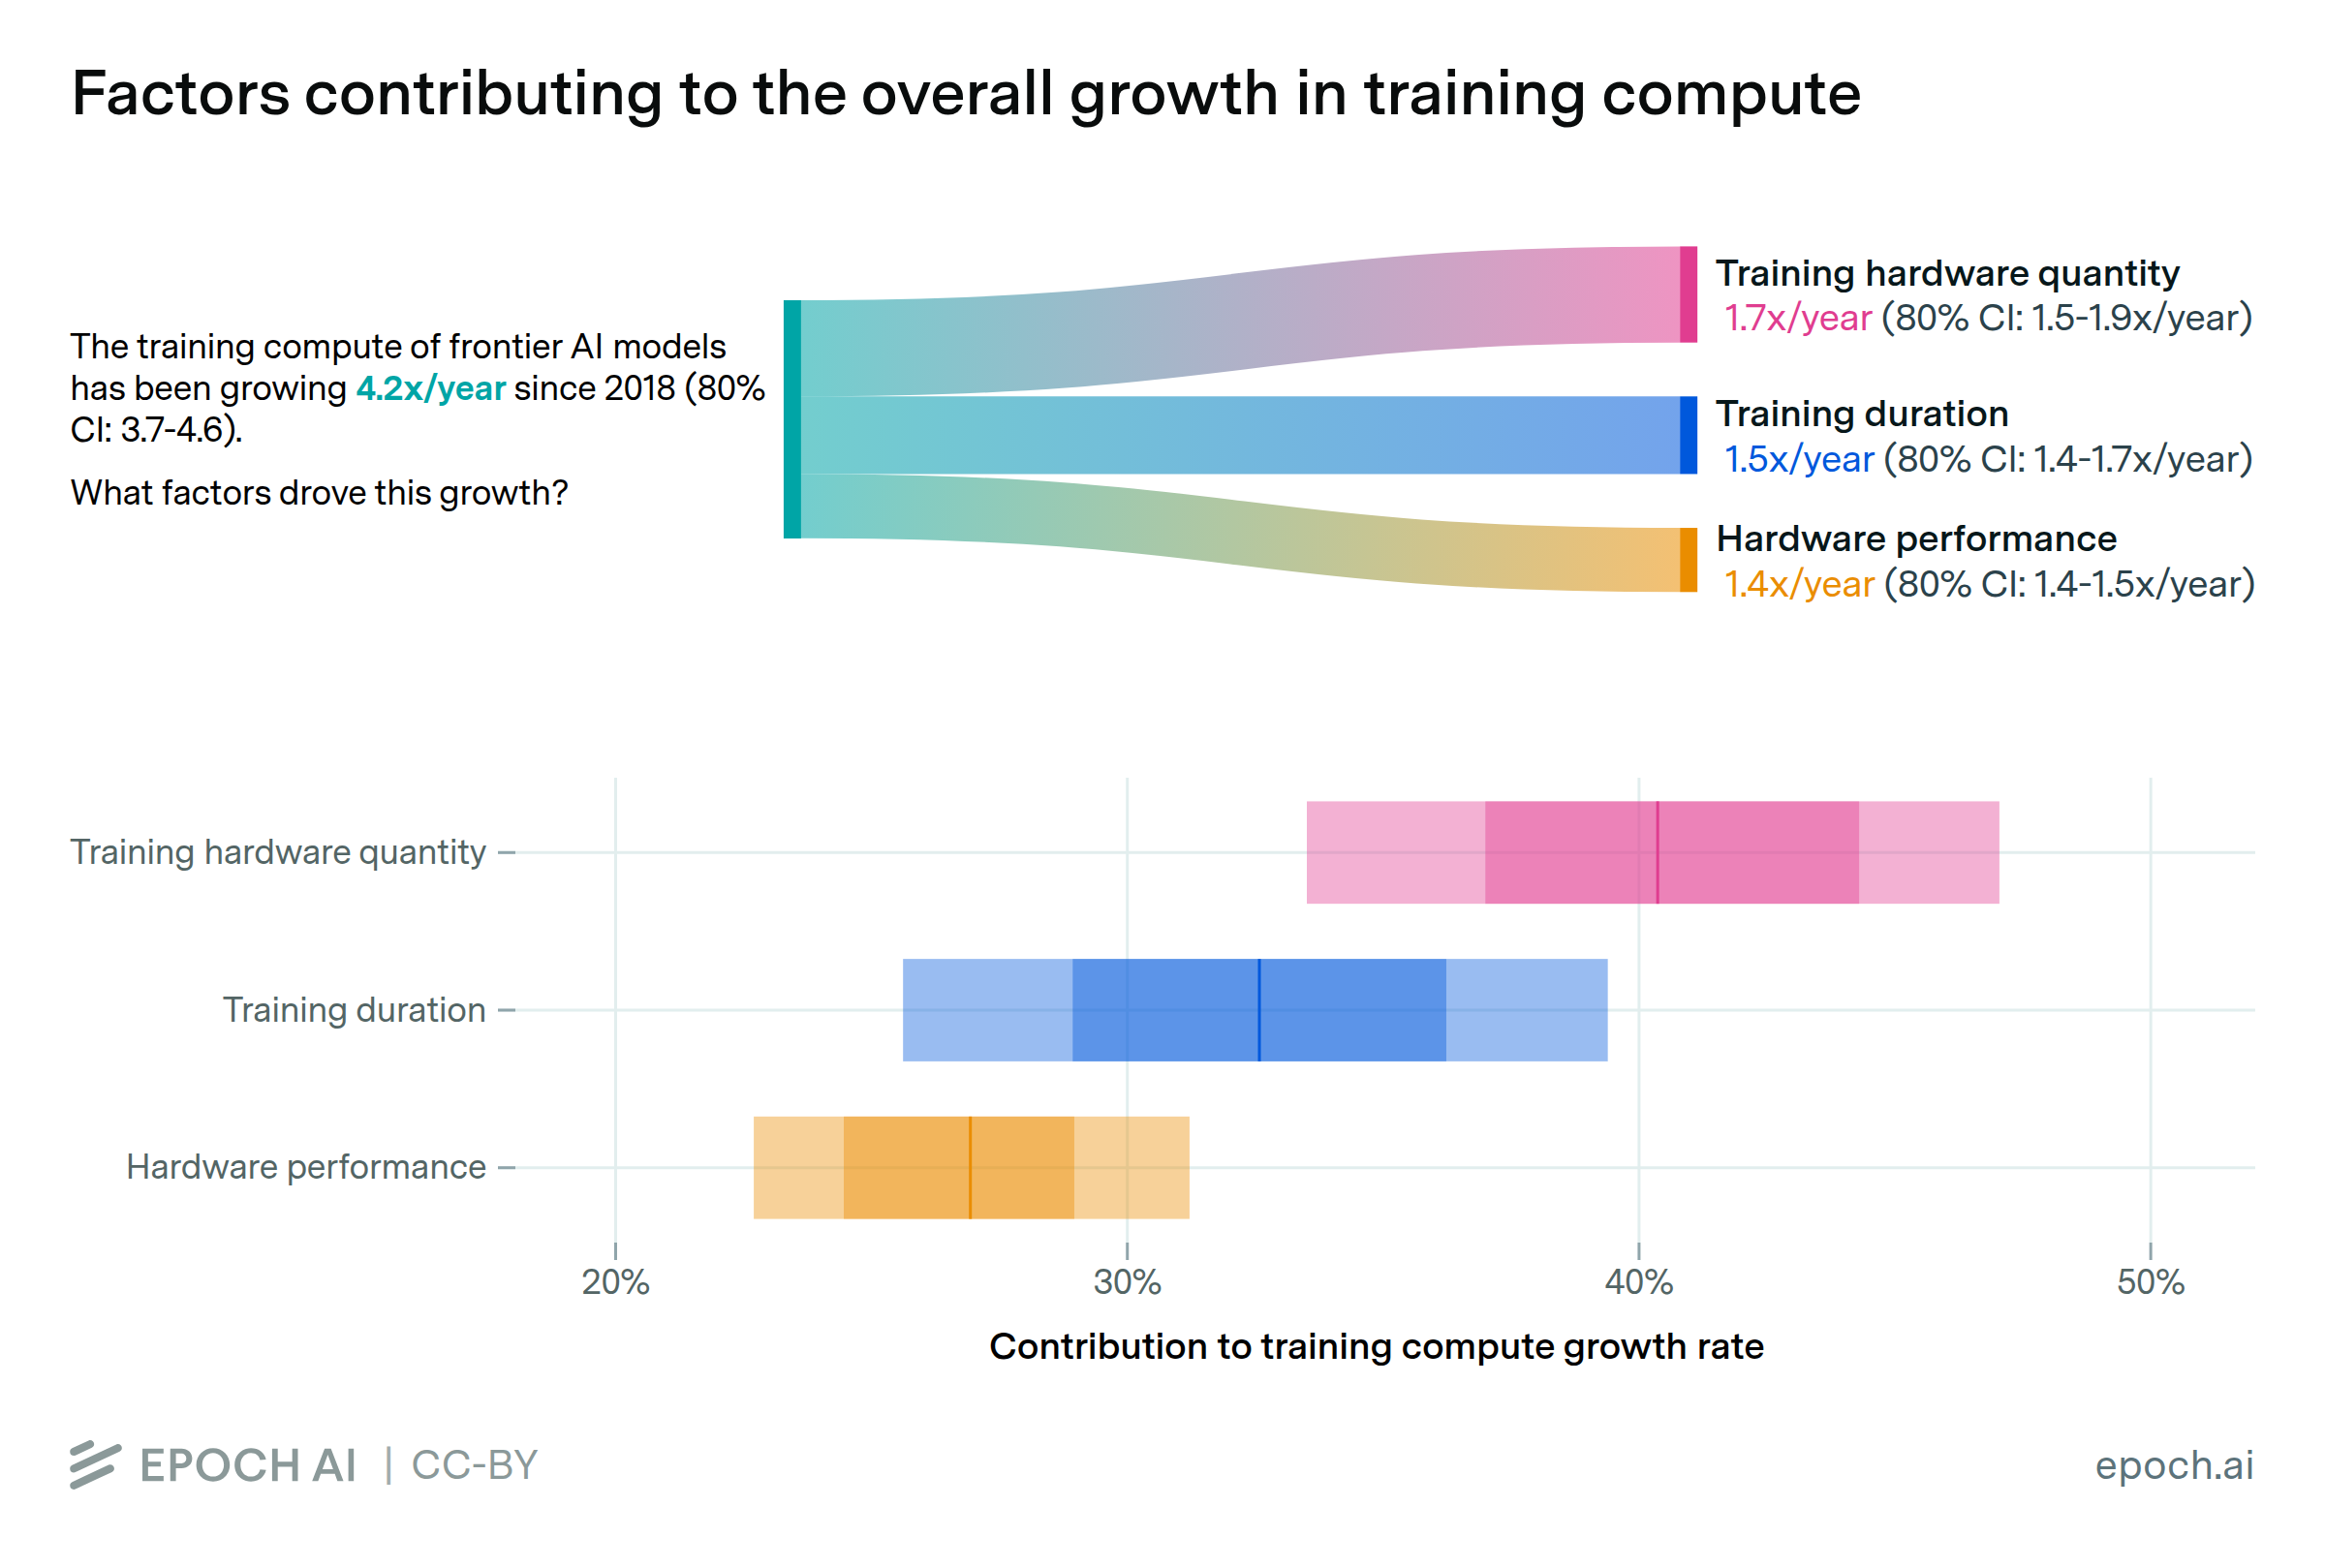
Since 2018, the most significant driver of compute scaling across frontier models has likely been an increase in the quantity of hardware used in training clusters. Also important have been a shift towards longer training runs, and increases in hardware performance.
These trends are closely linked to a massive surge in investment. AI development budgets have been expanding by around 2-3x per year, enabling vast training and inference clusters and ever-larger models.
Epoch's work is free to use, distribute, and reproduce provided the source and authors are credited under the Creative Commons BY license.
Learn more about this graph
As training compute for frontier AI models grows rapidly, understanding the key drivers of this growth becomes increasingly important. We analyze three main factors: hardware cluster sizes, per-unit hardware computing power, and training duration. By fitting exponential trends to these factors, we calculate their relative multiplicative contributions to the overall growth in training compute. Our analysis focuses on frontier models developed after 2018—a period during which we previously observed a 4-5x growth rate in training compute. We also examined potential trends in hardware utilization rates, finding weak evidence of a positive trend. However, since the data quality is poor and their impact is small, we omit them from our main analysis.
Data
Analysis
Assumptions
Explore this data
Our comprehensive database of over 3500 models tracks key factors driving machine learning progress.