The stock of computing power from NVIDIA chips is doubling every 10 months
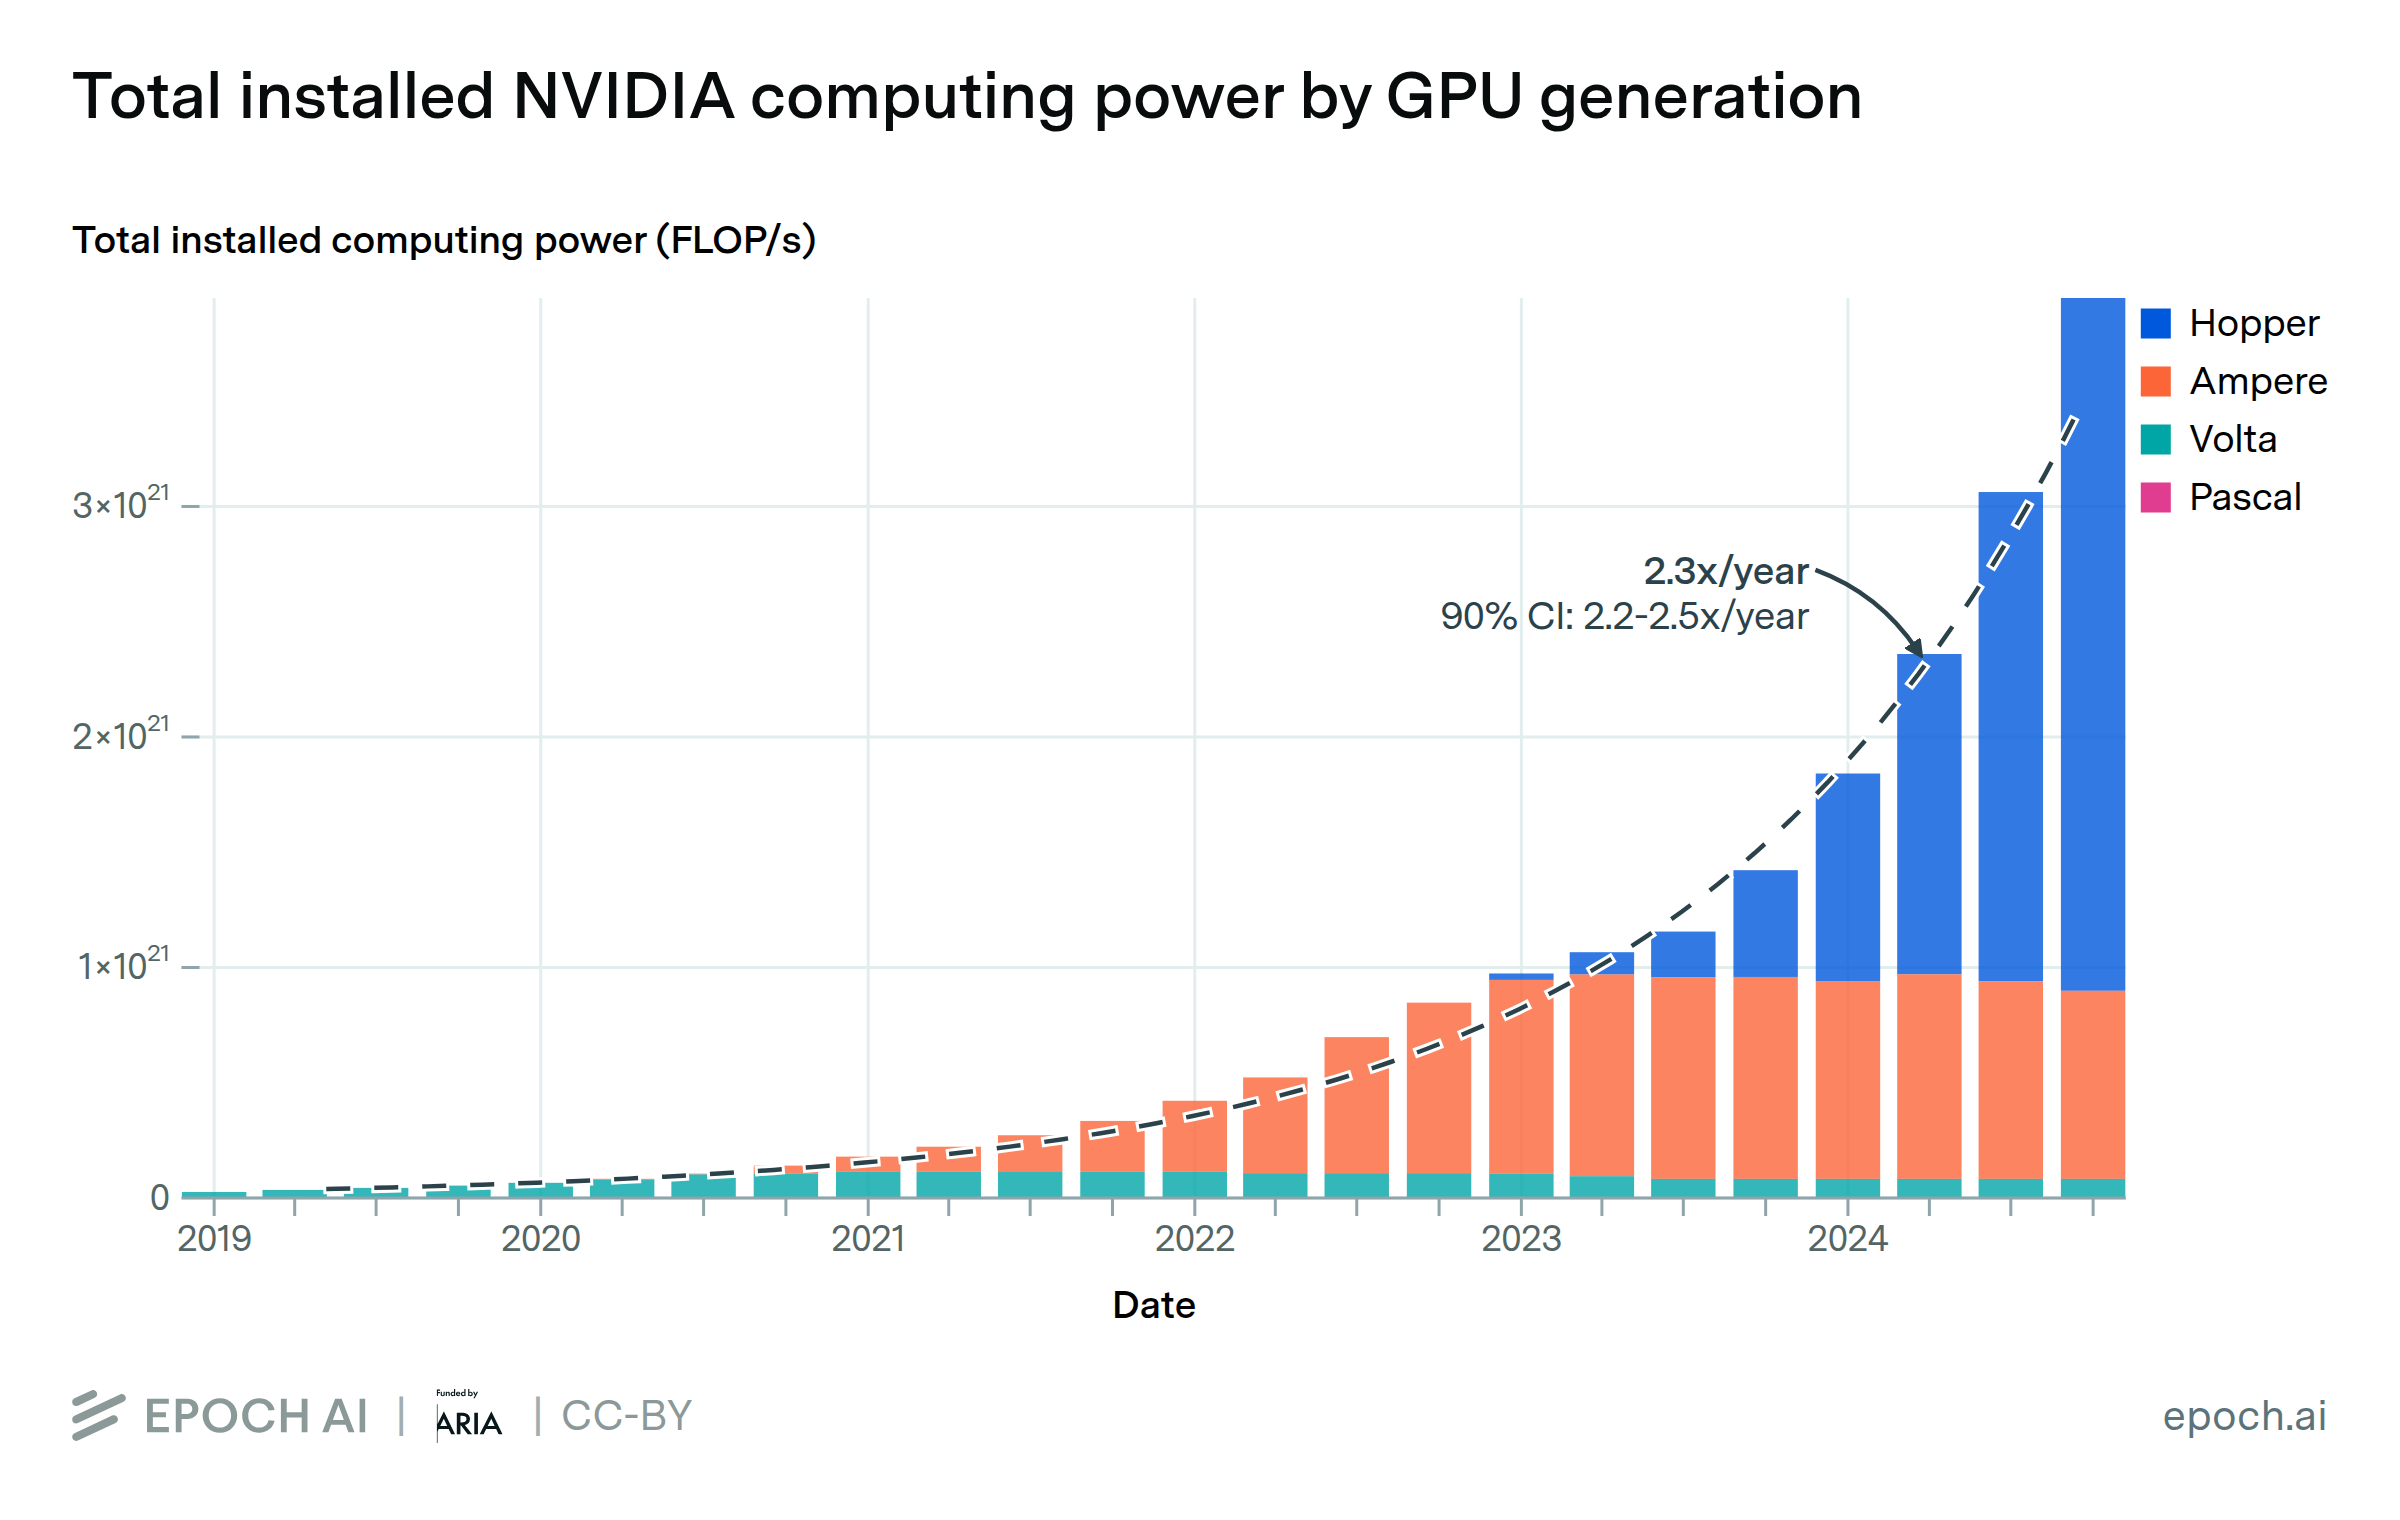
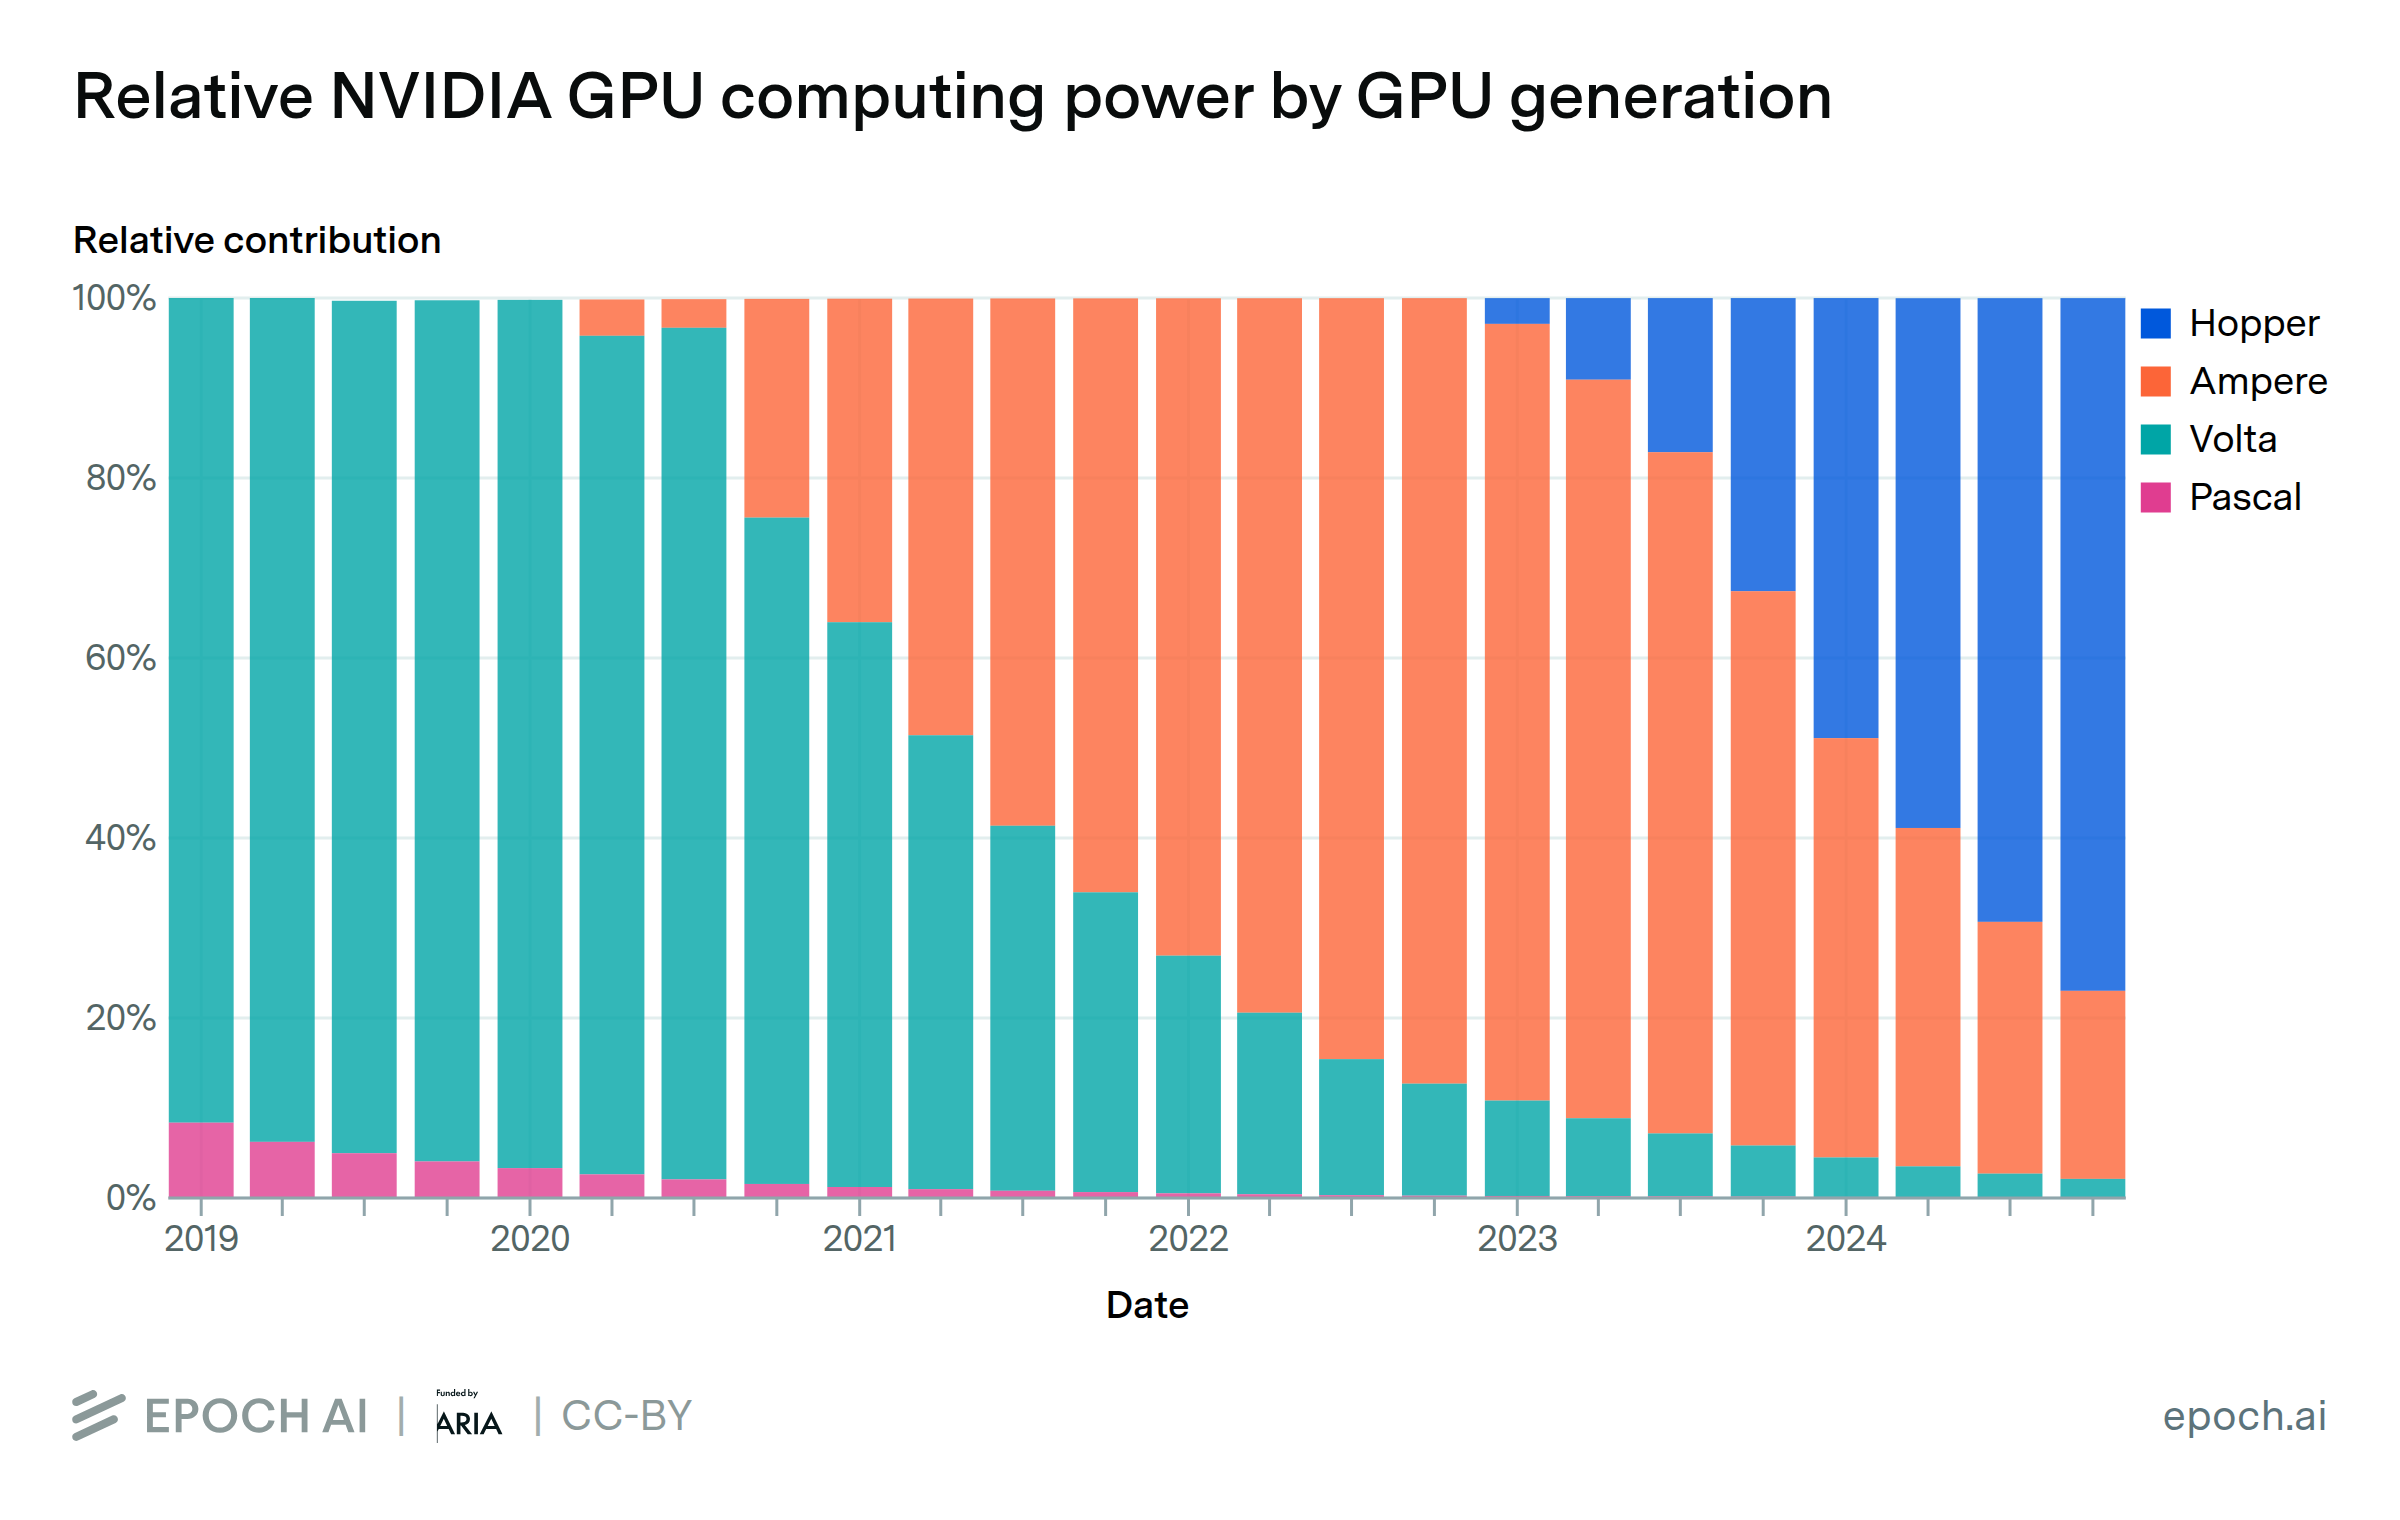
Total available computing power from NVIDIA chips has grown by approximately 2.3x per year since 2019, enabling the training of ever-larger models. The Hopper generation of NVIDIA AI chips currently accounts for 77% of the total computing power across all of their AI hardware. At this pace of growth, older generations tend to contribute less than half of cumulative compute around 4 years after their introduction.
Note this analysis does not include TPUs or other specialized AI accelerators, for which less data is available. TPUs may provide comparable total computing power to NVIDIA chips.
Epoch’s work is free to use, distribute, and reproduce provided the source and authors are credited under the Creative Commons BY license.
Learn more
Overview
We estimate the world’s installed NVIDIA GPU compute capacity, broken down by GPU model. These estimates are based on NVIDIA’s revenue filings, by assuming that the distribution of chip generations over time follows the same pattern as in a dataset of AI clusters. We estimate that there are currently 4e21 FLOP/s of computing power available across NVIDIA GPUs, or approximately 4M H100-equivalents. Additionally, we find that the cumulative sum of computing power (accounting for depreciation) has grown at 2.3x per year since 2019. We consider only data center sales, omitting the computing power available attributable to “Gaming” sales in NVIDIA’s revenue reports.
Data
Machine Learning Hardware Dataset: Epoch’s Machine Learning Hardware dataset provides GPU performance (dense FP16 tensor TFLOP/s) and pricing data. We use dense FP16 tensor performance for hardware with tensor cores, and otherwise use the FP16 CUDA performance.
AI Clusters Dataset (Forthcoming): Epoch’s AI Clusters dataset compiles publicly available information about data centers with AI chips from 2019 onwards. The data also aimed to collect the top 20 largest clusters introduced prior to 2019, which helps to inform the cumulative compute as of 2019. Data collection is focused on data centers with at least 1500 H100-equivalents of computing power. Key columns include date of first operation, GPU model type, and GPU quantity. We drop entries that are missing any of these three columns. In addition, we record cases where data centers are decommissioned or superseded. For example, if a data center’s GPUs are updated with newer models, we record the new configuration in a separate row, and link this row in the original record.
NVIDIA Financial Reports: We use NVIDIA’s financial reports to obtain quarterly data center revenue from 2015Q1 onward. We use these figures to adjust for “missing” data centers that are not captured by the AI Clusters dataset.
Analysis
We perform our main analysis as follows:
-
Identify Monthly GPU Installations
From the AI Clusters dataset, we gather the number of GPUs of each type entering operation each month. When a data center is superseded, its GPU contribution is removed from that point onward. -
Calculate Data Center GPU Spend
We then multiply the number of new GPUs by their estimated price (from the ML Hardware dataset). We depreciate the GPU price from its initial MSRP by 30% per year, testing other values for sensitivity analysis. This yields the directly observed monthly data center spend across GPU models. -
Adjust for Timing
Reported operational dates may lag behind shipment by several months. We therefore shift the revenue series forward by 3 months, so that the spend lines up more closely with the timing of the hardware’s date of first operation. While our estimate of this lag is based on loose priors, our results are not sensitive to lags between 1 and 6 months (see the “Assumptions” section for more details). -
Estimate Missing Clusters
Next, we divide NVIDIA’s quarterly data center revenue by the quarterly spend we observe in the AI Clusters dataset. This ratio indicates the share of total spend not captured in our known data centers—approximately 80% of the total. We multiply our directly observed spending figures by this ratio, using the assumption that missing clusters are distributed proportionally to the GPU shares found in the AI Clusters dataset for each quarter. -
Compute FLOP/s Contributions
For each GPU model, we multiply the estimated number of GPUs sold (after scaling for missing data) by that GPU’s dense FP16 performance in FLOP/s from the ML Hardware dataset. Where available, we use tensor core performance, and otherwise default to CUDA core performance. We produce the final plot by aggregating across all quarters to form a cumulative series of installed GPU compute capacity for each hardware model. -
Deduct FLOP/s from Depreciated GPUs
We eliminate the contributions of GPUs as they depreciate due to hardware failures. For each quarter of data, we calculate the cumulative FLOP/s of GPUs which are believed to have failed based on our assumed distribution of GPU lifespans, and reduce our cumulative total by this amount. Sources disagree on the average lifespan of GPU, with estimates ranging from 3 to 9+ years. As a default assumption, we use 5 years as the geometric mean of these endpoints, with a standard deviation of 1.5 years based on estimates from AI Impacts. We discuss the sensitivity of these figures further in the “Assumptions” section. -
Estimate Trend in Aggregate FLOP/s
Finally, we fit an exponential trend on the total cumulative FLOP/s available over time. To produce a confidence interval, we run a bootstrap exercise (n=500) over our clusters dataset, producing a new cumulative FLOP/s series each time. We find a median slope of 2.3x per year, with a 90% confidence interval of 2.2 - 2.5x. Our median estimate for current cumulative computing power is 3.9e21 FLOP/s, with a 90% confidence interval of 3.6e21 - 4.7e21 FLOP/s.
Assumptions
-
Our clusters dataset attempts to track decommissioned and updated clusters in order to avoid double counting. However, it is more difficult to track hardware clusters that go offline than those that are newly operational, and it is likely that some double counting occurs when secondary market chips appear in new clusters. We believe the overall effect is limited, since cumulative NVIDIA computing power is growing by around 2.3x per year. If the average GPU remains in a data center for 3 years before being sold, the total contribution of second-hand GPU sales is likely to be less than 1 / (2.3^3) = 1/12th of the cumulative total at any given time. Nevertheless, this effect is likely to extend the tail of time in which older generations of GPUs appear to contribute to some degree.
-
Based on periodic reporting (see here and here), we estimate that around 80% of NVIDIA’s data center revenue comes from AI accelerators, with the remainder generated by networking equipment sales. We assume this fraction has remained constant over the analysis period. In reality there are likely to have been fluctuations – notably, NVIDIA acquired the networking company Mellanox for $7B in 2019, which likely contributed to an increased share of networking sales relative to chips. However, we believe the share of data center revenues coming from chips has remained between 70% and 90% throughout the period, so that errors due to our assumption are unlikely to be large in magnitude.
-
We assume that GPU prices fall by 30% each year. This roughly matches anecdotal evidence about the prices of A100s and H100s, which appear to have sold for approximately half their original price two years after release. Our results are not highly sensitive to this assumption; depreciation rates of 10% to 40% result in slopes of 2.3 to 2.4x per year, and cumulative totals of 3e21 to 5e21 FLOP/s.
-
We assume that the time between a GPU’s sale and its first operation in a data center is well modelled by a constant 3 month delay. We ran a sensitivity analysis with delays of 1 and 6 months, and found little impact on our results: the slope of FLOP/s growth remains stable at 2.3-2.4x per year, while cumulative FLOP/s as of 2025Q1 varies between 3e21 and 5e21. Our results are also insensitive to aggregation over longer periods of time, suggesting quarterly aggregation is sufficient to mitigate uncertainty over cluster timing. When aggregated at an annual level, growth is slightly slower (2.1x vs 2.3x per year), and the current level of cumulative FLOP/s is nearly identical (both at 4e21 FLOP/s).
-
We assume that while our AI Clusters dataset may be missing information on some clusters, the distribution across different GPU models is similar for these missing clusters. This allows us to use the shares of each GPU model in the data we have to inform how much of NVIDIA’s quarterly revenue came from each GPU model. While our coverage is likely around 20%, our overall numbers are relatively insensitive to missingness, since we can use NVIDIA’s data center revenues as a source of ground truth. To test our sensitivity to missing data, we drop the largest cluster in each quarter and re-do our analysis. We find a slope of 2.4x FLOP/s per year (rather than 2.3x FLOP/s per year), and estimate the same cumulative computing power from NVIDIA chips as our baseline analysis, at 4e21 FLOP/s.
-
We model hardware failures by assuming a normally distributed lifespan with a mean of 5 years and a standard deviation of 1.5 years. This is chosen as the geometric midpoint of two papers with differing results on GPU failures. Ostrouchov et al. (2017) observe a cluster of 18,688 NVIDIA Titan GPUs over six years, and report a mean time between failures (MTBF) of 2.9 years per GPU. Grattafiori et al. (2024) report 268 GPU-related failures during the training of Llama 3.1-405B, over the course of 54 days of training on 16,384 NVIDIA H100s. That works out to a MTBF of around 9 years per GPU. In both cases, the failures are not necessarily catastrophic, so these represent lower bound estimates of datacenter GPU lifespans. To test the sensitivity of our assumption, we re-run our analysis using distributions with means of 3 years and 9 years, using a standard deviation of 1.5 years in each case. Results are highly similar in both cases, with a slope of 2.3x per year in both cases, and a cumulative total of 3e21 and 4e21 FLOP/s for the 3 and 9 year mean lifespan, respectively.
-
In our figure, we drop hardware models with less than 1e18 FLOP/s of cumulative compute power as of 2024 Q4, as they are practically irrelevant during the plotted period. Outside of the chips included in the plot, NVIDIA’s most significant contributor to total FLOP/s was the L40 chip, which accounted for less than 0.01% in 2024 Q4. Blackwell series GPUs do not yet appear in our data, but recent reports indicate that they are beginning to enter data center operations as of early 2025.
Code for our analysis is available in this notebook.
This data insight was Funded by the Advanced Research + Invention Agency (ARIA)