Chinese language models have scaled up more slowly than their global counterparts

The training compute of top Chinese language models grew rapidly after 2019, catching up to the top models globally by late 2021. Since then, China’s rate of scaling has fallen behind. The top 10 Chinese language models by training compute have scaled up by about 3x per year since late 2021, which is slower than the 5x per year trend maintained elsewhere since 2018. At China’s current rate, it would take about two years to reach where the global top models are today.

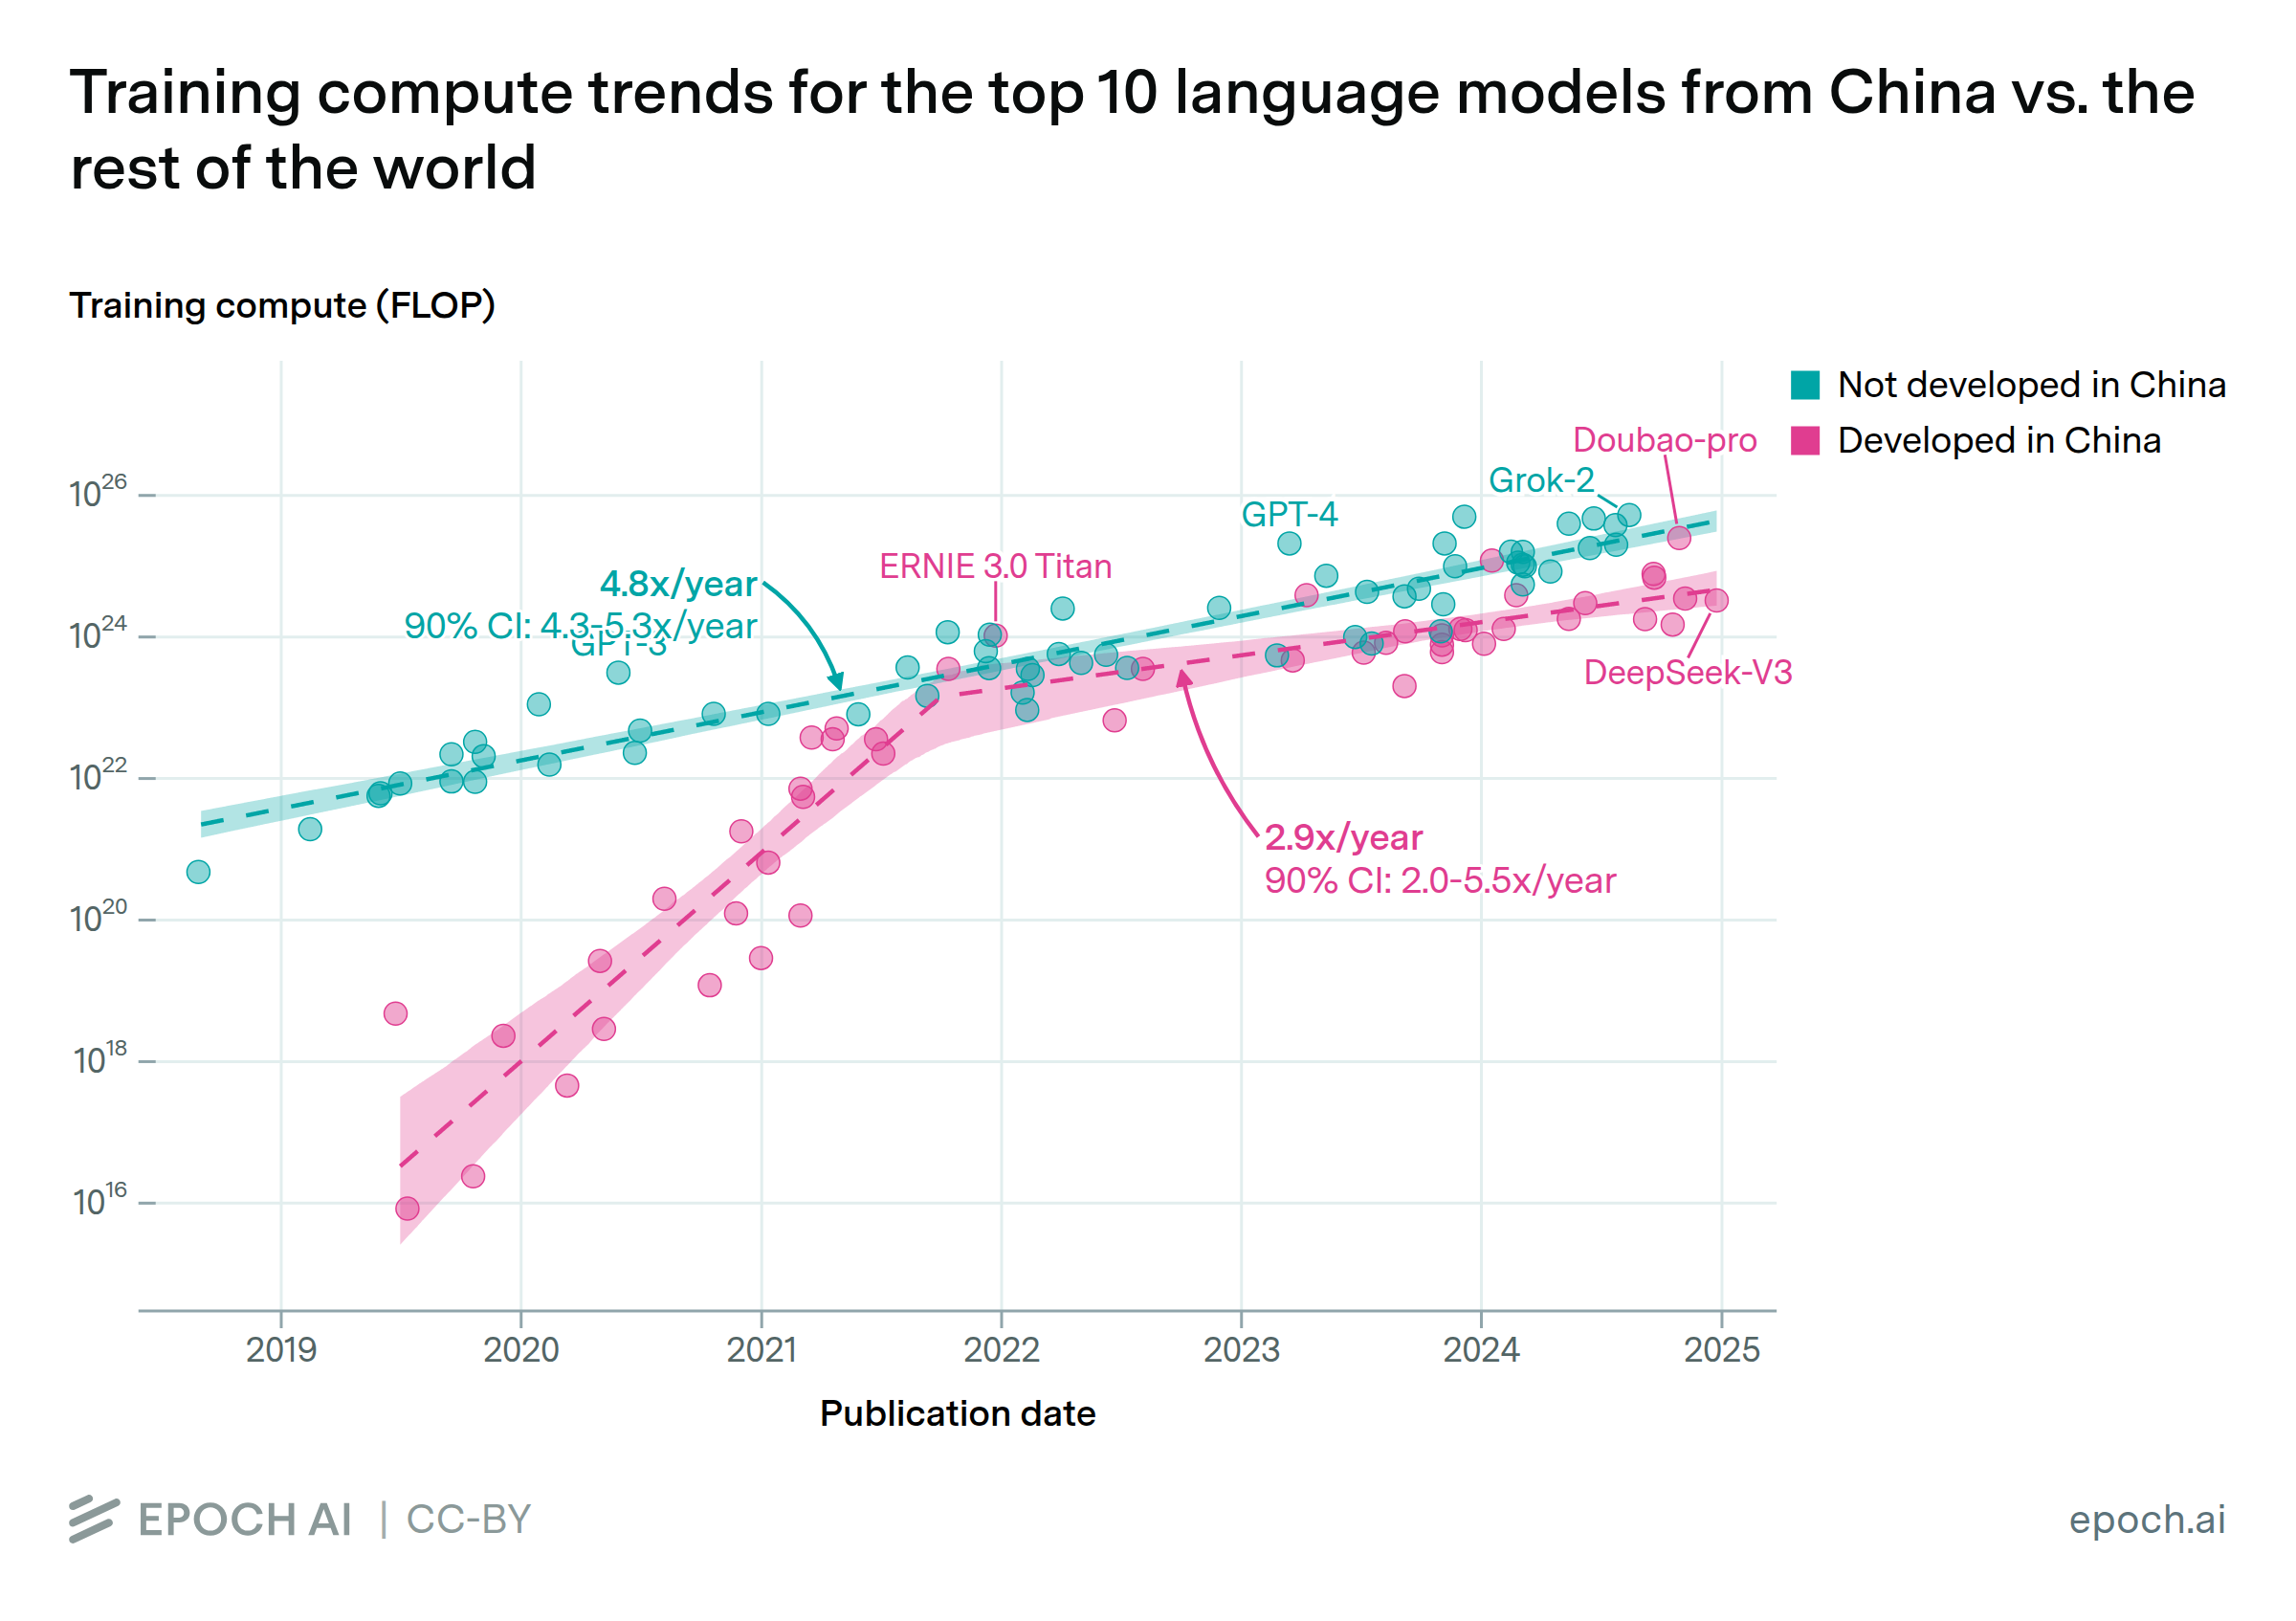
The difference looks less dramatic when comparing just the largest known models from each region. Grok-2, the largest known US model, used twice the training compute of China’s largest known model Doubao-pro, released 3 months later. Given China’s current scaling rate of 3x per year, it would take 8 months to scale from Doubao-pro to Grok-2’s level of compute.

Published

January 22, 2025

Last updated

January 22, 2025

Epoch’s work is free to use, distribute, and reproduce provided the source and authors are credited under the Creative Commons BY license.

Learn more

Overview

We labeled models in our database of AI models as “Developed in China” if at least one of the organizations developing the model was headquartered inside the People’s Republic of China, and “Not developed in China” otherwise. The “Developed in China” and “Not developed in China” sets of models were each narrowed down to the rolling top 10 by training compute, to focus on the frontier of scaling in each region. We then filtered to models in the Language or Multimodal domain, and to models released since 2018, to focus on “LLMs” as they are typically understood. The trendlines in the figure are the best overall fit after searching over breakpoints in a two-segment, log-linear regression model.

Data

Our data comes from Epoch AI’s AI Models dataset, a superset of our Notable Models dataset which removes the notability requirement. This allowed us to accurately describe the compute trend in models from China, which have been less likely to be notable historically. We used a snapshot of the dataset from 7th January 2025. For each model, the dataset has a corresponding publication date, training compute quantity, and country of affiliation, among other fields.

Our data initially lacked training compute estimates for some models of particular interest, such as GPT-4o and Claude 3.5 Sonnet. We estimated the training compute of these models (11 in total) by imputing from benchmark scores. These compute estimates are not in the original dataset because they are more speculative than most other estimates. However, by covering these important models, we believe the estimates lead to a higher-quality analysis overall. In this case, adding these estimates did not noticeably change the bottom-line results.

Before filtering our data, there are 2361 models. We dropped models with a missing publication date or training compute (after imputing training compute for 11 models of particular interest as noted above), leaving 2233 models. We then categorized the models as described in the Overview, with 485 models “Developed in China” and 1748 “Not developed in China”. Following previous work, we considered AlphaGo Master and AlphaGo Zero to be outliers, excluding them from the data. To avoid duplicating training compute data, we also filtered out models that were finetuned separately from another model, such as Med-PaLM.

After removing separately fine-tuned models, we filtered to the rolling top-10 models in each country category. Finally, we filtered the rolling top-10 models down to the “Language” or “Multimodal” domain. These two filtering steps were applied in this order to focus on language models that are close to the overall frontier of training compute. The main effect of this ordering is to leave out language models prior to 2020 that were still catching up to the frontier, as observed in previous work. After this filtering, we were left with 49 models “Developed in China”, and 60 models “Not developed in China”.

The Epoch AI data team has made a focused effort to increase coverage of models developed in China, but coverage may still be worse for these models. While it is more difficult for the team to discover models through Chinese language documents and websites, we believe coverage issues are limited when tracking frontier models.

Analysis

Our analysis is concerned with the frontier of scaling in each group of countries. We used the rolling top 10 models (rather than e.g. the top 1) to balance this goal with reliable statistical analysis, since using the rolling top 1 model would provide a very limited dataset. The scaling trends are not highly sensitive to this choice: top 1 models have a scaling rate of 3.1x/year in China and 4.2x/year outside China since late 2021, compared to 2.9x/year and 4.8x/year respectively.

To determine the best fit lines, we ran a log-linear regression on each category of models. We evaluated segmented regression models which allowed either zero or one breakpoints, with or without a discontinuity at the breakpoint. For models with a discontinuity, we rejected negative jumps, because they were not a plausible description of compute scaling at the frontier. For each model type, we tested all allowed breakpoints at a monthly resolution, for line segments that span at least 10 data points. (The minimum number of data points per segment is somewhat arbitrary—if set to 5, the preferred fit for the non-Chinese data changes to allow a breakpoint in late 2019, and the slope thereafter is 4.4x/year rather than 4.8x/year.) After testing breakpoints, we selected the breakpoint which minimized the Bayesian information criterion (BIC). To estimate confidence intervals in the results, we bootstrapped this entire process for 1000 iterations.

After evaluating each regression model type, we chose the model type which minimized BIC. We made an exception to this if BIC values differed by less than 2: if so, we chose the model with the lowest mean-squared error (MSE) from a 10-fold cross-validation. If the MSE values differed by less than 5%, we chose the model with the fewest parameters.

For the “Developed in China” category, the chosen model type had one breakpoint in October 2021 without a discontinuity, while for the “Not developed in China” category, the chosen model type had zero breakpoints. If we just chose the model with the lowest BIC value, the Chinese trend instead had a discontinuity at April 2021 and a subsequent slope of 3.5x/year, rather than 2.9x/year. The non-Chinese trend instead had a breakpoint in December 2019 and a subsequent slope of 4.3x/year, rather than 4.8x/year. If the 3.5x/year trend for Chinese models continued, it would take about 1.5 years to reach where the non-Chinese trend is today, rather than 2 years. In the figure, we show the lines of best fit, with bootstrapped 90% confidence intervals shaded. The confidence intervals labeled in text come from the same bootstrap.

Code for our analysis is available at Github