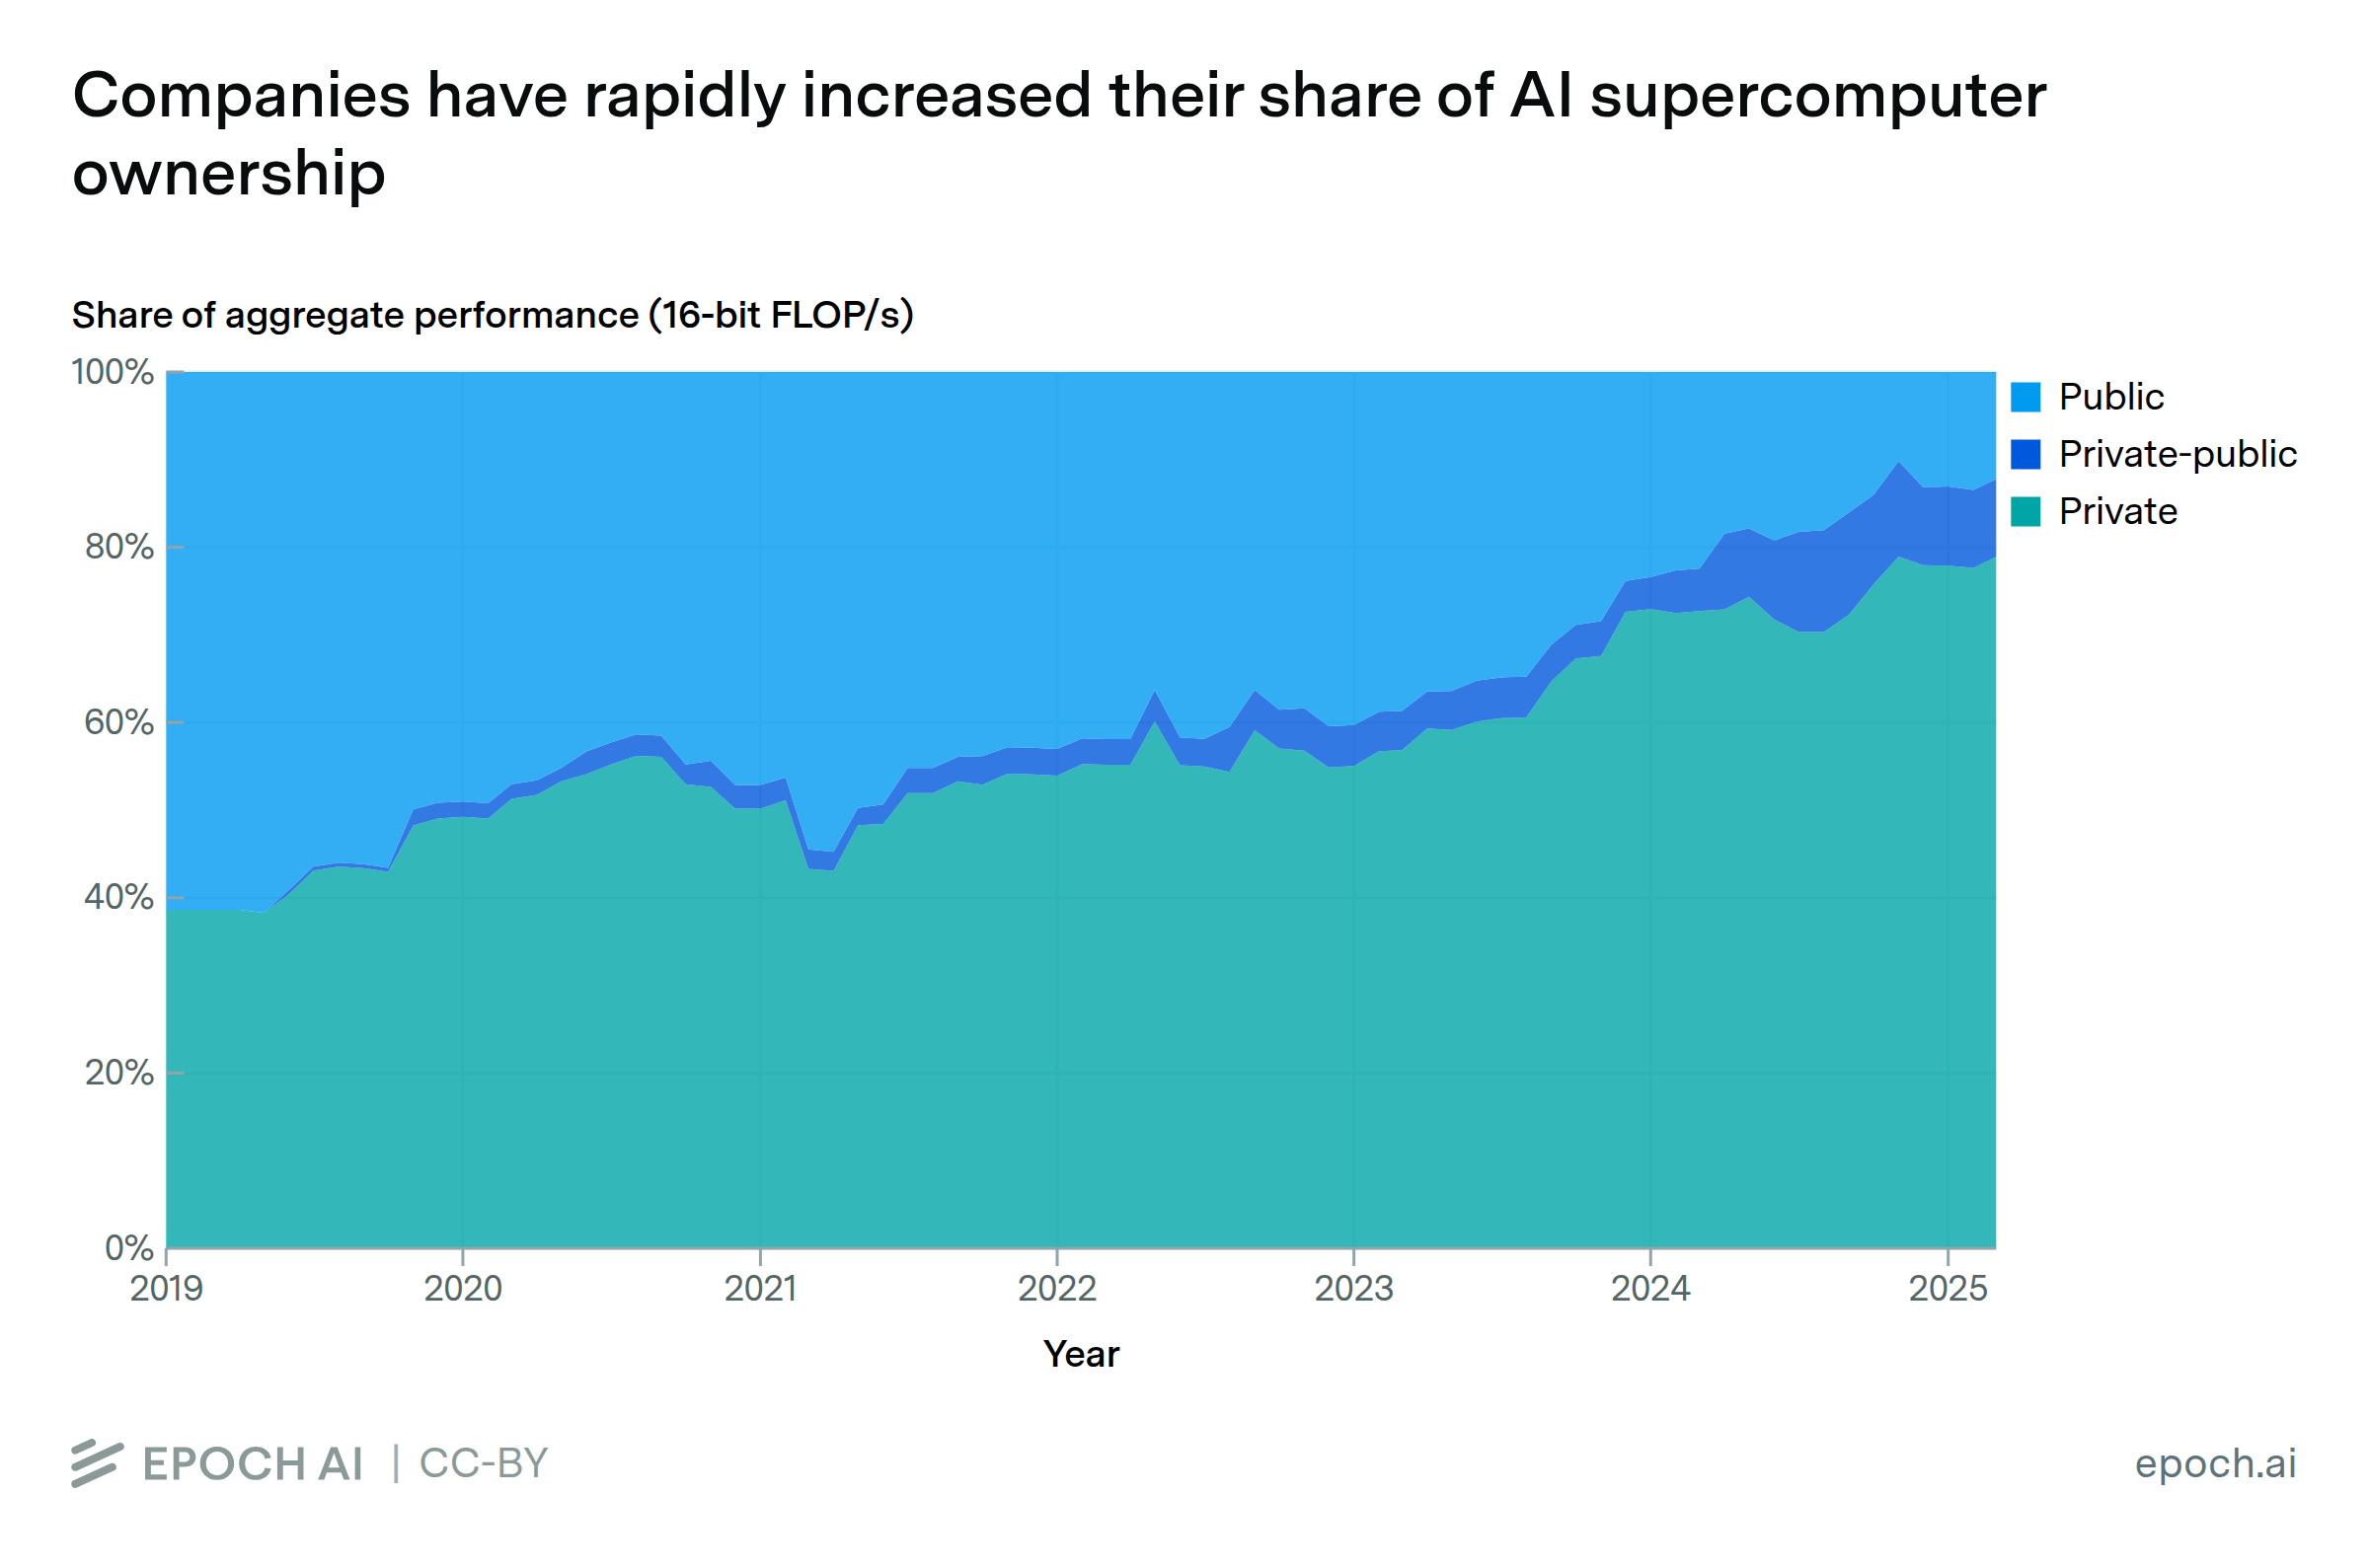


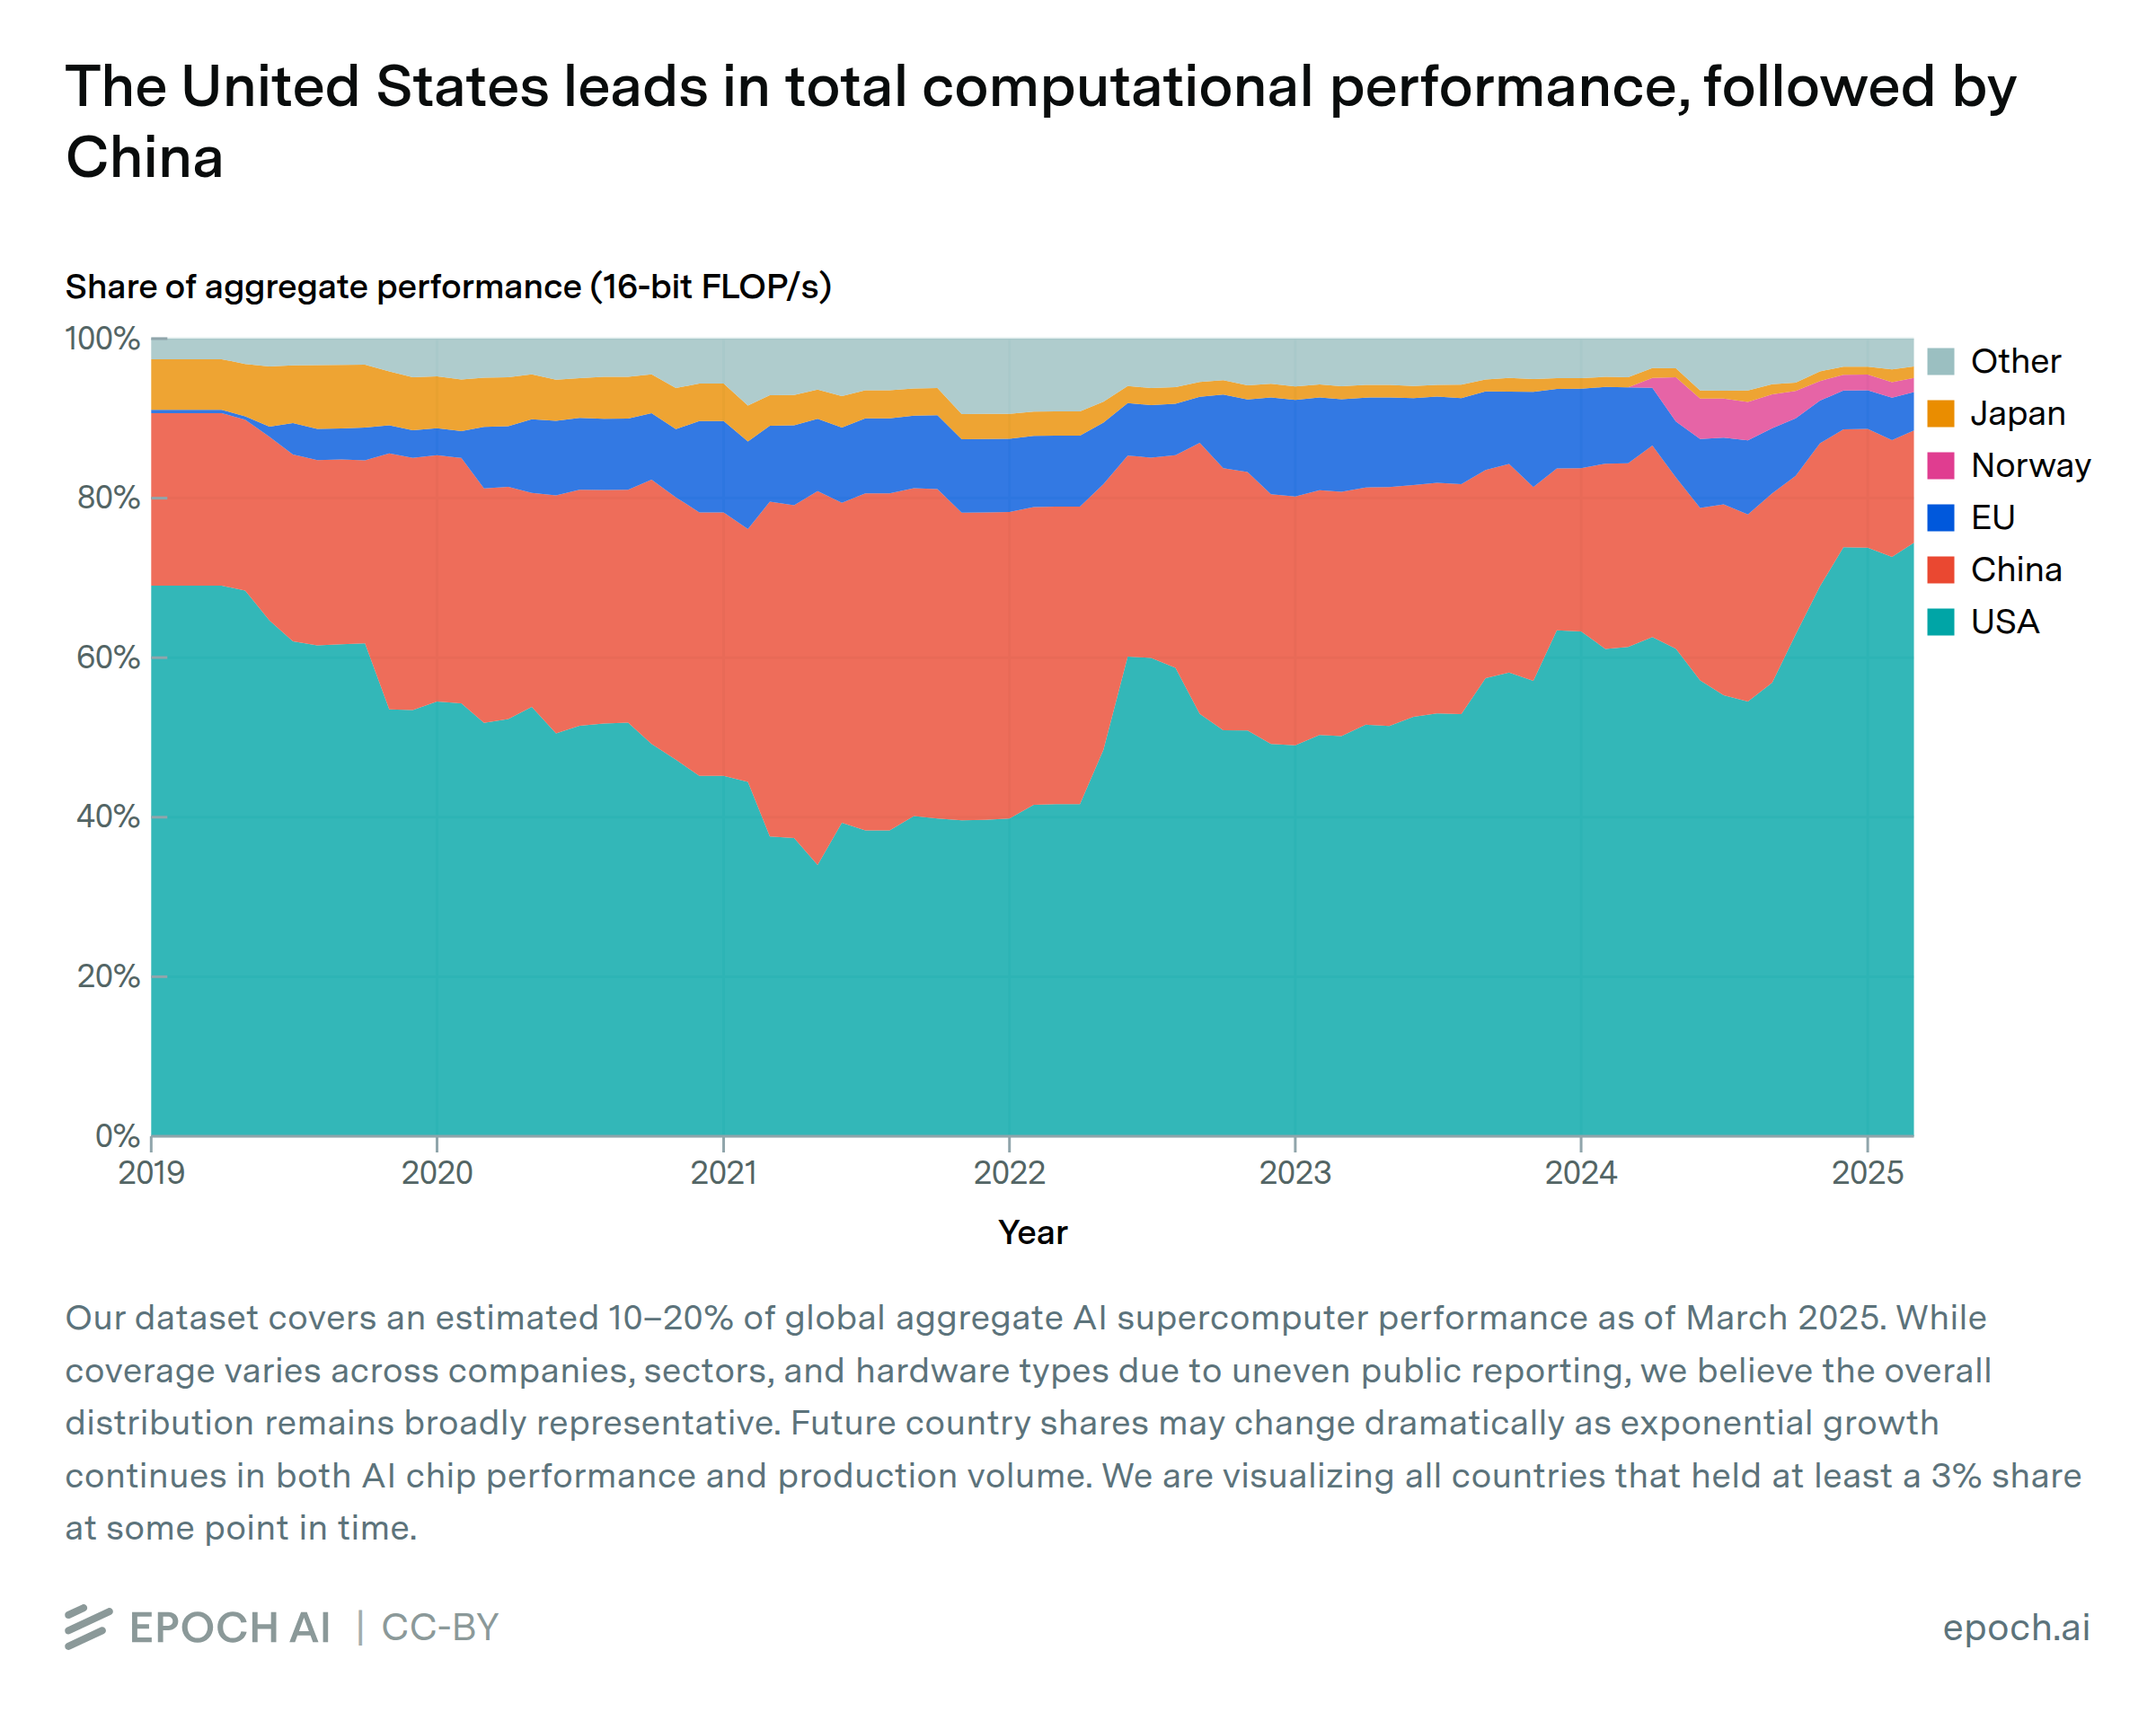
As of May 2025, the United States contains about three-quarters of global GPU cluster performance, with China in second place with 15%. Meanwhile, traditional high-performance computing leaders like Germany, Japan, and France now play marginal roles in the AI cluster landscape. This shift largely reflects the increased dominance of major technology companies, which are predominantly based in the United States.
Epoch's work is free to use, distribute, and reproduce provided the source and authors are credited under the Creative Commons BY license.
Learn more about this graph
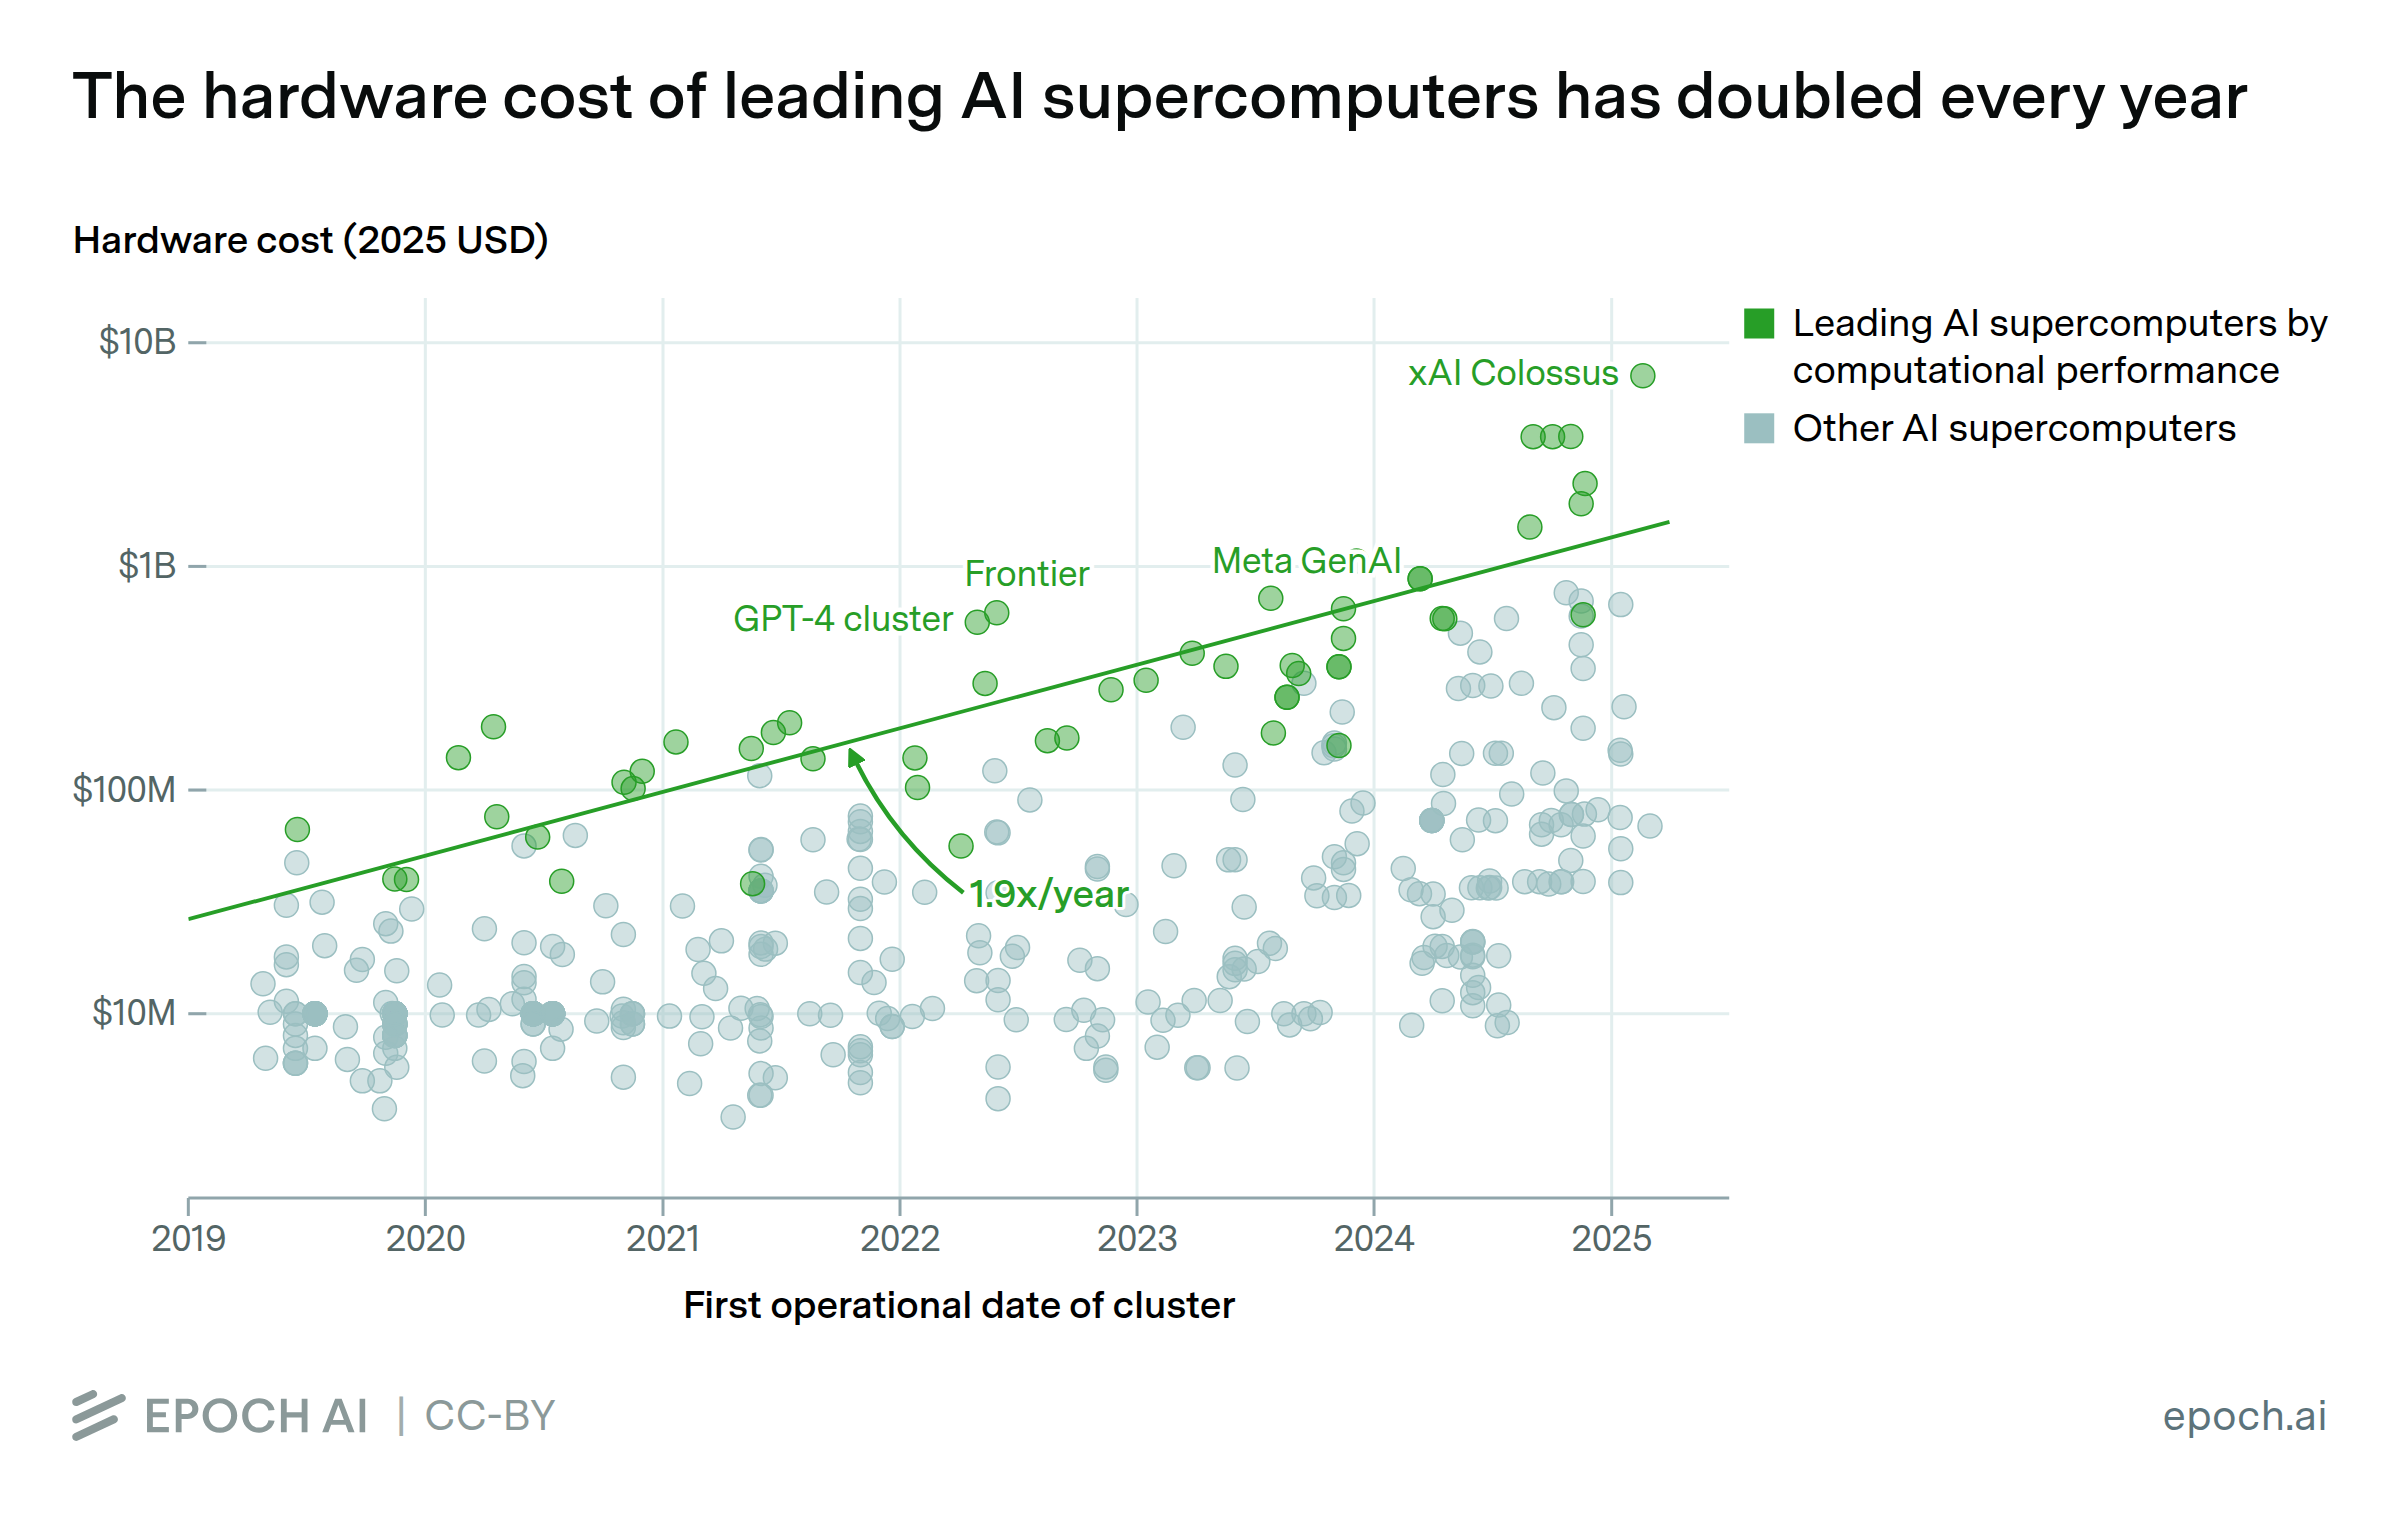
Data come from our GPU Clusters dataset, which collects information on 728 clusters with dedicated AI accelerators, spanning from 2010 to the present. As of March 2025, we estimate that our dataset contained 10–20% of all AI compute produced before 2025. We focus on the 501 AI clusters which became operational in 2019 or later, since these are most relevant to modern AI training.
While collecting data on each cluster, we record as specific a location as possible, based on its location reported in official announcements or third-party coverage. 95% of clusters have their location recorded to at least the level of their country, while 74% have more specific location data. We also record their computational performance rate (measured in FLOP/s or OP/s) in 32-, 16-, and 8-bit arithmetic formats as reported or calculated from the constituent chips.
For more information about the data, see Pilz et. al., 2025, which describes the AI clusters dataset and analyzes key trends, and the dataset documentation.
Analysis
Assumptions and Limitations
Explore this data

Over 500 GPU clusters and supercomputers, including those used for AI training and inference.
Related insights