How to measure FLOP for neural networks empirically?
Computing the utilization rate for multiple Neural Network architectures.
Published
Experiments and text by Marius Hobbhahn. I would like to thank Jaime Sevilla, Jean-Stanislas Denain, Tamay Besiroglu, Lennart Heim, and Anson Ho for their feedback and support.
Summary
We measure the utilization rate of a Tesla P100 GPU for training different ML models. Most architectures and methods result in a utilization rate between 0.3 and 0.75. However, two architectures result in implausible low utilization rates of lower than 0.04. The most probable explanation for these outliers is that FLOP for inverted bottleneck layers are not counted correctly by the profiler. In general, the profiler we use shows signs of under- and overcounting and there is a possibility we made errors.
Findings
- Counting the FLOP for a forward pass is very simple and many different packages give correct answers.
- Counting the FLOP for the backward pass is harder and our estimator of choice makes weird overcounting and undercounting errors.
- After cleaning mistakes, it is very likely that the backward/forward ratio is 2:1 (at least for our setup).
- After correcting for the overcounting issues, we get empirical utilization rates between 0.3 and 0.75 for most architectures. Theoretical predictions and empirical measurements seem very consistent for larger batch sizes.
Introduction
In the “Parameter, Compute and Data Trends in Machine Learning” project we wanted to estimate GPU utilization rates for different Neural Networks and GPUs. While this sounds very easy in theory, it turned out to be hard in practice.
Utilization rate = empirical performance / peak performance
The post contains a lot of technical jargon. If you are just here for the results, skip to the Analysis section.
I don’t have any prior experience in estimating FLOP. It is very possible that I made rookie mistakes. Help and suggestions are appreciated.
Other work on computing and measuring FLOP can be found in Lennart Heim’s sequences Transformative AI and Compute. It’s really good.
Methods for counting FLOP
In this post, we use FLOP to denote floating-point operations and FLOP/s to mean FLOP per second.
We can look up the peak FLOP/s performance of any GPU by checking its datasheet (see e.g. NVIDIA’s Tesla P100). To compare our empirical performance to the theoretical maximum, we need to measure the number of FLOP and time for one training run. This is where things get confusing.
Packages such as PyTorch’s fvcore, ptflops or pthflops hook onto your model and compute the FLOP for one forward pass for a given input. However, they can’t estimate the FLOP for a backward pass. Given that we want to compute the utilization rate for the entire training, accurate estimates of FLOP for the backward pass are important.
PyTorch also provides a list of packages called profilers, e.g. in the main package and autograd. The profilers hook onto your model and measure certain quantities at runtime, e.g. CPU time, GPU time, FLOP, etc. The profiler can return aggregate statistics or individual statistics for every single operation within the training period. Unfortunately, these two profilers seem to not count the backward pass either.
NVIDIA offers an alternative way of using the profiler with Nsight Systems that supposedly estimates FLOP for forward and backward pass accurately. This would suffice for all of our purposes. Unfortunately, we encountered problems with the estimates from this method. It shows signs of over- and undercounting operations. While we could partly fix these issues post-hoc, there is still room for errors in the resulting estimates.
NVIDIA also offers a profiler called dlprof. However, we weren’t able to run it in Google Colab (see appendix).
Our experimental setup
We try to estimate the empirical utilization rates of 13 different conventional neural network classification architectures (resnet18, resnet34, resnet50, resnet101, resnet152, vgg11, vgg13, vgg16, vgg19, wide_resnet50_2, alexnet, mobilenet_v2, efficientnet_b0) with different batch sizes for some of them. For all experiments, we use the Tesla P100 GPU which seems to be the default for Google Colab. All experiments have been done in Google Colab and can be reproduced here.
We estimate the FLOP for a forward pass with fvcore, ptflops, pthflops and the PyTorch profiler. Furthermore, we compare them to the FLOP for forward and backward pass estimated by the profiler + nsight systems method (which we name profiler_nvtx). We measure the time for all computations once with the profiler and additionally with profiler_nvtx to get comparisons.
One problem for the estimation of FLOP is that fvcore, ptflops and pthflops seem to count a Fused Multiply Add (FMA) as one operation while the profiler methods count it as 2. Since basically all operations in NNs are FMAs that means we can just divide all profiler estimates by 2. We already applied this division to all estimates, so you don’t have to do it mentally. However, this is one potential source for errors since some operations might not be FMAs.
Furthermore, it is not 100 percent clear which FMA convention was used for the peak performance. On their website, NVIDIA states “The peak single-precision floating-point performance of a CUDA device is defined as the number of CUDA Cores times the graphics clock frequency multiplied by two. The factor of two stems from the ability to execute two operations at once using fused multiply-add (FFMA) instructions”.
We interpret this statement to mean that NVIDIA used the FMA=2FLOP assumption. However, PyTorch automatically transforms all single-precision tensors to half-precision during training. Therefore, we get a speedup factor of 2 (which cancels the FMA=2FLOP)
For all experiments, we use input data of sizes 3x224x224 with 10 classes. This is similar to many common image classification setups. We either measure on single random batches of different sizes or on the test set of CIFAR10 containing 10000 images.
Analysis
Something is fishy with profiler_nvtx
To understand the estimates for the profiler_nvtx better, we run just one single forward and backward pass with different batch sizes. If we compare the profiler_nvtx FLOP estimates for one forward pass on a random batch of size one, we see that they sometimes don’t align with all other estimates.

The first four methods basically always yield very comparable estimates and just profiler_nvtx sometimes undercounts quite drastically.
But it gets worse —profiler_nvtx is inconsistent with its counting. We expected the number of FLOP for a batch size of 64 to be 64 times as large as for a batch size of 1, and the number of FLOP for a batch size of 128 to be 128 times as large as for a batch size of 1. However, this is not the case for both the forward and backward pass.
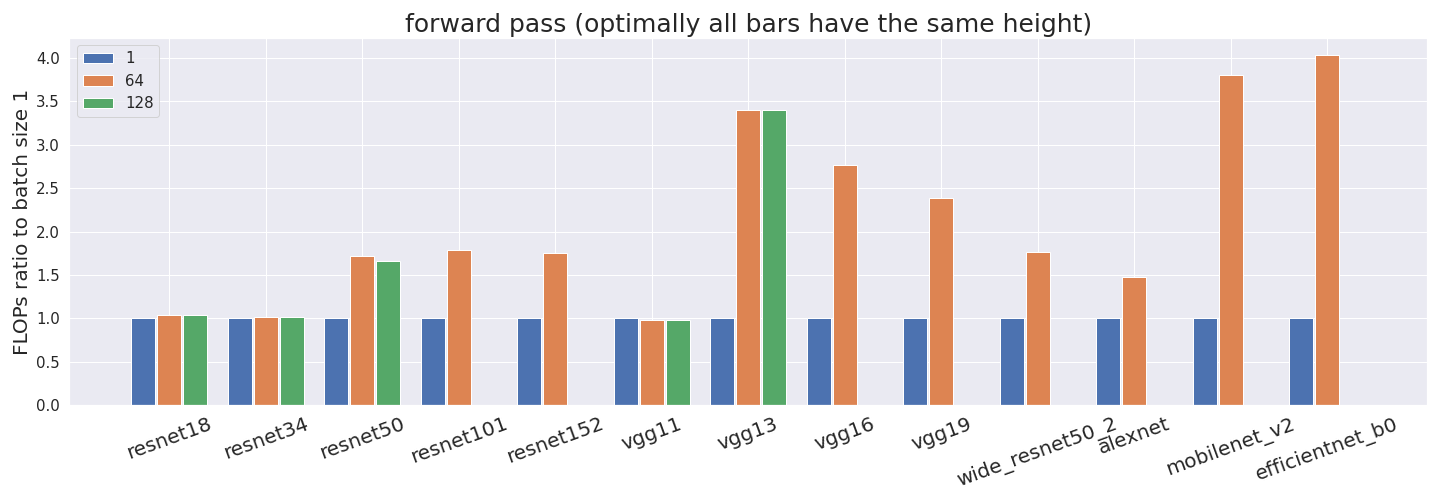
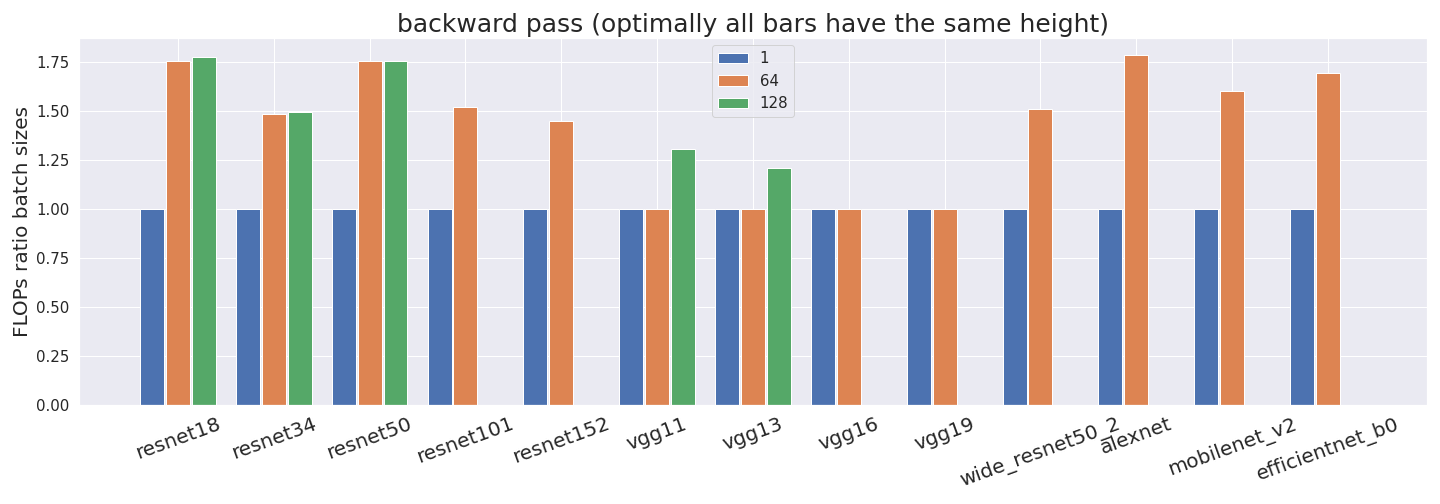
All FLOP estimates have been normalized by the batch size. Thus, if our profiler counted correctly, all bars would have exactly the same height. This is not what we observe in some networks, which suggests that something is off. Some networks don’t have estimates for a batch size of 128 since it didn’t fit into the GPU memory.
To check whether profiler_nvtx is over- or undercounting we investigate it further.
Investigating profiler_nvtx further
Since the problems from above cause all analyses to be very uncertain, we try to find out what exactly is wrong and if we can fix it in the following section. If you don’t care about that, skip to the Results section.
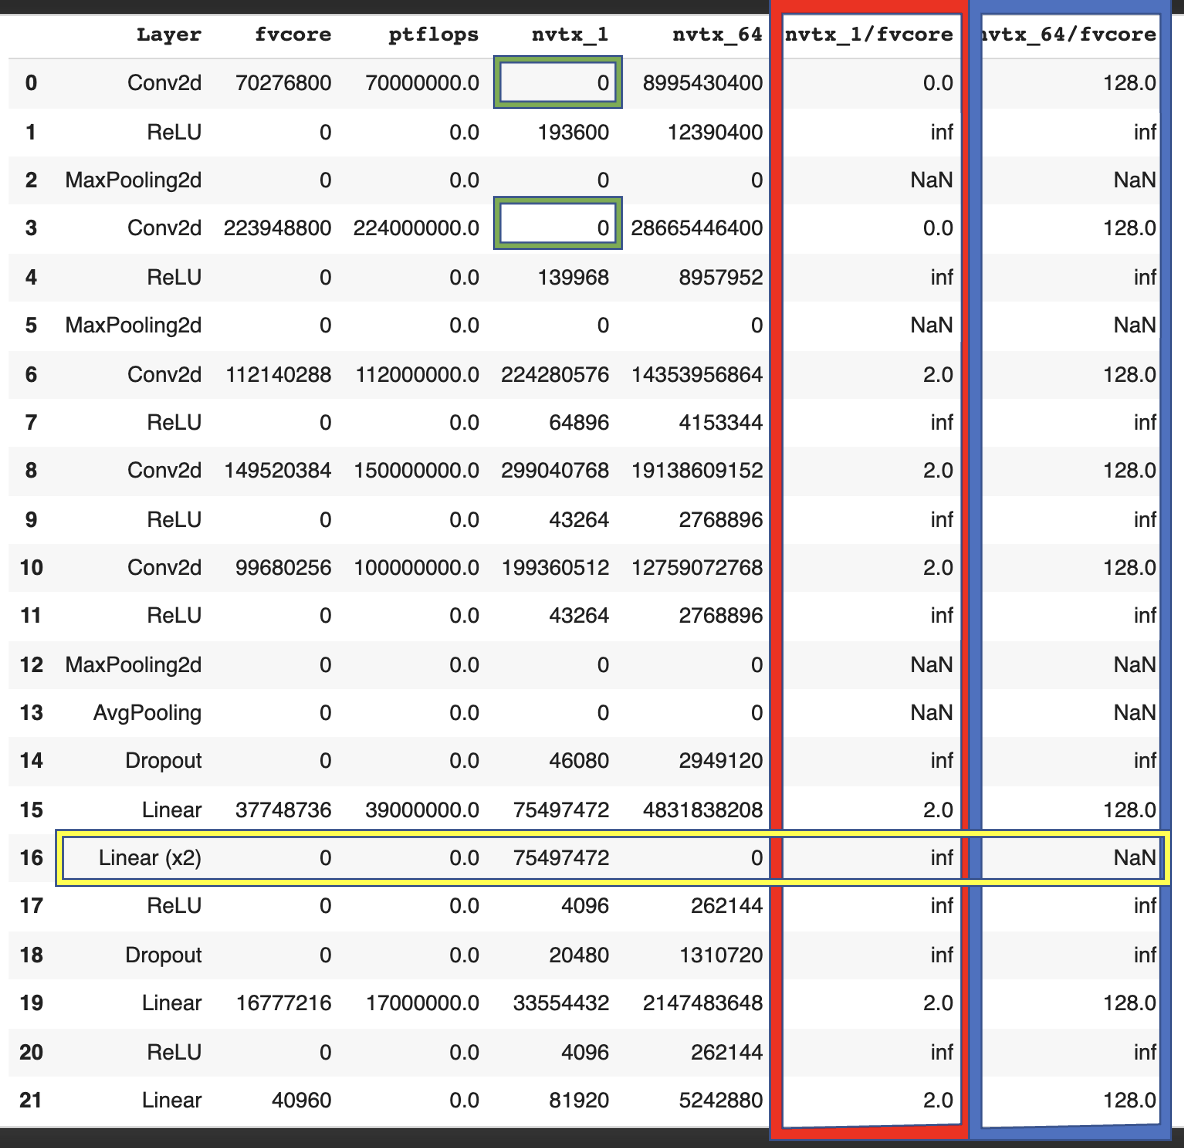
If we compare the counted FLOP by operation, e.g. on alexnet, we make multiple discoveries.
- FMAs: We find that profiler_nvtx counts exactly 2x as many FLOP as fvcore (red in table) since profiler_nvtx counts FMAs as 2 and fvcore as 1 FLOP. For the same reason, profiler_nvtx counts 128 as many operations when we use a batch size of 64 (blue in table).
- Undercounting: In some cases (green in table) profiler_nvtx just doesn’t register an operation and therefore counts 0 FLOP.
- Overcounting: In other cases (yellow in table), profiler_nvtx counts the same operation multiple times for no apparent reason.
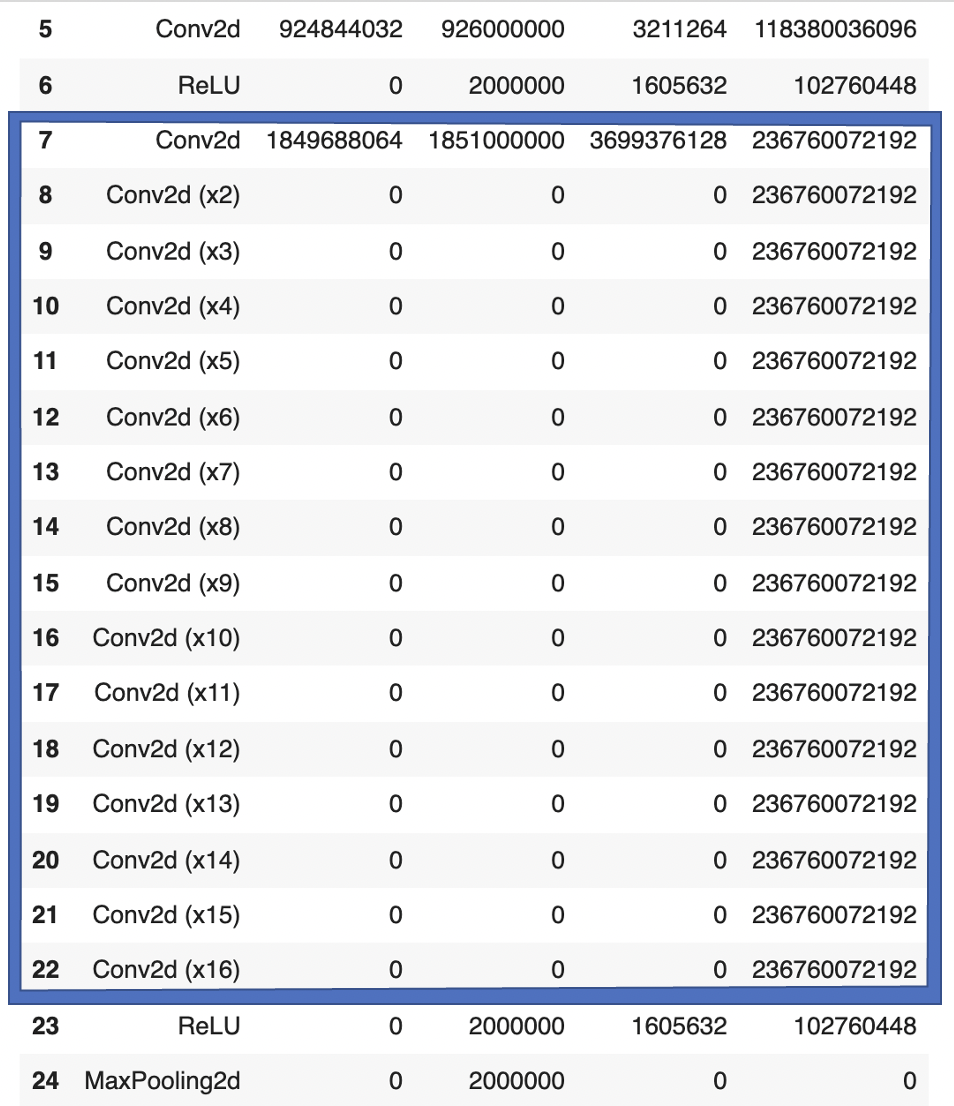
This double-counting can happen in more extreme versions. In the forward pass of VGG13, for example, profiler_nvtx counts a single operation 16 times. That is 15 times too often. Obviously, this distorts the results.
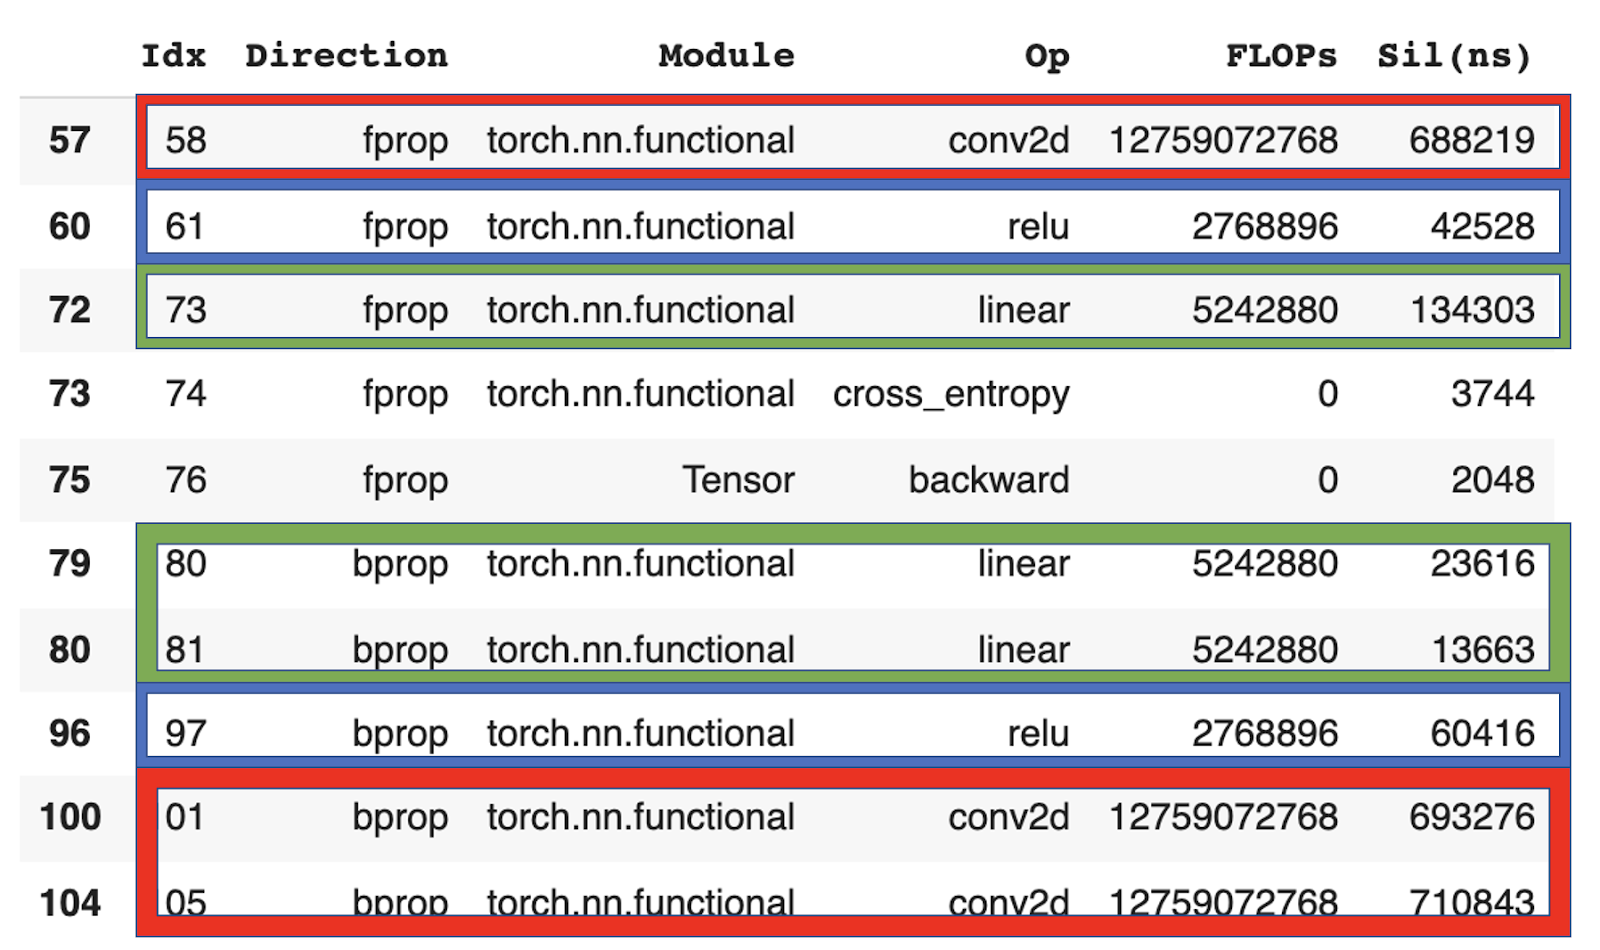
Furthermore, we can check the empirical backward/ forward ratios from profiler_nvtx in detail. We find that
- Operations like conv2d and linear have a backward/forward ratio of 2:1.
- Operations like relu, dropout, maxpooling, avgpooling have a backward/forward ratio of 1:1.
Since the vast majority of operations during training come from conv2d and linear layers, the overall ratio is therefore very close to 2:1.
To account for the double-counting mistakes from above, we cleaned up the original files and deleted all entries that mistakenly double-counted an operation. Note that we couldn’t fix the undercounting issue so the following numbers still contain undercounts sometimes.
After fixing the double-counting issue we get slightly more consistent results for different batch sizes.
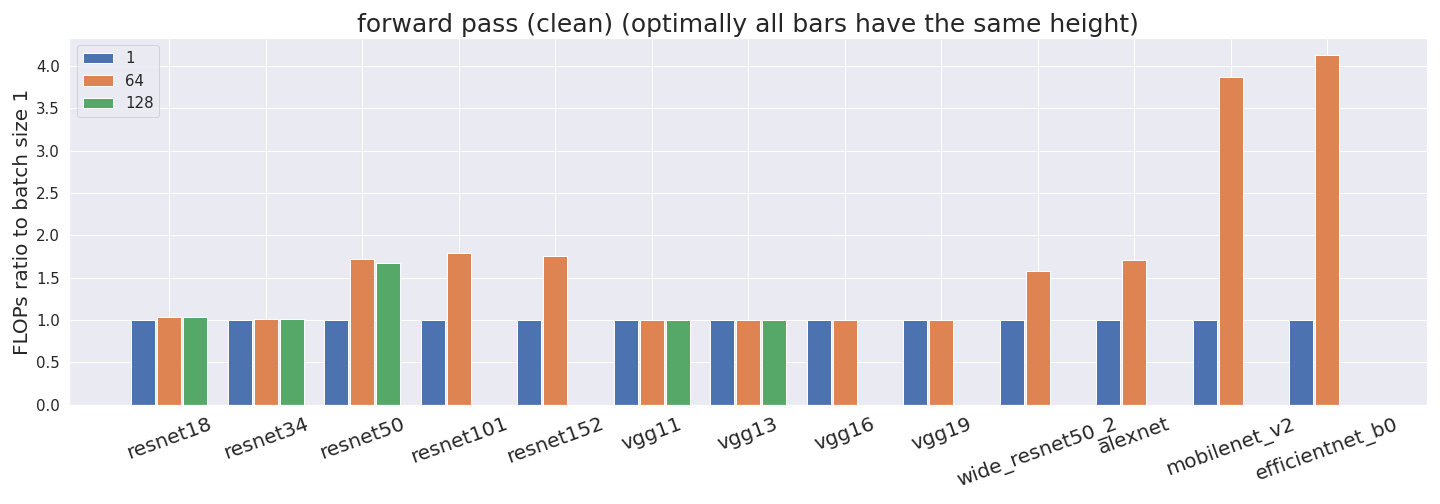
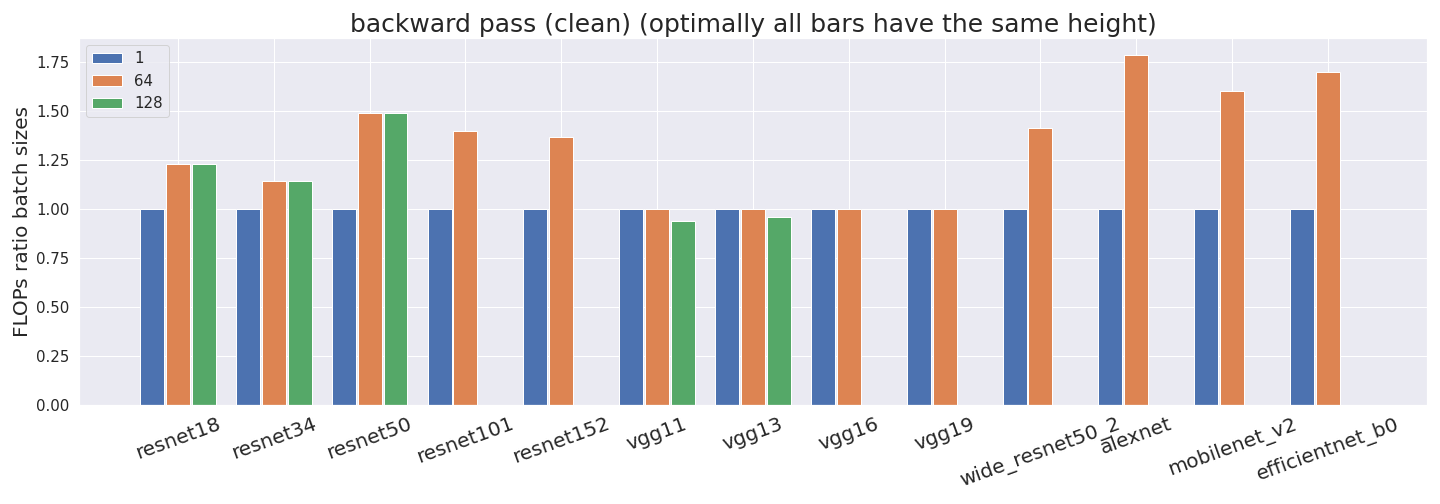
All remaining inconsistencies come from undercounting.
Results
The following results are done on the cleaned version of the profiler data, i.e. double counting has been removed but undercounting still poses an issue.
The same analysis for the original (uncleaned) data can be found in the appendix.
Comparing batch sizes
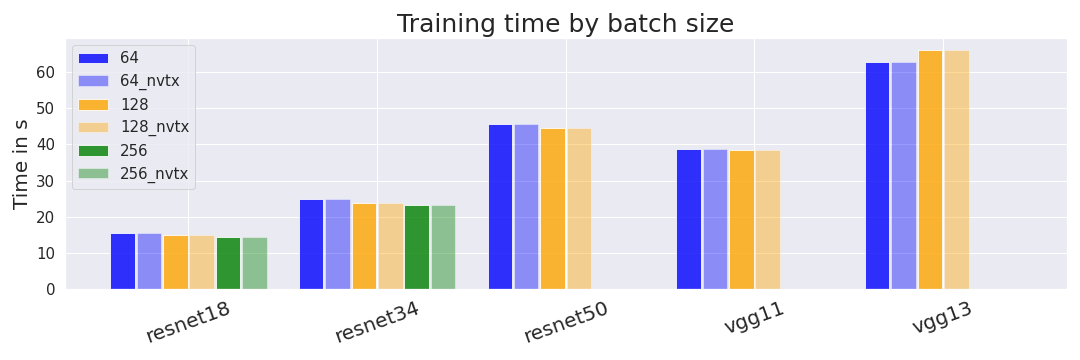
We trained some of our models with different batch sizes. We are interested in whether different batch sizes affect the time it takes to train models. We additionally compare the timings from the conventional profiler and profiler_nvtx.
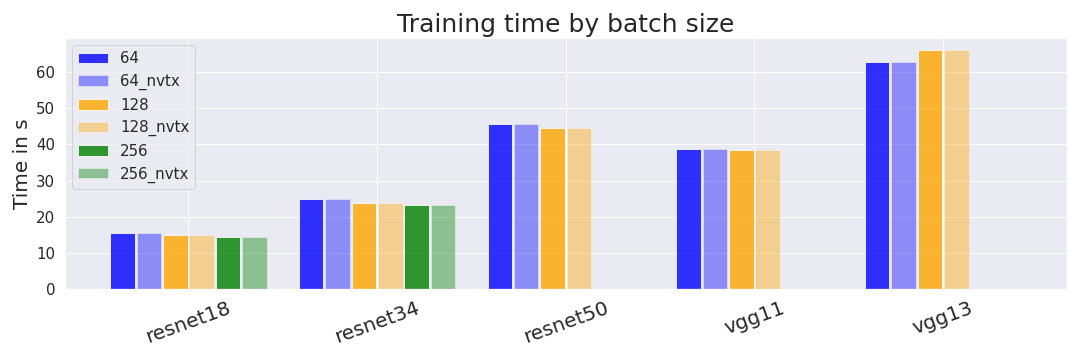
We find that, as expected, larger batch sizes lead to minimally shorter training times for 4 out of the 5 models. We are not sure why VGG13 is an exception. We would have expected the differences between batch sizes to be larger but don’t have a strong explanation for the observed differences. A possible hypothesis is that our measurement of GPU time (compared to wall-clock time) hides some overhead that is usually reduced by larger batch sizes.
Shorter training times directly translate into higher utilization rates since training time is part of the denominator.
Backward-forward pass ratios
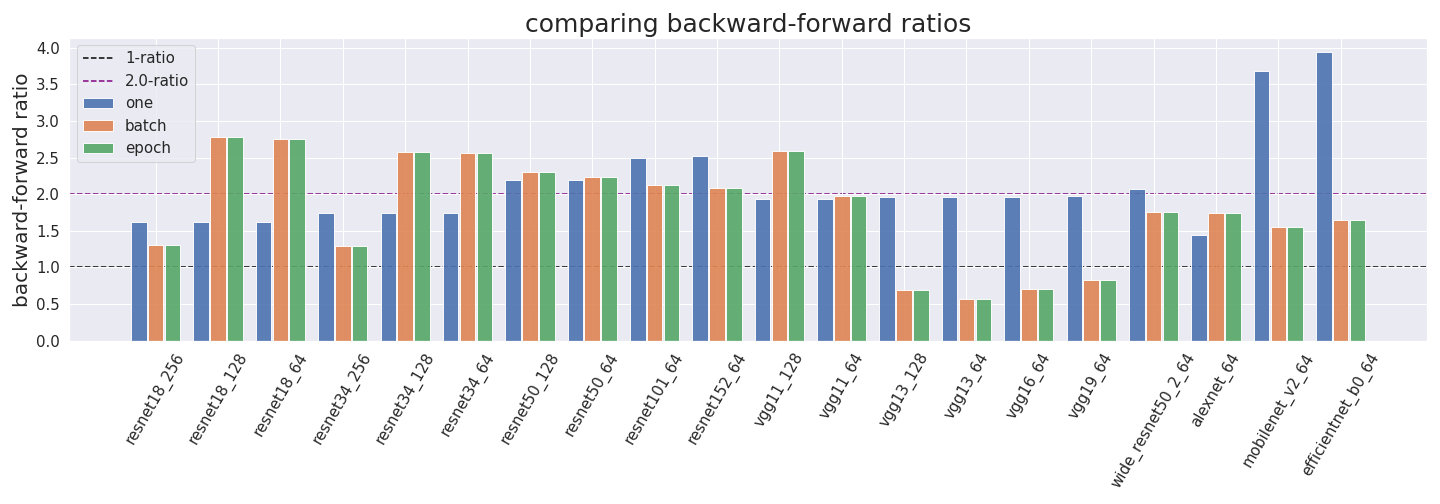
From the detailed analysis of profiler_nvtx (see above), we estimate that the backward pass uses 2x as many FLOP as the forward pass (there will be a second post on comparing backward/forward ratios in more detail). OpenAI has also used a ratio of 2 in the past.
We wanted to further test this ratio empirically. To check consistency we tested these ratios for a single forward pass with batch size one (one) an entire batch (batch) and an entire epoch (epoch).
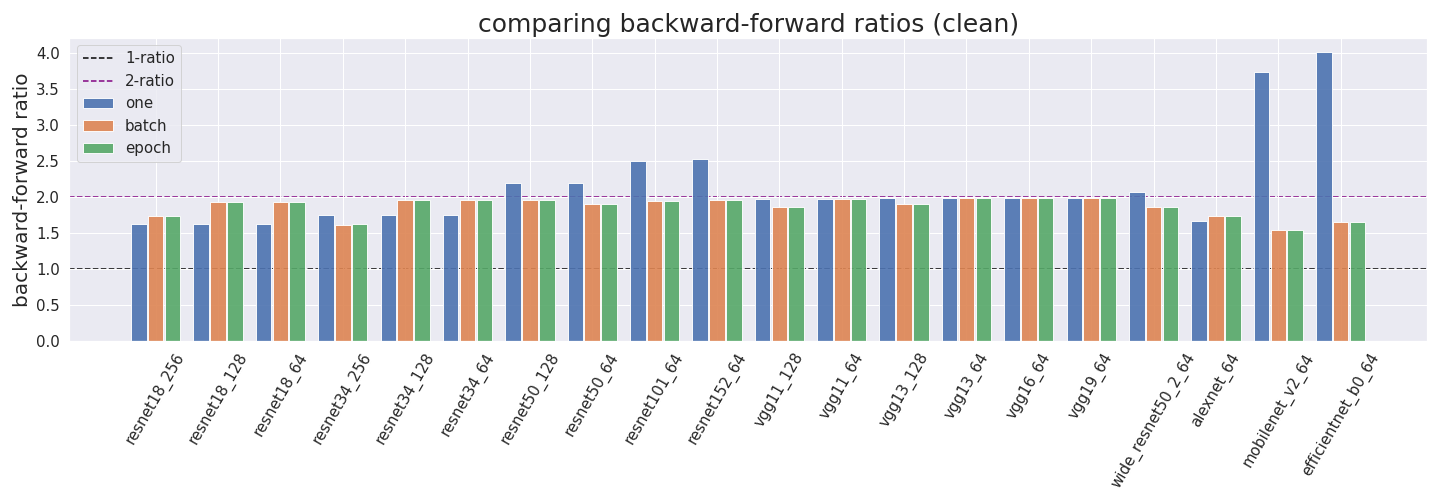
We find that the empirical backward/forward ratios are mostly around the 2:1 mark. Some of the exceptions are likely due to undercounting, i.e. profiler_nvtx just not registering an operation as discussed above.
We assume that the outliers in mobilenet and efficientnet come from the profiler incorrectly measuring FLOP for inverted bottleneck layers.
Utilization rates
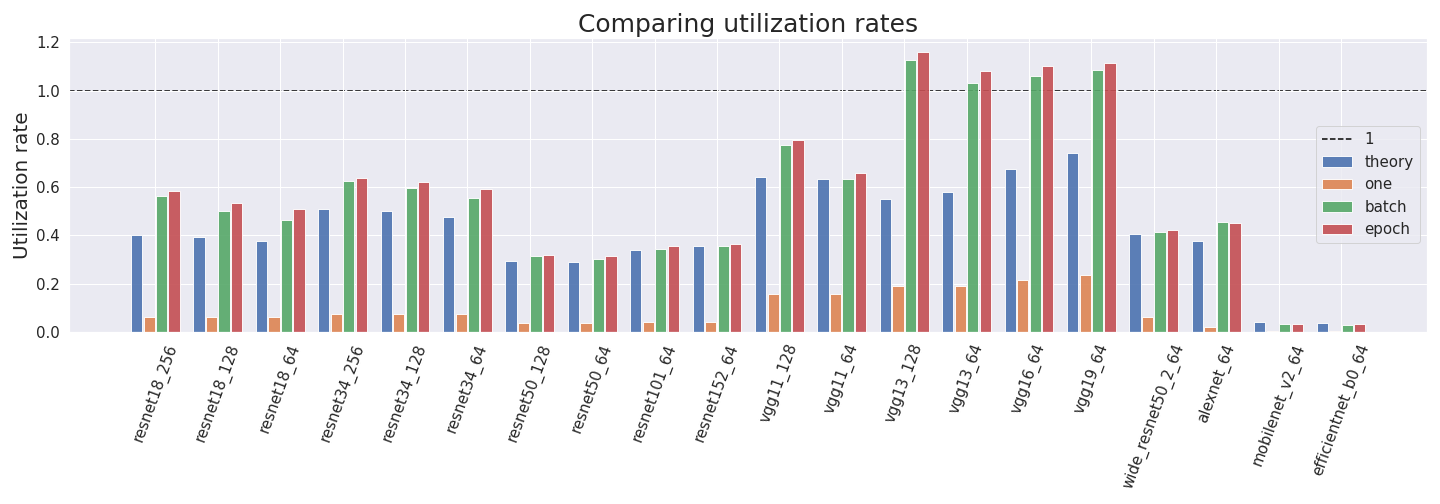
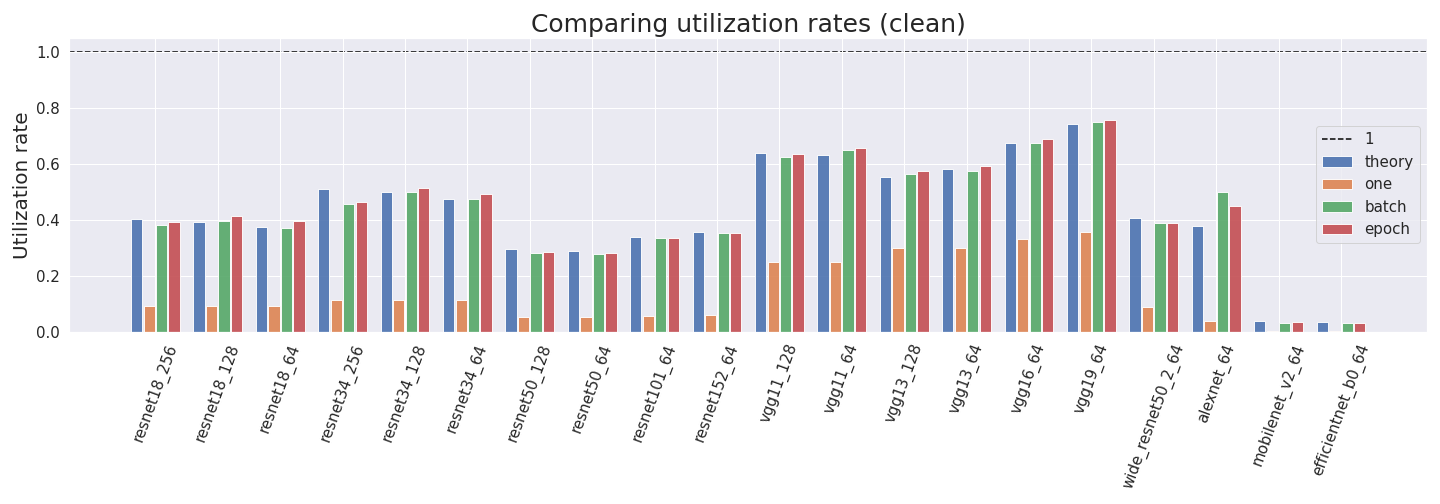
Ultimately, we want to estimate utilization rates. We compute them by using four different methods:
- Theory method: We get the forward pass FLOP estimate of fvcore and multiply it by 3.0 to account for the backward pass. Then, we divide it by the product of the GPU training time and the peak GPU performance of the Tesla P100.
- One method: We take the profiler_nvtx estimate for the forward and backward passes, and divide it by the product of the training time and maximal GPU performance.
- Batch method: We perform the same procedure for one batch.
- Epoch method: We perform the same procedure for one epoch.

We can see that the utilization rates predicted by the theory are often comparable to the empirical measurements for batch and epoch. We can also see that the batch and epoch versions are usually very comparable while just forwarding and backwarding one sample is much less efficient. This is expected since the reason for larger batch sizes is that they utilize the GPU more efficiently.
Most realistic utilization rates are between 0.3 and 0.75. Interestingly (and ironically), the least efficient utilization rates come from efficientnet and mobilenet which have low values in all approaches. We assume that the outliers come from the profiler incorrectly measuring FLOP for inverted bottleneck layers.
Conclusion
We use different methods to compute the utilization rate of multiple NN architectures. We find that most values lie between 0.3 and 0.75 and are consistent between approaches. Mobilenet and efficientnet pose two outliers to this rule with low utilization rates around 0.04. We assume that the outliers come from the profiler incorrectly measuring FLOP for inverted bottleneck layers.
Appendix
We tried to run dlprof since it looks like one possible solution to the issues with the profiler we are currently using. However, we were unable to install it since installing dlprof with pip (as is recommended in the instructions) always threw errors in Colab. I installed dlprof on another computer and wasn’t able to get FLOP information from it.
Original versions of the main figures
These versions are done without accounting for double counting. Thus, the results are wrong. We want to show them to allow readers to compare them to the cleaned-up versions.
